HAL Id: hal-02570226
https://hal.archives-ouvertes.fr/hal-02570226
Submitted on 11 May 2020
HAL is a multi-disciplinary open access
archive for the deposit and dissemination of
sci-entific research documents, whether they are
pub-lished or not. The documents may come from
teaching and research institutions in France or
abroad, or from public or private research centers.
L’archive ouverte pluridisciplinaire HAL, est
destinée au dépôt et à la diffusion de documents
scientifiques de niveau recherche, publiés ou non,
émanant des établissements d’enseignement et de
recherche français ou étrangers, des laboratoires
publics ou privés.
Positive Effect of Blue Wavelengths
Alexandre Barnett, Vona Méléder, Christine Dupuy, Johann Lavaud
To cite this version:
Alexandre Barnett, Vona Méléder, Christine Dupuy, Johann Lavaud. The Vertical Migratory Rhythm
of Intertidal Microphytobenthos in Sediment Depends on the Light Photoperiod, Intensity, and
Spec-trum: Evidence for a Positive Effect of Blue Wavelengths. Frontiers in Marine Science, Frontiers
Media, 2020, 7, �10.3389/fmars.2020.00212�. �hal-02570226�
doi: 10.3389/fmars.2020.00212
Edited by: Dongyan Liu, East China Normal University, China Reviewed by: Guang Gao, Xiamen University, China Deyong Sun, Nanjing University of Information Science and Technology, China *Correspondence: Alexandre Barnett alexandre.barnett@univ-nantes.fr
Specialty section: This article was submitted to Marine Ecosystem Ecology, a section of the journal Frontiers in Marine Science Received: 25 January 2020 Accepted: 18 March 2020 Published: 21 April 2020 Citation: Barnett A, Méléder V, Dupuy C and Lavaud J (2020) The Vertical Migratory Rhythm of Intertidal Microphytobenthos in Sediment Depends on the Light Photoperiod, Intensity, and Spectrum: Evidence for a Positive Effect of Blue Wavelengths. Front. Mar. Sci. 7:212. doi: 10.3389/fmars.2020.00212
The Vertical Migratory Rhythm of
Intertidal Microphytobenthos in
Sediment Depends on the Light
Photoperiod, Intensity, and
Spectrum: Evidence for a Positive
Effect of Blue Wavelengths
Alexandre Barnett1,2* , Vona Méléder1,2, Christine Dupuy1and Johann Lavaud1,3
1UMR7266 LIENSs ‘Littoral, Environnement et Sociétés’, Institut du Littoral et de l’Environnement, CNRS/Université de La
Rochelle, La Rochelle, France,2UPRES EA 2160 MMS ‘Mer, Molécules, Santé’, Faculté des Sciences et Techniques,
Université de Nantes, Nantes, France,3UMI3376 Takuvik, CNRS/ULaval, Département de Biologie, Université Laval,
Quebec City, QC, Canada
Estuarine intertidal flats strong biological productivity is mainly based on the activity of benthic microalgae communities or microphytobenthos (MPB), mostly dominated by diatoms. Epipelon is a major MPB growth form comprising motile species, which perform repeated “vertical migration” patterns in the upper sediment layers according to tidal and diurnal cycles with upward migration at the beginning of the daylight emersion and downward migration before immersion starts. Although this fascinating behavior has been extensively studied for more than a century, many of its features remain uncharacterized. Epipelon migratory rhythms are believed to be driven by an endogenous internal clock of unknown nature in combination with diverse environmental stimuli. Among the environmental stimuli impacting on MPB vertical migration, light is probably the most important. Rhythmic changes in surface abundance of natural MPB assemblages were therefore continuously assessed at high frequency by Imaging-PAM fluorimetry in fresh sediment sampled at different seasons, comprising 85 migration profiles from 40 sediment samplings over 2 years, and exposed to different light conditions without any other environmental stimuli (i.e., no tidal-like water flow and stable optimal temperature). In particular, we manipulated (i) the 24-h natural photoperiod MPB that was acclimated to in order to disentangle the tight link between the diurnal and tidal rhythmicity of epipelon migration, and (ii) the light spectrum in order to potentially influence MPB accumulation at the surface of sediment. We found that the migration rhythmicity mapped onto the tidal cycle but that it was modulated, and even overridden, by the diurnal cycle and by the irradiance level during daytime periods with a positive phototactic upward migration up to a certain threshold (in our conditions, 120 µmol photons m−2 s−1 of white light). Also, we found blue wavelengths (465 nm) triggered
MPB surface accumulation, as compared to other wavelengths (white, green, and red) in patterns that were intensity-dependent and species-dependent. In particular, we found two species, Navicula spartinetensis and Gyrosigma fasciola, which strongly migrate up under blue light and could potentially be used as model species for further studying the light-responses of intertidal MPB.
Keywords: blue light, diatoms, intertidal flats, pigments, migration, photoperiod
INTRODUCTION
Estuarine intertidal flats are among the most productive ecosystems on Earth (Underwood and Kromkamp, 1999). They play a paramount role in the functioning of coastal food-webs and they support essential local socio-economic activities (Lebreton et al., 2019). Tidal flats high biological productivity is mainly based on the activity of benthic microalgal communities or microphytobenthos (MPB) (Admiraal, 1984;
Lebreton et al., 2019). In temperate marine areas, MPB is mostly dominated by diatoms (Ribeiro et al., 2013), which display a high degree of taxonomic and functional diversity (Kooistra et al., 2007;Barnett et al., 2015; Nakov et al., 2018). A major growth form of MPB diatoms is epipelon, which mostly inhabits fine cohesive sediments and comprises raphid diatom species moving freely in between sediment particles. The motility of epipelic diatoms is ensured by a slit (raphe) in their cell wall (frustule), which allows for directional and reversible locomotion (Cohn, 2001;Cohn et al., 2016) driven by highly sophisticated suites of micromovements (Apoya-Horton et al., 2006; Bertrand, 2008). Motility is a key adaptation to the intertidal sedimentary habitat providing epipelic diatoms with many ecological benefits including the colonization of microhabitats with specific light, nutrient, and temperature conditions, coping with environmental extreme variations, optimization of photosynthetic productivity, pheromonal-based sexual attraction, and tidal resuspension avoidance (see
Consalvey et al., 2004; Marques Da Silva et al., 2017; Nakov et al., 2018, and references therein). The most known and fascinating display of this motile behavior is the “vertical migration” occurring in the upper sediment layers (Consalvey et al., 2004). Typically, at the beginning of daylight emersion (but not during nighttime), epipelic diatoms move upward and form dense and transient photosynthetic biofilms at the surface of sediment. Then, generally before and/or when immersion and/or night start, they move back downward in the deeper sediment layers. This rhythmic pattern repeats according to tides and photoperiod and is continuously reset to match the daily and fortnightly tide timings and the progressive seasonal changes in day length. Vertical migration was proposed to confer MPB with the ability to optimally exploit the physicochemical gradients of the intertidal sediments for performing photosynthesis and carbon fixation in well-lit upper sediment layers, spatially disconnected from cell division in nutrient-rich, stable, and darkened deeper layers (Saburova and Polikarpov, 2003; Consalvey et al., 2004). In that framework, the acquisition of motility obviously appears as the central motor of pennate diatom adaptation to life,
and dominance, in intertidal sediments (Kooistra et al., 2007;
Nakov et al., 2018).
Rhythmic MPB vertical migration has been recognized as a key regulating factor of MPB photosynthetic activity and mudflat primary productivity (Serôdio et al., 2005;Spilmont et al., 2007;
Haro et al., 2019). The conceptualization of MPB migration dynamics (Guarini et al., 2008) opened a path to improvements in coupled biological-physical modeling attempts of mudflat primary production (Guarini et al., 2006). In this framework, the quantification of the MPB photosynthetically active biomass (PAB) at the surface of sediment (Herlory et al., 2005) and the precise measurement of its spatial and temporal dynamics (Consalvey et al., 2004), as well as its photosynthetic productivity (Kwon et al., 2012;Cartaxana et al., 2016a;Haro et al., 2019), have received major interest. It is generally accepted that rhythmic MPB migration is first governed by the tidal and diurnal cycles, which, together, control the light availability at the surface of sediment. Therefore, among the numerous environmental stimuli that impact on epipelon motility (i.e., temperature, salinity, nutrient availability, depth of the oxic sediment layer, etc.), light is probably the most important (Consalvey et al., 2004). Intertidal MPB indeed experience an extremely complex and continuously changing light environment (Paterson and Hagerthey, 2001), depending on a multifaceted combination of turbidity of the shallow water column at high tide (HT), and open-field–like light fluctuations at low tide (LT). The sediment-dependent light penetration generates (Kuhl and Jorgensen, 1994;
Cartaxana et al., 2016b): (i) a photic zone condensed to the first hundreds ofµm, (ii) a deeper light penetration in coarser sediment versus more cohesive fine mud, and (iii) a stronger depth attenuation of the blue band (450–500 nm) of the visible light spectrum and thus a steeper gradient of blue light compared to other spectral bands.
Previous attempts have successfully manipulated the light environment of MPB in controlled laboratory conditions, especially in order to disentangle the impact of the tidal and diurnal cycles on the rhythm of MPB vertical migration (Kwon et al., 2012; Haro et al., 2019). Nevertheless, these studies were performed on permanently submersed intertidal sediment, thereby artificially exacerbating the diurnal versus the tidal response as reported forin situ subtidal sediment (Ni Longphuirt et al., 2006). Additionally, only one previous work (Wenderoth and Rhiel, 2004) has explored the effect of monochromatic wavelengths on daytime MPB vertical migration. Therefore, the present study is a further complementary step: we used imaging Chl a fluorimetry on freshly sampled intertidal sediment to continuously measure at high frequency the changes in surface epipelic PAB without any other abiotic stimuli than light (i.e., in
particular, no sediment submersion or tidal-like water flow, and stable optimal temperature). We thereby explored the integrative effects of light photoperiod, intensity, and spectrum at different time scales from the emersion timing to seasonal on the rhythmic changes in MPB abundance at the surface of sediment. We have found that intertidal MPB vertical migration rhythm (i) primary tracks the tidal and diurnal cycles but to different extents, (ii) is strongly modulated by light intensity and spectrum, (iii) positively influenced by blue wavelengths at the species level by increasing the presence and abundance of cells at the surface of sediment.
MATERIALS AND METHODS
Study Site and Sediment Harvesting
Sediment samples were regularly collected at LT from March 2011 to March 2013 (Supplementary Table S1) in the upper zone (500 m from the shore, ca. 4 m above the marine chart
datum) in the bay of l’Aiguillon (“Esnandes” site, 46◦
15.360
N, 1◦
8.550
W), an intertidal mudflat site on the Atlantic French coast (Figure 1). There, sediment is mostly composed of fine muddy particles (particle size <63 µm) (Herlory et al., 2004) and is hereafter referred to as “muddy sediment.” Occasionally, sediment was also sampled in the bay of Bourgneuf (“Lyarne” site, 47◦ 20 3500 N, 1◦ 590 5900
W) where sediment is composed of muddy sand (63–200 µm particles) (Méléder et al., 2007) and hereafter referred to as “sandy-muddy sediment.” For both sites, the MPB community is largely dominated by diatoms throughout the year (Herlory et al., 2004;Méléder et al., 2007). The upper layer (approximately the top first centimeter) of sediment was collected at LT and immediately brought back to the laboratory. After sieving through a 500-µm mesh to remove macrofauna, especially the mud snail Peringia species, the sediment was homogenized by thorough mixing and was spread as a plane layer in 4-cm-depth plastic trays (Serôdio et al., 2012). In order to keep the sediment hydrated throughout the measurements, it was homogenized each 24 h at the time of the in situ HT (i.e.,
FIGURE 1 | A map of the Pertuis Charentais, France, showing the Bay of l’Aiguillon and the location of our sampling site, Esnandes (red dot). Bathymetry was retrieved from the General Bathymetric Chart of the Oceans (GEBCO International) database and plotted using R software with the use of the marmap package (Pante and Simon-Bouhet, 2013).
corresponding to the highest water level at the site of sampling) with filtered (GF/F, 0.7µm) fresh seawater. In these conditions, MPB conserved its natural migratory rhythm for several days (5 ± 1 days; Supplementary Figure S1).
Monitoring of the Motile MPB Abundance
Under Different Light Conditions
The “instantaneous” Chl a fluorescence Ft was used as a
proxy for the MPB biomass present at the surface of sediment (see section “Monitoring of the Changes in the MPB PAB at the Surface of Sediment by Imaging-PAM Fluorimetry”). Ft
measurements were converted into Chl a concentration per surface of sediment (Chla m−2) as detailed in Supplementary
Figure S2.Ft was continuously monitored for 24 h on sediment
trays placed under an Imaging-PAM fluorometer (Maxi-PAM M-series; Walz, Effeltrich, Germany) and by using its blue (470 nm) detecting beam (settings: intensity 0, frequency 1, measuring frequency 900 s). A map of the irradiance provided by the detecting beam at the surface of sediment tray is shown in Supplementary Figure S3. Five “areas of interest” of 6.4 cm2, corresponding to 1,500 pixels (Serôdio et al., 2012), and for which the Ft values of all pixels are averaged, were
randomly selected. This way, and even if the sediment was well homogenized before each measurement, random “areas of interest’ were used as pseudoreplicates for each sediment tray so that each measurement took into account possible remaining heterogeneity of the Chla fluorescence signal across the tray. All experiments were carried out at 20◦
C, which is optimal for MPB activity throughout the year (Blanchard et al., 1997;Savelli et al., 2018). The reason for maintaining the temperature optimal for all experiments, whatever the season sampling, was to focus only on the effect of light, and therefore to discard effect of temperature on MPB migration that could have potentially confound the output of our experiments.
For each experiment, two phases were recorded: (1) Phase 1: “MPB migration control”, the first 24-h tidal cycle (based on the in situ water level at the site of sampling) was recorded under “ambient filtered true light” conditions (i.e., light passing by the window of the laboratory, 24-h natural photoperiod, no direct sunlight) as a control for the changes of the MPB biomass at the surface of the sediment; this option was chosen over an artificial light control in order to take into account the photoperiod and irradiance seasonal changes while keeping the ambient light conditions favorable to MPB migration in the laboratory (i.e., to, for instance, avoid photoinhibitory conditions in summer); (2) Phase 2: after homogenization of the sediment with seawater (see above), the second 24-h tidal cycle was monitored under different conditions of light intensities and spectra using 4 LED panels (FloraLEDs; Plant Climatics, Wertingen, Germany): darkness (Imaging-PAM and sediment tray placed under a black box), “white” light (20, 120, and 350µmol photons m−2
s−1, respectively, the minimum, intermediate, and maximum
intensities reached by the mix of different LED sources with 459- and 553-nm maximum wavelengths), blue light (BL; 10, 40, and 120µmol photons m−2
s−1
, respectively, the minimum, intermediate, and maximum intensities reached at 465 nm), red
light (180 µmol photons m−2 s−1, which was the maximum
intensity reached at 677 nm, with and without far red 748 nm), and green light (10 and 40µmol photons m−2
s−1
, the minimum and maximum intensities reached by “white” light with a 530-nm filter; 124 Dark Green Lee filter; Lee, Andover, England) (full spectra in Supplementary Figure S4). For each light condition, a new sediment tray was used, and a new “MPB migration control” was recorded.
We additionally performed “desynchronization experiments” where the photoperiod was artificially inverted. For doing so, during the “control” Phase 1, the day/night photoperiod was artificially provided following the 24-h natural photoperiod timings by applying a “white light” of 120µmol photons m−2
s−1
with the LED panels. During Phase 2, the photoperiod was artificially inverted by applying the same white light during the natural night period and darkness during the natural day period. The profiles of MPB abundance at the surface of the sediment were analyzed by computing two parameters: (1) the maximum MPB abundance reached during the daytime period of the measurement, (2) the area under the curve that integrates total MPB abundance changes during the 24-h monitoring over the first 24 h of “MPB migration control.” In previous works (Guarini et al., 2006;Coelho et al., 2011), the maximum and integrated MPB abundances were, respectively, used as proxies for the maximum and for the total PAB of MPB present at the surface of the sediment. The graphic analysis of PAB was performed using Excel 2010; total PAB was computed with the Integral (gamma.xla) macro provided by http://fordom.free.fr.
For all experiments and under all light conditions described above (Supplementary Table S2), we regularly probed the “instantaneous” effective quantum yield of photosystem II (PS II) photochemistry (8PSIIinst, see section “Chlorophyll a Fluorescence Yield and Light Curves”) under current light conditions and when the daytime maximum MPB abundance was reached:
8PS IIinst = F
0
m− Ft
Fm0 (1)
whereFt is the “instantaneous” Chla fluorescence yield, and
Fm0the maximum Chl a fluorescence yield measured by firing
a saturating pulse (see section “Chlorophylla Fluorescence Yield and Light Curves”).
Sediment Sampling
Sediment cores (diameter 3.2 cm, height 3 cm) were collected in the sediment tray for pigments (see section “Pigments Analysis”) and species diversity (see section “Diatom Species Identification and Diversity Analysis”) analyses. Sampling was performed during the “control” and BL conditions for different seasons: 10µmol photons m−2 s−1 BL summer, and 40 and 120µmol
photons m−2 s−1 BL winter and summer, and at three timings
of the correspondingin situ tidal cycle: (1) at the timing of the in situ LT (i.e., corresponding to the lowest water level at the site of sampling), (2) 3 h before LT (BLT), and (3) 3 h after LT (ALT). The sediment cores were immediately frozen in liquid nitrogen and stored at −80◦
Pigments Analysis
The pigment content of sediment was determined by reversed phase HPLC (Hitachi High Technologies Co., Tokyo, Japan) calibrated for Chla (expressed inµg Chl a cm−2
; Supplementary Figure S2). In order to decipher the vertical pigment content, the surface of three sediment cores (see section “Sediment Sampling”) was cut in three sublayers (0–200, 200–400, and 400–600 µm) with a cryomicrotome (Leica CM1850; Leica Microsystems Nusslch GmbH, Nussloch, Germany). The sediment samples were lyophilized during 24 h, and the pigments were extracted with 0.5 mL of a mixture of 90% methanol/0.2 M ammonium acetate (90/10 vol/vol) and 10% ethyl acetate (Lepetit et al., 2013). Pigment quantification was as described before (Jakob et al., 1999), and Chl a content was normalized to the sediment dry weight (g−1
). The xanthophyll de-epoxidation state (DES in%) was calculated as:
DES = DT
DD + DT × 100 (2)
where DD is the diadinoxanthin, the epoxidized form; and DT is the diatoxanthin, the de-epoxidized form.
Chlorophyll a Fluorescence Yield and
Light Curves
In order not to disturb the monitoring of MPB biomass changes with the Imaging-PAM and to discard potential limitations in the measurement of photosynthetic performance by Imaging fluorimetry (Vieira et al., 2013), the Chl a fluorescence yield was monitored on the MPB containing sediment surface with a Water-PAM fluorometer (Fiber version; Walz) at the same timings as the sediment sampling, that is, BLT, LT, and ALT (see section “Sediment Sampling”). Chlorophyll a fluorescence was excited by a non-actinic modulated 460-nm light, and a saturating pulse of BL (3,000µmol photons m−2s−1) was fired
in order to, respectively, measure the minimum (F0) and the
maximum (Fm) PS II fluorescence yield on sediment previously
dark-adapted for 10 min. The maximum quantum yield of PS II photochemistry was calculated as the ratioFv/Fm, where
Fv = Fm − F0 (3)
Rapid light curves (RLCs) were recorded in triplicates at three different randomly selected locations on the sediment tray. The sediment surface was exposed to eight successive light steps of increasing intensity (E) provided by the LED source of the Water-PAM. The duration of each light step was 30 s as recommended before (Lefebvre et al., 2011). Rapid light curves allowed construction of PSII relative electron transport rate (rETR) versus E curves and non-photochemical quenching (NPQ) versus E curves. Relative electron transport rate was calculated as rETR = 8PS II × E (4) Where 8PS II = Fm0 − F 0 Fm0 (5) F0
being the fluorescence steady-state yield measured after 30-s illumination at a given E, and Fm0, the maximum fluorescence
yield measured at the end of eachE by firing a saturating pulse. Non-photochemical quenching was calculated as
NPQ = Fm − Fm
0
Fm0 (6)
NPQmwas the maximum NPQ induced during the RLC protocol.
The rETR-E curves were fitted with the mathematical model of
Eilers and Peeters (1988). It allowed extraction of rETRm, the
maximum rETR (rETRm, the asymptote of the curve);α, the use light efficiency (the slope at the beginning of the curve); andEk, the light saturation parameter:
Ek =
rETRm
α (7)
Diatom Species Identification and
Diversity Analysis
Frozen cores were carefully melted, and “Crème brulée” samplers (Laviale et al., 2015) were used to collect the first 250 µm of sediment (∅ 1.4 cm, 1.5 cm2). To facilitate cell observation and determination, definitive slides were made after their separation from sediment using Ludox HS-40 colloidal silica (SPCI S.A., St. Denis de la Plaine, France) as described before (Méléder et al., 2007). A 48-h decantation allowed separation between cells (at the bottom of the tube) and mineral particles (in Ludox). Settled material was rinsed by centrifugation in distilled water (at least five times) and observed with a photonic microscope. Definitive slides were made after cremation (2 h, 450◦
C) to observe clean diatom cell frustules mounted in a high-resolution diatom mountant (Naphrax; Brunel Microscopes Ltd., Chippenham, Wiltshire, United Kingdom). Species were identified based on morphology (Witkowski, 2000;Ribeiro, 2010). When photonic microscopy was inconclusive, scanning electron microscopy was used. For species composition analysis, a total of ∼300 diatom frustules were counted to determine specific abundances.
Statistical Analysis
Total and maximum PAB: they were analyzed using one-way analysis of variance (ANOVA) to estimate which PAB proxy was the most impacted by which of the light conditions used. RLC photosynthetic parameters: the effects of (i) light conditions (BL 10 and 120 µmol photons m−2
s−1
and their respective control) and of (ii) the tide sampling timing (BLT, LT, and ALT) were tested using a two-way ANOVA.Pigment content of sediment: the effect of the season (Winter and Summer), the light conditions (control winter and summer, and BL 10, 40, and 120µmol photons m−2
s−1
), and of the tide sampling timing (BLT, LT, and ALT) were tested using a three-way ANOVA. When significant, ANOVA tests were followed by a post hoc Tukey test to highlight differences. Diatom species abundance: Hclustering was performed with the Ward.D method in order to group the diatom species and to highlight the groups of interest. All statistical analyses were performed using R software (R Foundation for Statistical Computing, Vienna, Austria).
RESULTS
Vertical Migration Pattern of MPB as a
Function of Sediment Type, LT Timing,
and Seasons
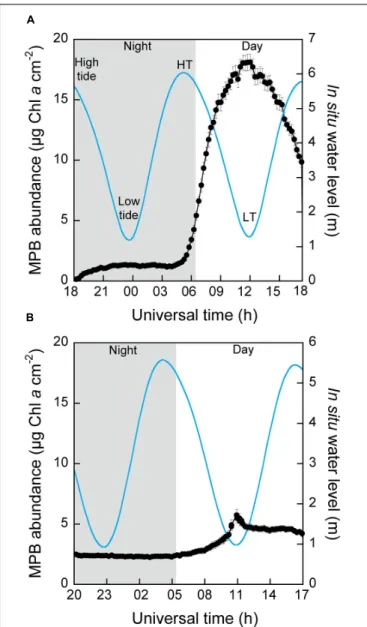
We monitored MPB abundance at the surface of sediment over 24 h under our light control conditions of 24-h natural photoperiod) at the surface of muddy [dominated by motile epipelon (Serôdio et al., 2012) and sandy-muddy sediments (dominated by epipsammon (Méléder et al., 2007)] (Figure 2). For muddy sediment, very low surface MPB abundance occurred at night but rapidly increased with the sun rising, going on through the daytime period until reaching a maximum at approximately solar noon before it decreased (Figure 2A). This bell-like pattern also closely followed the daytime period in situ water level at the site of sediment sampling (spring tide), although the sediment was continuously exposed to air in our laboratory conditions. Coincidentally, MPB abundance increased from the day HT to the LT timing, reaching a maximum at a timing close to the one of the lowest in situ water level (11:15–12:00 vs. 12:00 h Universal Time), and it then decreased from LT timing toward HT (Figure 2A). These rhythmic changes in MBP abundance were maintained for 5 ± 1 days in our laboratory conditions with, importantly, a sustained daily shift and therefore time correspondence between the timings of LT and of surface MPB maximal abundance (Supplementary Figure S1). Simultaneously, we probed 8PSIIinst, the “instantaneous” effective quantum yield of PS II photochemistry, when the maximum MPB abundance was reached to check if our laboratory conditions negatively influenced photosynthetic potential of MPB and therefore its light response, which was confirmed as not being the case with 8PSIIinst remaining at near optimal levels of 0.689 ± 0.004. Such verification of 8PSIIinst was subsequently performed for all experiments under all light conditions tested (Supplementary Table S2). For sandy-muddy sediment, we observed a similar (i) coincidence between the maximum MPB surface abundance with solar noon and (ii) inverse relationship between MPB abundance changes andin situ water level with a maximum MPB abundance occurring exactly at LT timing (Figure 2B). Nevertheless, major differences appeared compared to muddy sediment: (1) integrated MPB abundance was higher at night, (2) MPB maximum abundance was approximately five times lower during daytime emersion, (3) the speed to reach the MPB maximum abundance was much slower, and (4) after reaching its maximum, MPB abundance remained mostly stable, thus breaking the inverse relationship with thein situ water level.8PSIIinst again remained high (0.666 ± 0.004, Supplementary Table S2).
Because it provided the strongest and clearest signal, we went on studying migration phenomenon with muddy sediments only. When thein situ LT timing did not coincide with solar noon (as in Figure 2A), the pattern of MPB abundance changes was different. Two main patterns complementary to Figure 2A are shown in Supplementary Figure S5 (Supplementary Figure S5A: neap tide, Supplementary Figure S5B: spring tide). Whenin situ LT timing (18:07 h UT) was close to sunset (19:15 h UT), MPB
FIGURE 2 | Microphytobenthos (MPB) abundance (µg Chl a cm−2) at the
surface of sediment and in situ water level (m) at the site of sampling as a function of universal time (h UT) measured continuously for 24 h under control light conditions (i.e., 24-h natural photoperiod) for (A) muddy sediment mostly inhabited by epipelic diatoms and (B) sandy-muddy sediment mostly inhabited by epipsammic diatoms. Black line: MPB abundance (µg Chl a cm−2); blue line: water level (m) at the site of sampling; gray and white
backgrounds: the natural night and day periods, respectively.
Microphytobenthos abundance was derived from Chl a fluorescence (Ftlevel)
as measured with an Imaging-PAM and HPLC analysis of Chl a sediment content (Supplementary Figure S2); values are the mean ± SD of 5 Imaging-PAM “areas of interest” on the sediment tray. Water-level data were retrieved from the Service Hydrographique et Océanographique de la Marine (SHOM, France) database. See Section “Materials and Methods” for further details, and Supplementary Figure S5 for MPB abundance patterns when the low tide timing was close to sunset and/or sunrise (i.e., spring and neap tides).
abundance started to increase just after the timing of in situ HT, again reaching a maximum significantly before (16:55 h UT) LT timing and sunset, so that MPB abundance reached an
approximately 0 value only 3 h after sunset (Supplementary Figure S5A). Whenin situ LT timing was close to sunrise (∼1 h 15 after sunrise), the maximum MBP abundance followed two patterns as a function of the precedingin situ LT timing event (i.e., neap tide or spring tide, respectively): (1) when the later was just before sunset (∼1 h 15), MPB abundance started to increase the same way as during the preceding daytime period, that is, following the in situ water level decrease independent of the day–night alternation (here ∼2 h before sunrise) and reaching its maximum just after thein situ LT timing with no coincidence with solar noon (Supplementary Figure S5A); (2) when the preceding in situ LT was at night, MPB abundance started increasing with sunrise, reaching its maximum after the in situ LT timing and at a time closer to solar noon (Supplementary Figure S5B).
Taking into account these patterns and their variations, we compiled 85 profiles from 40 sediment samplings over 2 years (Supplementary Table S1) in order to compute (i) the total PAB (Guarini et al., 2006; Coelho et al., 2011) of MPB present at the surface of sediment (the integrated area under the curve), and (ii) the maximum surface PAB reached during daytime LT period. Note that total PAB was computed over 24 h, including nighttime, in order to analyze both MPB abundance changes occurring during daytime (Figure 2A) and closer to sunrise and/or sunset (Supplementary Figure S5). When PAB was plotted versus the in situ level of low waters, there was no clear trend (Figure 3A and Supplementary Figure S6A). When plotted versus thein situ LT timing, a clearer pattern was observed (Figure 3B and Supplementary Figure S6B): (i) the maximum and total PAB were recorded at daytime LT timings independent of the season; (ii) there was a tendency for the highest values of maximum PAB to be reached when the LT timing coincided with solar noon (ca. 12:00 ± 2:00 h UT) as in Figure 2A. When plotted versus sampling date (Figure 3C and Supplementary Figure S6C), the highest PAB values occurred by the end of winter–beginning of spring, they decreased to reach a minimum in summer and autumn and increased again through the next winter. For all experiments,8PSIIinst was high (0.681 ± 0.026, Supplementary Table S2).
Vertical Migration Pattern of MPB as a
Function of Light Regimes
In a following step, we manipulated the 24-h natural photoperiod to study its impacts on MPB abundance changes at the surface of sediment. First, we artificially replaced the daytime period by night resulting in 24-h continuous darkness and the other way around (Figures 4A,B, respectively). Before such manipulation, MPB migration was recorded for 24 h the same way as described in Figure 2A, reaching a similar maximum PAB: 15.8 ± 0.7 µg Chl a cm−2 (Figure 4A) and 16.0 ± 0.7 µg
Chl a cm−2 (Figure 4B). When exposed to 24-h darkness,
changes in MPB abundance followed a similar pattern as during the preceding 24 h of 24-h natural photoperiod, except the maximum PAB reached during subjective daytime period was lower: 11.3 ± 0.9 µg Chl a cm−2
(Figure 4A); 8PSIIinst
FIGURE 3 | Microphytobenthos total photosynthetically active biomass (PAB) at the surface of muddy sediment as function of (A) low water level at the site of sampling (i.e., the lowest water level, which depends on the tidal amplitude), (B) the low tide timing (h UT) at the site of sampling (i.e., corresponding to the lowest water level), and (C) the date of sampling (month abbreviations are Mar, March; Jun, June; Sep, September; Dec, December). In order to facilitate visualization, months were pooled under season labels: spring (circles), summer (squares), autumn (diamonds), and winter (triangles). Values are the mean ± SD of 5 Imaging-PAM “areas of interest” on the sediment tray. Water level and low tide timing data were retrieved from the Service Hydrographique et Océanographique de la Marine (SHOM, France) database.
24-h light (Figure 4B), MBP abundance immediately increased upon onset of the artificial light even if during subjective nighttime period, reaching a maximum (5.9 ± 0.6 µg Chl a cm−2) at a time coinciding with the in situ LT timing and
maintaining at this maximum. During the following daytime period, (i) the increase in MPB abundance was slower than during the first 24-h daytime period so that the occurrence of the maximal PAB was delayed by approximately 2 h (i.e., it occurred 90 min after the in situ LT timing instead of 30 min before), and (ii) the value of maximum PAB was much higher: 24.7 ± 0.6 µg Chl a cm−2
. Although 8PSIIinst decreased, it remained relatively high (0.588 ± 0.037, Supplementary Table S2).
In a second manipulation, we aimed at desynchronizing MPB migration from the 24-h natural photoperiod and eventually from the in situ tidal cycle. We continuously monitored MPB migration over several days, and after a first 24-h exposure to an artificial light regime exactly matching the 24-h natural photoperiod, we inverted it by exposing the sediment to darkness during subjective daytime (starting Day 2) and by applying the same artificial light as in Figure 4B during subjective nighttime periods (Figure 4C). After 1 day under the new light regime (Days 2–3 in Figure 4C), MPB abundance changes showed a similar pattern as for the short-time experiments described in Figures 4A,B. This pattern was kept along the 4 following days with a maximum PAB always reached by the end of the light period would it be during artificial daytime (Day 1, similar as Figure 4B, and coinciding with the timing of thein situ LT) or subjective nighttime (the following days). Of paramount interest was the fact that in the meantime the timings of the in situ LT shifted by 60 ± 15 min per day. It generated a complete loss of synchronization between the timing of maximum PAB with the timing of thein situ LT (compare with Supplementary Figure S1), so that by the end of the experiment the maximum PAB was reached at a time nearly coinciding with the timing of thein situ HT (03:00 vs. 04:20, Day 6, Figure 4C).8PSIIinst was 0.648 ± 0.008 for Day 1 and 0.671 ± 0.009 for the following days (Supplementary Table S2).
Vertical Migration Pattern of MPB as a
Function of Light Intensity and Light
Spectrum
We furthermore tested the effect of light intensities and wavelengths on the PAB at surface of sediment at all seasons,
through experiments with the same light conditions performed at different seasons, thus taking into account seasonal changes in MPB abundance (Figure 3C). Results are compiled in Figure 5, Supplementary Figure S7, and Supplementary Table S3. In order to compare all light conditions, data were normalized on the control light conditions, which were systematically performed before each light treatment (i.e., the first 24-h MPB migration under 24-h natural photoperiod as in Figure 2A). Note that (i) we worked at equivalent PAR (“photosynthetically active radiation”); for technical reasons, we could not work at equivalent PUR (“photosynthetically usable radiation”); (ii) due to technical limitation of our LED panels, we could not use the same PAR for all wavelengths; in particular, monochromatic wavelengths did not reach the highest “white” light PAR (350µmol photons m−2 s−1); (iii) the statistical analysis was significant only
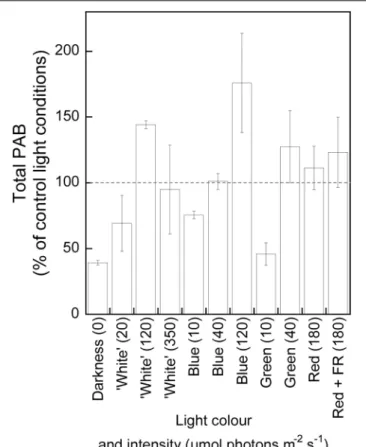
when considering total PAB (one-way ANOVAs, p ≤ 0.05, Supplementary Table S3) rather than maximum PAB (one-way ANOVAs, p> 0.05, Supplementary Table S3). Based on Tukeypost hoc test, we could draw the following observations. Among all light treatments: (i) a significantly lower total PAB was observed in sustained darkness [39% ± 2% of the control (p ≤ 0.05) compared to 120µmol photon m−2s−1white light
and BL and to 40 µmol photons m−2
s−1
green light; see Figure 4A and Supplementary Table S3]; (ii) the significantly (p ≤ 0.05) highest total PAB values were reached for lights of 120 µmol photons m−2 s−1 (“white” and blue, 144% ± 3%
and 176% ± 38% of the control, respectively). Yet, lower or higher irradiances generated no significant changes or a significant decrease in total PAB independent of the wavelength (Supplementary Table S3). 8PSIIinst was high under all light conditions: 0.642 ± 0.047 (Supplementary Table S2).
More precisely (Figure 5 and Supplementary Table S3), under “white” light, total PAB significantly increased with irradiance (from 20 to 120 µmol photons m−2
s−1
) and decreased thereafter (from 120 to 350µmol photons m−2s−1),
so that total PABs under 20 and 350 µmol photons m−2 s−1
were not significantly different. Under BL (465 nm), total PAB significantly increased with intensity (from 10 to 120 µmol photons m−2
s−1
); noteworthy is the effect of an irradiance as low as 10 µmol photons m−2
s−1
of BL, which generated a total PAB as high as 75% ± 2.77% of the control. Green light (530 nm) did not trigger a response significantly different from the control light conditions (40µmol photons m−2 s−1)
and darkness (10µmol photons m−2
s−1
). Unfortunately, with our setup, we could not test higher green light intensities. The maximum intensity of red light (677 nm, with and without far red 748 nm, 180µmol photons m−2s−1) did not trigger a total
PAB significantly different from the control light.
Effect of BL on the MPB Pigment
Content, Photosynthetic Performance,
and Diatom Species Composition During
Vertical Migration
Because we observed a specific BL positive effect, we analyzed potential changes in (i) the pigment content, (ii) the photosynthetic performance, and (iii) the species composition
FIGURE 4 | Microphytobenthos abundance (µg Chl a cm−2) at the surface of muddy sediment, and in situ water level (m) at the site of sampling as function of
universal time (h UT), and monitored under different light regimes: (A) control light conditions for the first natural night/day period (“Night” and “Day” backgrounds) followed by artificial darkness (D) for the second night/day period; (B) control light conditions for the first natural night/day period followed by continuous artificial “white” light (L, 120µmol photons m−2s−1) for the second night/day period, (C) artificial “white” light (L) followed by artificial darkness (D) for the first night/day
period (Day 1), followed by artificially inverted night/day period (starting Day 2) for the four following days (Days 3–6). Low tide and HT, low tide and HT in situ timings, respectively, as in Figure 2. Black line: MPB abundance (µg Chl a cm−2); blue line: water level (m) at the site of sampling; dark gray and light gray backgrounds: the
night and day periods, respectively; arrows indicate the timings for which the sediment was stirred with fresh seawater. Microphytobenthos abundance was derived from Chl a fluorescence (Ftlevel) as measured with an Imaging-PAM and HPLC analysis of Chl a sediment content (Supplementary Figure S2); values are the
mean ± SD of 5 Imaging-PAM “areas of interest” on the sediment tray. Water-level data were retrieved from the Service Hydrographique et Océanographique de la Marine (SHOM, France) database. See the Section “Materials and Methods” for further details.
of MPB during its migration [at thein situ LT timing, 3 h before (BLT) and after (ALT)] under BL exposure of different intensities (10, 40, and 120 µmol photons m−2
s−1
) and for winter and summer sediments, when total PAB was the highest and the lowest, respectively (Figure 3C).
Pigment Content and Photosynthetic Performance
Pigments were analyzed at three depths (0–200, 200–400, and 400–600µm; Supplementary Table S4) and expressed relative to
Chla in order to normalize for pigment changes due to changes in MPB abundance with seasons and/or tidal cycle (Figure 3); 600 ± 100 µm is usually the depth of the photic zone in fine sediments, and 200–250 µm is where photoprotection is the highest (Cartaxana et al., 2011). We found significant differences in winter versus summer sediments exposed to light control conditions and for most sampling times (LT, BLT, and ALT), as well as some significant differences under BL versus control light conditions (detailed description, Supplementary Table S4).
FIGURE 5 | Microphytobenthos total photosynthetically active biomass (PAB in% of the control light conditions) at the surface of muddy sediment and under different light exposures of 24 h. Values are the mean ± SD of n measurements for each light condition. The light conditions were as follows: darkness (0µmol photons m−2s−1, n = 2), “white” light (emission maxima at
459 and 553 nm, 20µmol photons m−2s−1, n = 2; 120µmol photons m−2
s−1, n = 2; 350µmol photons m−2s−1, n = 2), blue light (465 nm, 10µmol
photons m−2s−1, n = 2; 40µmol photons m−2s−1, n = 5; 120µmol
photons m−2s−1, n = 5), green light (530 nm, 10µmol photons m−2s−1,
n = 2; 40µmol photons m−2s−1, n = 4), red light (180µmol photons m−2
s−1, 677 nm; without far-red-FR, 748 nm, n = 3 and with FR, n = 2). Control
light condition (24-h natural photoperiod) values were set to 100% (performed before each light treatment). See Supplementary Figure S4 for the full emission spectrum of each LED color and Supplementary Figure S7 for MPB maximum PAB data.
However, we observed no changes in MPB pigment content, and especially in BL absorbing carotenoids, to relate with the BL positive effect on vertical MPB migration described above (see section “Vertical Migration Pattern of MPB as a Function of Light Intensity and Light Spectrum”).
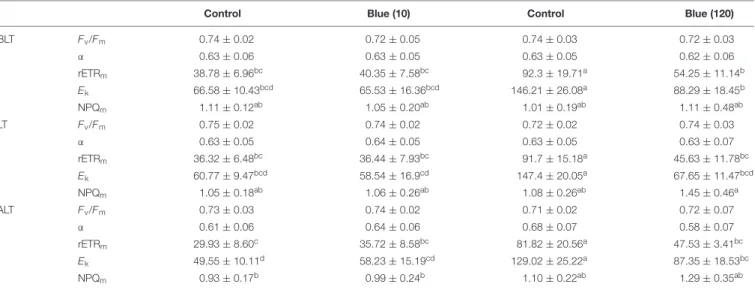
Because most of the significant differences in pigment content were observed for sediment sampled in summer (Supplementary Table S4), we analyzed MPB photosynthetic performances in summer only and for the BL lowest and highest intensities (10 and 120 µmol photons m−2 s−1) (Table 1). F
v/Fm (which is
equivalent to8PSIIinst after dark acclimation of MPB) was high and stable for all BL treatments and their respective controls (two-way ANOVA, p > 0.05 for all factors, Table 1). Because they could not be monitored during a restricted timeframe (i.e.,
two consecutive weeks), the two controls significantly differed in rETRm and Ek, both parameters of the control for BL-10
(sampling end of May) being lower than the control for BL-120 (sampling end of July) (two-way ANOVA,p ≤ 0.001 for the light effect, different groups with the Tukey test, Table 1). While exposure to BL-10 µmol did not yield any significant changes in photosynthetic performance (similar group with Tukey test; Table 1), BL-120 generated a significant decrease in rETRmand
Ekfor all in situ tide timings (different group with Tukey test;
Table 1) but no significant changes in α (two-way ANOVA, p > 0.05 for all factors). There was also a tendency for higher NPQmvalues under BL-120 LT versus control conditions
(two-way ANOVA,p ≤ 0.05 for the light effect).
Diatom Species Composition
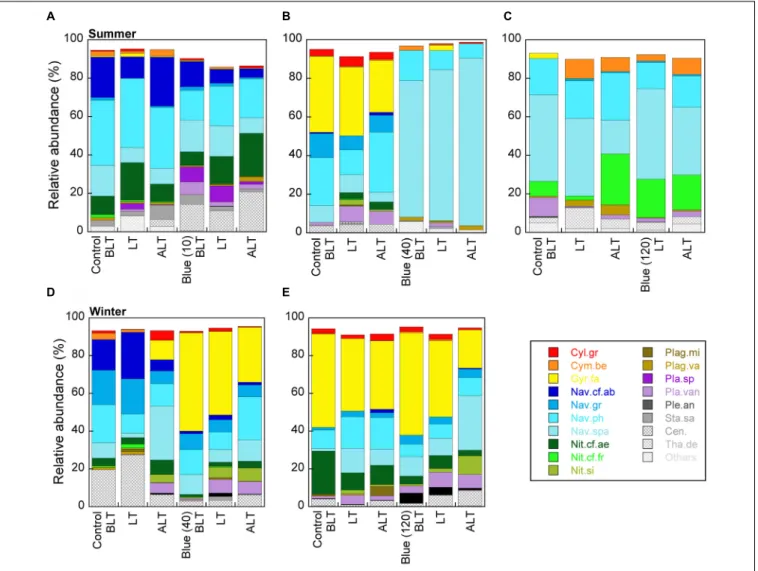
The MPB species composition was analyzed in the 0- to 250-µm sediment layer. Forty-nine species were identified including a large majority of pennate diatoms and of epipelic representatives (Supplementary Table S5). Because only two species,Navicula phyllepta and Navicula spartinetensis, were present in all samples, we first proceeded with an Hcluster analysis showing that most of the species (left cluster, Supplementary Figure S8A) have a very low abundance. In a second step (Supplementary Figure S8B), we proceeded with the 19 species that were present at least once>5% of the total MPB relative abundance. This way, two species, N. spartinetensis and G. fasciola, were highlighted. The species relative abundance of all experiments (Figure 6) showed that (i) only the exposure to BL-40 generated major changes (Figures 6B,D), and (ii) these changes concerned N. spartinetensis in summer (Figure 6B, pale blue) and G. fasciola in winter (Figure 6D, yellow). In order to discard a potential effect of changes in the relative abundance of other motile species onN. spartinetensis and G. fasciola (i.e., for instance their relative abundance would be artificially increased by a decrease in the relative abundance of other motile species), we normalized the relative abundance of the 12 motile species (among the selected 19) encountered in the light conditions of interest (summer and winter, BL-40) to the relative abundance of non-motile species as a common and stable basis: if the abundance of a given species would increase relative to non-motile species, we would assume an upward migration andvice versa. This analysis (Supplementary Figure S9) confirmed that N. spartinetensis andG. fasciola were indeed the two species whose abundances increased relative to the pool of non-motile species under BL and that the response ofN. spartinetensis was particularly strong.
More precisely, for both species, BL induced an increase in abundance at the surface of sediment, all along the LT period (Supplementary Figure S10). Gyrosigma fasciola was massively present at the surface of sediment (50% of the total abundance of 19 most present species) already by the beginning of LT (BLT) while appearing only by the end of the LT (ALT) under control light conditions (Supplementary Figure S10B). Noteworthy were the observations highlighting a respective specific effect of a certain BL dose in the two species: (i) while N. spartinetensis abundance continuously increased to reach a maximum of approximately 85% relative abundance at ALT timing,G. fasciola abundance decreased by approximately
TABLE 1 | Photosynthetic parameters of microphytobenthos (MPB) exposed to blue (465 nm) light conditions (the blue 10 and 120µmol photon m−2s−1intensities
between brackets) and their respective control light conditions: because the two blue light exposures could not be performed simultaneously, it was necessary to perform measurements under control light conditions independently for each of them.
Control Blue (10) Control Blue (120)
BLT Fv/Fm 0.74 ± 0.02 0.72 ± 0.05 0.74 ± 0.03 0.72 ± 0.03 α 0.63 ± 0.06 0.63 ± 0.05 0.63 ± 0.05 0.62 ± 0.06 rETRm 38.78 ± 6.96bc 40.35 ± 7.58bc 92.3 ± 19.71a 54.25 ± 11.14b Ek 66.58 ± 10.43bcd 65.53 ± 16.36bcd 146.21 ± 26.08a 88.29 ± 18.45b NPQm 1.11 ± 0.12ab 1.05 ± 0.20ab 1.01 ± 0.19ab 1.11 ± 0.48ab LT Fv/Fm 0.75 ± 0.02 0.74 ± 0.02 0.72 ± 0.02 0.74 ± 0.03 α 0.63 ± 0.05 0.64 ± 0.05 0.63 ± 0.05 0.63 ± 0.07 rETRm 36.32 ± 6.48bc 36.44 ± 7.93bc 91.7 ± 15.18a 45.63 ± 11.78bc Ek 60.77 ± 9.47bcd 58.54 ± 16.9cd 147.4 ± 20.05a 67.65 ± 11.47bcd NPQm 1.05 ± 0.18ab 1.06 ± 0.26ab 1.08 ± 0.26ab 1.45 ± 0.46a ALT Fv/Fm 0.73 ± 0.03 0.74 ± 0.02 0.71 ± 0.02 0.72 ± 0.07 α 0.61 ± 0.06 0.64 ± 0.06 0.68 ± 0.07 0.58 ± 0.07 rETRm 29.93 ± 8.60c 35.72 ± 8.58bc 81.82 ± 20.56a 47.53 ± 3.41bc Ek 49.55 ± 10.11d 58.23 ± 15.19cd 129.02 ± 25.22a 87.35 ± 18.53bc NPQm 0.93 ± 0.17b 0.99 ± 0.24b 1.10 ± 0.22ab 1.29 ± 0.35ab
Two-way analysis of variance were performed to test the effect of light conditions and of the tide sampling timing. Post hoc Tukey test was further performed to group values. For each photosynthetic parameter, values with the same letter are not significantly different. Fv/Fm, maximum quantum yield of PSII photochemistry (no units);
α, maximum light efficiency use (relative units); rETRm, maximum relative photosynthetic electron transport rate (µmol electrons m−2s−1); Ek, light saturation coefficient
(µmol photons m−2s−1); NPQ
m, maximum NPQ (no units); BLT, 3 h before low tide; LT, low tide timing at the site of sampling (i.e., corresponding to the lowest water
level); ALT, 3 h after low tide. Values are the mean ± SD of 3 measurements.
20%; (ii) for N. spartinetensis, a BL-10 and BL-120 did not induce changes in abundance relative to control light conditions (Figures 6A,C); the same was true for G. fasciola response to BL-120 (BL-10 was not tested). Finally, and to a much lower extent, otherNavicula species (especially Navicula phyllepta and Navicula gregaria) might show a positive response to BL (Figure 6 and Supplementary Figure S9).
DISCUSSION
Monitoring of the Changes in the MPB
PAB at the Surface of Sediment by
Imaging-PAM Fluorimetry
The use of coupled Chla fluorescence with imaging techniques has proven to be of paramount interest to monitor the temporal changes in MPB biomass, in particular with an Imaging-PAM fluorometer (Du et al., 2010; Vieira et al., 2013; Blommaert et al., 2018). Imaging of Chla fluorescence allows assessment of the dynamics of the “photosynthetically active (or productive) biomass” (PAB) at the surface of sediment (Herlory et al., 2005;
Guarini et al., 2008). In the present study, we have used Imaging-PAM fluorimetry to assess changes in PAB in a continuous mode with measurements every 900 s over several days with less than 15-min stop for watering and mixing the sediment tray every 24 h. The main advantage of imaging-fluorimetry compared to other fluorimeters (for instance, the Water-PAM fiber version or the Diving-PAM) is its non-invasive feature; there is no contact with the sediment surface (Vieira et al., 2013). This way, (i) MPB biofilm structure is not disturbed, (ii) its light microenvironment is less biased, and (iii) changes in MPB abundance can be followed
simultaneously with regular measurement of photosynthetic performances (for instance, here,8PSIIinst) taking into account potential limitations (Vieira et al., 2013). More precisely here, we have monitoredFt, the “instantaneous” Chla fluorescence yield
as measured with the detecting beam of the Imaging-PAM. The interest in usingFtinstead of the well-known MPB biomass proxy
F0(Consalvey et al., 2005) was to avoid darkening of the MPB,
which is known to induce counteracting downward migration, and would have therefore disrupted rhythmic dynamics in MPB migration. Stock et al. (2019) also noticed that F0 could be
successfully replaced byFt under some experimental conditions
[see alsoNi Longphuirt et al. (2006)]. We verified thatFtwas well
correlated to the Chla content of sediment surface (R2= 0.84), a correlation as strong as the ones previously reported between Ft (Ni Longphuirt et al., 2006) or F0 (Honeywill et al., 2002; Serôdio et al., 2006) and Chl a. Although the detecting beam was used with minimal irradiance settings, to be as close as possible to non-actinic conditions, still 0.81 ± 0.08µmol photons m−2 s−1 were generated at the surface of sediment trays. It
appeared, a posteriori, that this intensity of blue wavelength (470 nm) was sufficiently effective in triggering positive, albeit limited, upward migration of MPB (see section “Influence of the Light Spectrum on the Amount of PAB Present at the Surface of Sediment: Specific Effect of BL Wavelengths”). This effect was most obvious with the 5.1% ± 4.0% total PAB at night (as compared to control light conditions), which is not expected to occur (see section “What Influences the Most the Amount of PAB Present at the Surface of Sediment: Tides or Light?”). This is nevertheless consistent with earlier findings reporting an effect of irradiances as low as 0.5 to 1µmol photons m−2s−1in triggering
the directional motility of epipelic diatoms (Paterson, 1986;Cohn and Weitzell, 1996;Wenderoth and Rhiel, 2004). There would be
FIGURE 6 | Cumulative relative abundance of the 19 diatom species found at least once>5% of the total relative MPB abundance in the upper layer (0–250 µm) of muddy sediment for the three timings of the in situ low tide at the sampling site (BLT-3 h before low tide, LT-low tide timing, ALT-3 h after low tide) and for two seasons and different light conditions: (A–C) summer blue (465 nm) light treatment with three increasing light intensities: (A) 10, (B) 40, and (C) 120µmol photons m−2s−1with their respective control (24-h natural photoperiod) light conditions; (D,E) winter blue light treatment with two light intensities: (D) 40 and (E) 120µmol
photons m−2s−1with their respective control light conditions. The full list of species with their full names is found in Supplementary Table S5. A zoom of winter and
summer 40µmol photons m−2s−1blue light treatments with focus on Navicula spartinetensis and Gyrosigma fasciola is shown in Supplementary Figure S10.
two ways of avoiding this drawback: (1) instead of measuringFt,
to use the red and near-infrared LEDs of the Imaging-PAM LED panel to measure an NDVI index shown to be well correlated with Chla sediment content (Blommaert et al., 2018); (2) to replace the blue Imaging-PAM measuring head by the red (650–660 nm) one for measuringFt, which most likely (see section “Influence of
the Light Spectrum on the Amount of PAB Present at the Surface of Sediment: Specific Effect of BL Wavelengths”) will not trigger MPB migration at night.
These minor technical limitations being considered, our experimental setup allowed us to reliably monitor MPB migration dynamicsex situ. The patterns we observed in muddy sediment dominated by epipelic diatoms at different times of the day and as a function of LT timings (i.e., at solar noon or close to sunset and/or sunrise, see section “Vertical Migration Pattern of MPB as a Function of Sediment Type, LT Timing, and
Seasons”) were well in accordance with those accurately described decades ago bothin situ and in the laboratory (Consalvey et al., 2004). Of primary importance here was the checking of several prerequisites for further experimental manipulation. As others before (Consalvey et al., 2004), (i) we could observe a migratory rhythm of natural MPB assemblages in laboratory-controlled conditions and without any artificially recreated tidal rhythm (i.e., alternation of emersion/immersion); (ii) this migratory rhythm was precisely related to the in situ LT timings (i.e., corresponding to the lowest water level at the sampling site) and to the day length (photoperiod); (iii) migratory rhythm was maintained for 5 ± 1 consecutive days with only sea-watering and sediment mixing every 24 h at the exact timing of in situ HT; (iv) migratory rhythm was maintained whatever the season at which the sediment was sampled (albeit the amplitude was different, see below); (v) the photosynthetic potential of MBP
(8PSIIinst) was preserved. In fact, our conditioning of sediment was good enough, and our experimental setup sensitive enough so that we could record the MPB activity even in sandy sediment dominated by epipsammic diatoms. Epipsammic species are generally immotile except for representatives that are capable of micromovements within the sphere of the sediment particle to which they are attached, or from a particle to another (Harper, 1969;Round, 1979). Here, when compared to muddy sediment, we could observe (i) a stronger night basal Chla fluorescence signal probably due to the deeper penetration of the Imaging-PAM detecting beam in the coarser sediment, and (ii) a slower, weaker but sustained increase in MPB abundance at the surface of sediment around daytime solar noonin situ LT timing that we interpret as the motile epipsammic and/or the small proportion of epipelic diatoms moving toward the light source (Harper, 1969;Cartaxana et al., 2011), and thus increasing the fluorescence signal. By compiling all of our MPB migration profiles, we could draw a general scheme of surface PAB changes as a function of tidal amplitude, LT timing, and seasons, at our study site. Because the later was upper-shore (i.e., 500 m from the shore, approximately 4 m above the marine chart datum), MPB was often emerged, even for low tidal amplitude. This situation likely explains why we did not observe any clear correlation in PAB changes with the in situ tidal amplitude and LT timing (see also Brotas et al., 1995; Jesus et al., 2009; Coelho et al., 2011). However, surface PAB was strongly related to the sampling season with the highest values observed by the end of winter–beginning of spring. This general seasonal pattern strikingly matches the one recorded through the analysis of a 15-year satellite remote sensing time-series over the Brouage mudflat located just south of our sampling site (Méléder et al., unpublished). This result is of crucial importance for future up-scaling approaches for the estimation of intertidal mudflat primary production (Daggers et al., 2018), the present experimental setup providing a reliable intermediary step between in situ measurements and satellite images.
What Influences the Most the Amount of
PAB Present at the Surface of Sediment:
Tides or Light?
It is generally accepted that the rhythmic MPB vertical migration in intertidal sediment and the surface PAB accumulation are governed by the tidal and diurnal cycles together (Consalvey et al., 2004; Coelho et al., 2011). There are nevertheless situations where tides have a more limited influence and/or light a stronger influence; in such conditions, MPB migration strongly matches with diurnal photoperiodic and irradiance (see below) changes (see, for instance, Mitbavkar and Anil, 2004; Ni Longphuirt et al., 2006). It highlights the possibility to disentangle the tight link between the tidal and diurnal rhythmicity of MPB migration. We thus manipulated the 24-h natural p24-hotoperiod of MPB in order to try desync24-hronizing MPB migration pattern from the tidal and/or diurnal cycles. Differently from previous works (Kwon et al., 2012;Haro et al., 2019), we did not submerse the sediment in order to avoid potentially exacerbated photoperiodic response as in subtidal
sediments (Ni Longphuirt et al., 2006). Our experiments have shown that (i) MPB migration can persist for 5 ± 1 days ex situ following in situ tidal cycle and photoperiod even when permanently maintained emerged (although homogenized with seawater every 24 h); (ii) in neap tide situation (i.e., LT timings close to sunset and sunrise), MPB migration occurs irrespective of the photoperiod and is primarily modeled onto the tidal cycle; (iii) under 24-h darkness or light exposure, MPB migration goes on matching the LT timing of the subjective day or night; (iii) within few days, it is possible to completely desynchronize MPB migration from the tidal cycle to force it matching photoperiod such as in in situ subtidal sediments (Ni Longphuirt et al., 2006) or intertidal sediments immerged ex situ (Paterson, 1986; Haro et al., 2019). These observations confirm and complete previous ones [see the synthesis by Consalvey et al. (2004), as well as more recent works where MPB migration was experimentally manipulated ex situ (Coelho et al., 2011; Kwon et al., 2012;
Haro et al., 2019)]. Also important are the many in situ observations that (seeHappey-Wood and Jones, 1988;Consalvey et al., 2004; Coelho et al., 2011) (i) MPB at the surface of sediment appears to “anticipate” the incoming tide by migrating downward, although this behavior is not systematic; (ii) MPB migrates downward even during emersion at dusk or when darkened.
Taken all together, these features support the endogenous nature of intertidal MPB migration rhythmicity, which is first modeled onto the tidal cycle [so-called “lunidian clock” phased on the lunar day length and cycle (Palmer, 2000)], which can be modulated (i.e., entrained and/or reset; Haro et al., 2019), potentiated, and even overridden, by the diurnal cycle, also potentially controlled by an endogenous circadian clock, in some situations. Quantification of the “potentiating” effect of non-stressful light can be attempted using PAB values under prolonged darkness and continuous light exposures: respectively, 39% ± 2% and 144% ± 3% of control light conditions, strikingly similar to previous reports (approximately 40% in darkness and approximately 130–155% at optimal irradiance) (Sauer et al., 2002; Coelho et al., 2011). These values would mean that light can potentiate the tidal effect on surface PAB accumulation by a factor of 1.6 under 24-h natural photoperiod conditions to more than 2.5 in optimal laboratory conditions (see also Coelho et al., 2011). It was proposed before that endogenous clock(s) would control cell gravitaxy to match the tidal cycle and cell phototaxy to match the diurnal cycle (see Mitbavkar and Anil, 2004; Coelho et al., 2011; Frankenbach et al., 2014). Saburova and Polikarpov (2003) additionally proposed that the central biological driver of rhythmic MPB migration is the cell division cycle and its spatial disconnection from photosynthesis; that is, the cell cycle occurs in the stable and nutrient-rich deep sediment layers during immersion/at night, and it needs the photochemical energy and organic carbon that is generated and stored at the surface of sediment during daytime emersion (Underwood et al., 2005; Marques Da Silva et al., 2017). This temporal (light vs. dark periods) metabolic decoupling in diatoms has been further demonstrated (Skogen Chauton et al., 2013). The
endogenously controlled rhythmic MPB migration, modeled onto intertidal flat environmental conditions, would allow MPB to perform surface and depth biological processes in the most optimal conditions. Although endogenous circadian clocks, their components and regulation, have been well detailed in several algal lineages, they remain uncharacterized in diatoms (Noordally and Millar, 2015), with the exception of the recent discovery of a time-keeping molecular component, which controls the diel rhythmic expression of many genes (Annunziataa et al., 2019).
Both lunar and solar day major drivers can be in turn modulated by other environmental stimuli (temperature, nutrients, salinity, pH, etc.; see Consalvey et al., 2004), and by other light features: light spectrum (see section “Influence of the Light Spectrum on the Amount of PAB Present at the Surface of Sediment: Specific Effect of BL Wavelengths”) and irradiance. Indeed, during emersion, the light availability at the surface and in sediment is also defined by the course of the sun during the daytime period, by open-field–like incident irradiance fluctuations and by the sediment-dependent light penetration, which varies with several features [particle size, content in pore water, etc. (Kuhl and Jorgensen, 1994)]. Many studies have reported how the level of irradiance controls epipelic diatom phototaxis in a biphasic way. While up to a certain irradiance threshold light promotes upward migration and the formation of the MPB biofilm, beyond this threshold it conversely induces downward migration and decreases surface PAB (see, for instance,Serôdio et al., 2006;Laviale et al., 2016). It is believed that motility along the sediment light gradient allows MPB both to optimize photosynthesis and to avoid stressful light conditions (i.e., above the photosynthetic capacity of cells). In the present study, the phototactic behavior of epipelic MPB was well illustrated by the PAB present at the surface of sediment as a function of “white” light irradiance with a maximum reached for 120 µmol photons m−2 s−1.
Similar values (i.e., range 100–250 µmol photons m−2 s−1)
were also reported in previous studies on both MPB natural communities (Perkins et al., 2002; Serôdio et al., 2006;Laviale et al., 2016;Du et al., 2018) and isolated epipelic diatom species (McLachlan et al., 2009; Du et al., 2010; Ezequiel et al., 2015). This feature was essential for two reasons: (i) it allowed us to validate the relevance of our experimental setup, and especially its ability to well preserve MPB light response in the sediment, and (ii) it allowed us to draw reference light conditions for maximizing the surface PAB, two necessary conditions for further testing together the effect of light intensity and spectrum on MPB migration.
Influence of the Light Spectrum on the
Amount of PAB Present at the Surface of
Sediment: Specific Effect of BL
Wavelengths
In the present study, surface PAB accumulation was positively influenced by blue (465 nm) and possibly by green (530 nm) wavelengths, but not by red ones (677 nm, with or without far red). Although green light generated a similar PAB
accumulation than BL for the same intensity (40 µmol photons m−2
s−1
), our experimental setup did not allow to test higher green light intensities to unambiguously conclude the responses to green light. It was previously demonstrated that green light (>510–520 nm) generally has a lower effect than BL (450 ± 20 nm) on phototactic directional cell movements (Nultsch, 1971; Cohn et al., 2004, 2015, 2016). Differently, red light of low or moderate intensity usually has no/little effect or negative effect on directional motility of diatoms and their accumulation, although this response is species-specific (Cohn and Weitzell, 1996; McLachlan et al., 2009; Cohn et al., 2015). These reports partially explain the action spectrum of MPB abundance at the surface of sediment at low irradiance (5 µmol photons m−2 s−1) showing a strong positive
effect of blue wavelengths (440 ± 10 nm), limited effect of greens (500–550 nm), and a moderate effect of red (680 nm) (Wenderoth and Rhiel, 2004).
Here, as regards to the specific effect of blue wavelengths, we have found that (i) BL induced a ×1.8 ± 0.4 total PAB increase compared to the “white” light control at the same intensity of 120µmol photons m−2 s−1; (ii) PAB accumulation
was irradiance-dependent with a positive effect from 10 to 120 µmol BL photons m−2 s−1; (iii) PAB accumulation was
species-specific with two taxa, namely, N. spartinetensis and G. fasciola (and probably other Navicula species to a lesser extent), which strongly reacted (i.e., from 0 to 10% relative presence at the surface of sediment to up to more than 80%) at 40 µmol BL photons m−2
s−1
; (iv) their surface accumulation was independent of the season: the BL effect was observed with both winter and summer sediments for a particular species. These features fit well with previous reports. In general, blue wavelengths have a positive effect (up to a certain irradiance threshold, see Cohn et al., 2004; McLachlan et al., 2009) on surface PAB (×1.4 to ×1.8, Wenderoth and Rhiel, 2004) by modulating the speed to which epipelic diatoms move directionally (Nultsch, 1971;Cohn and Weitzell, 1996; McLachlan et al., 2009; Cohn et al., 2015). This BL photosensitivity is species-specific (McLachlan et al., 2009;Cohn et al., 2015), and it is detected at least at the tips of pennate cells (Cohn et al., 1999). The way blue wavelengths act at the cellular level and how the “BL signal” might be transduced is still unclear in diatoms, although significant recent advances have been made (Jaubert et al., 2017). It was early proposed (Nultsch, 1971) that pigments, chlorophylls and carotenoids, should act as primary harvesters and transducers to trigger the previously described action spectrum of MPB motility, and especially photokinesis (i.e., change of motility speed;Wenderoth and Rhiel, 2004). The latter would directly depend on the energy provided by photosynthesis, which itself is driven by actinic wavelengths, and obviously BL. In that respect, the optical properties of the photonic crystal-like structures of the diatom frustule are highly relevant; they have been shown to shape the availability of light and of specific wavelengths inside the cell, thereby potentiating pigment light-harvesting and photosynthetic efficiency (Goessling et al., 2018a,b). Interestingly, the frustule of one of our most BL-reactive species,G. fasciola,