HAL Id: hal-02291896
https://hal.archives-ouvertes.fr/hal-02291896
Submitted on 19 Sep 2019
HAL is a multi-disciplinary open access
archive for the deposit and dissemination of
sci-entific research documents, whether they are
pub-lished or not. The documents may come from
teaching and research institutions in France or
abroad, or from public or private research centers.
L’archive ouverte pluridisciplinaire HAL, est
destinée au dépôt et à la diffusion de documents
scientifiques de niveau recherche, publiés ou non,
émanant des établissements d’enseignement et de
recherche français ou étrangers, des laboratoires
publics ou privés.
EEG-BASED DECODING OF AUDITORY
ATTENTION TO A TARGET INSTRUMENT IN
POLYPHONIC MUSIC
Giorgia Cantisani, Slim Essid, Gael Richard
To cite this version:
Giorgia Cantisani, Slim Essid, Gael Richard. EEG-BASED DECODING OF AUDITORY
ATTEN-TION TO A TARGET INSTRUMENT IN POLYPHONIC MUSIC. 2019 IEEE Workshop on
Appli-cations of Signal Processing to Audio and Acoustics (WASPAA), Oct 2019, New Paltz, NY, United
States. �hal-02291896�
EEG-BASED DECODING OF AUDITORY ATTENTION TO A TARGET INSTRUMENT IN
POLYPHONIC MUSIC
Giorgia Cantisani,
1∗Slim Essid,
1Ga¨el Richard,
11
LTCI, T´el´ecom Paris, Institut Polytechnique de Paris, 75013, Paris, France
[email protected]
ABSTRACT
Auditory attention decoding aims at determining which sound source a subject is “focusing on”. In this work, we address the problem of EEG-based decoding of auditory attention to a target instrument in realistic polyphonic music. To this end, we exploit a stimulus reconstruction model which was proven to decode suc-cessfully the attention to speech in multi-speaker environments. To our knowledge, this model was never applied to musical stimuli for decoding attention. The task we consider here is quite com-plex as the stimuli used are polyphonic, including duets and trios, and are reproduced using loudspeakers instead of headphones. We consider the decoding of three different audio representations and investigate the influence on the decoding performance of multiple variants of musical stimuli, such as the number and type of instru-ments in the mixture, the spatial rendering, the music genre and the melody/rhythmical pattern that is played. We obtain promising results, comparable to those obtained on speech data in previous works, and confirm that it is possible to correlate the human brain activity with musically relevant features of the attended source.
Index Terms— Auditory attention decoding, Polyphonic mu-sic, EEG, Stimulus reconstruction model
1. INTRODUCTION
Auditory attention is the cognitive mechanism that allows human beings to focus on a sound source of interest in every-day life en-vironments. This allows the brain to extract and process high-level sound content effectively and efficiently. The target may be a sound source (a speaker, a siren, a musical instrument) and may carry spa-tial information (sound source localization, environment geometry, etc.). Auditory attention decoding aims at determining, from the brain’s activity, which sound source a subject is “focusing on” while listening to a complex auditory scene.
Previous studies on speech attention decoding based on con-tinuous magnetoencephalographic (MEG) [1–3] and electroen-cephalographic (EEG) signals [4–8] have shown that the neural ac-tivity tracks dynamic changes in the speech stimulus and can be successfully used to decode selective attention in a multispeaker en-vironment. In all these works, a feature representation of the speech stimulus is reconstructed from the multi-channel EEG recordings through a stimulus reconstruction model, which is learned by solv-ing a linear regression problem [8]. The authors of [6] were one of the first to show that such reconstructed feature representations (in this case spectrograms) were highly correlated with the salient
∗This project has received funding from the European Unions Horizon
2020 research and innovation program under the Marie Skodowska-Curie grant agreement No. 765068
time-frequency features of the attended speaker’s voice, and were only weakly correlated with the unattended speaker ones. When the stimulus consists of polyphonic music, one can recast this problem as that of decoding the attention to a particular musical instrument. However, this transposition is not straightforward since music rep-resents a complex category of stimuli, entailing a variety of per-ceptual cues, linking to not only musical timbre, but also rhythm, harmony and melody.
A few attempts have thus been made at detecting and extract-ing music information from the brain’s activity while the user is listening to realistic music, but none has addressed the question of attention decoding. Some studies aim at understanding how the brain processes basic structural components of music such as pitch [9–12], timbre [13–15] as well as sensory dissonance, high-level melodic characteristics (e.g. melodic contour, key, mode, scale) and music-syntactic congruity [16]. The most studied com-ponents in the perception of music appear to be note onsets, beats, rhythm and meter [17–20]. Usually, the brain’s reaction to such kind of structural components is studied using the event-related po-tential(ERP) paradigm, repeating the stimulus several times before averaging the corresponding EEG responses, in order to keep only the stimuli-relevant information and attenuate noise. This approach relies on specifically selected or designed short stimuli, which are appropriate to study only specific aspects of music (e.g. note onsets) or the reaction to isolated sounds. A different approach is needed to study the continuous brain response to a long and complex natu-ralistic stimulus such as a musical piece in its entirety. Only a few attempts have been made to track the dynamics of naturalistic mu-sic stimuliin the EEG signal. The authors of [17] found evidence that the time-domain audio envelope is consistently reflected in the EEG. In [21] the Mel spectrogram of both perceived and imagined naturalistic musical stimuli were reconstructed from the EEG while in [22] and [18], the same was done for the note onset sequence. However, these works were directly focusing on stimulus recon-struction and not on attended source decoding. Two attempts have been made for classifying the attended music [23] and the attended instrument [24] but both of them focused on the elicited ERPs.
In this context, we have studied the problem of decoding au-ditory attention to an instrument in realistic polyphonic music, i.e. recorded music, featuring two or three instruments played concur-rently. For this purpose we exploit a stimulus reconstruction model successfully used for decoding attention to speech in multi-speaker environments [4–8], which, to our knowledge, was never previously applied to musical stimuli for attention decoding tasks. More partic-ularly, we consider the challenging case of unaveraged EEG record-ings (where the elicited responses are less visible) using polyphonic stimuli. It is worth noting that these stimuli were not specifically designed to elicit ERPs, and were played to the subjects using loud-speakers instead of headphones. We have investigated how the
de-EEG Recordings TRAIN DECODER FLUTE 20 electrodes x lags FLUTE DECODER
FLUTE SOLO EEG Recordings FLUTE 20 electrodes x lags POLYPHONIC MUSIC ISOLATED SOURCES FLUTE CELLO Pearson's Correlation Analysis RECONSTRUCTED FLUTE channels features time lags FLUTE DECODER channels features time lags CLASS: FLUTE
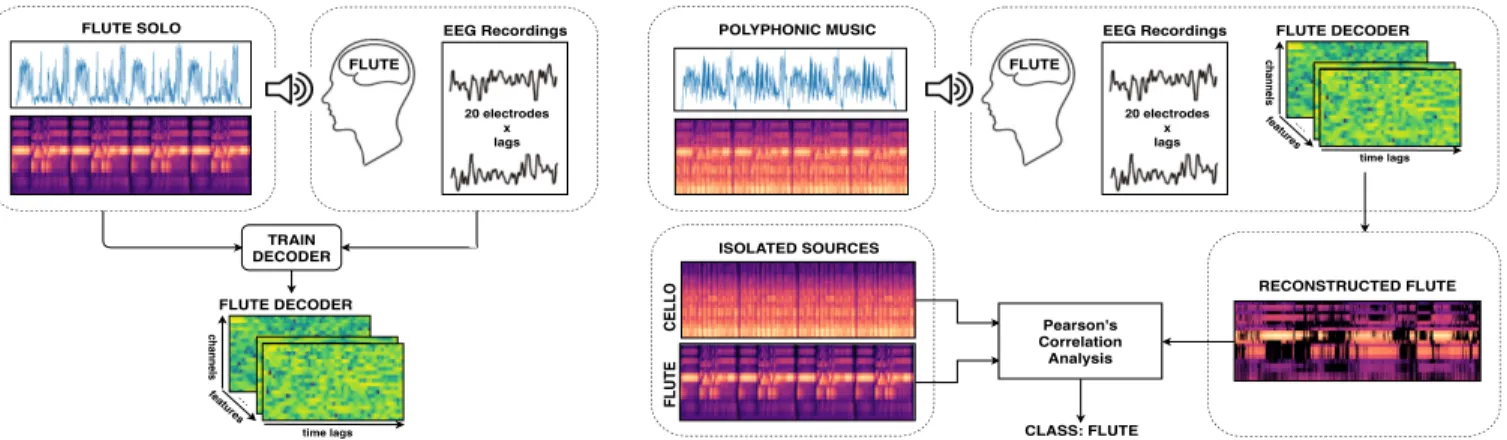
Figure 1: A subject-specific model is learned for each instrument from its solo and the EEG response collected while listening to it. Then, the same model is used to predict a representation of the attended instrument from the EEG response to a mixture containing that instrument. The attended instrument is the one which is mostly correlated with the reconstructed stimulus in terms of Pearson’s correlation coefficient.
coding performance is influenced by the choice of audio represen-tations as well as properties of the musical stimuli, such as num-ber and type of instruments, spatial rendering, music genre, and the melody/rhythmical pattern that is played.
The remainder of the paper is organized as follows. The dataset is briefly discussed in Section 2. The audio stimuli representations, reconstruction and classification procedures are described in Sec-tion 3. Finally, the results are presented in SecSec-tion 4 and future research directions are discussed in Section 5.
2. DATA
Studying the problem at hand requires data of well-synchronized musical stimuli and corresponding EEG responses which can only be acquired in a controlled sensory stimulation. There are a few publicly available music-related EEG datasets acquired in such a way [25–27], but they were designed for a different purpose and the subjects were not asked to attend to any particular instrument. The only one where participants were asked to focus on an instrument while listening to polyphonic music, is the music BCI dataset used in [24]. However, it was specifically designed for studying ERP-based attention decoding. Our focus is instead on single-trial attention decoding techniques, targeting real music compositions.
Consequently, we acquired our own dataset, named MAD-EEG1, consisting of 20-channel surface EEG signals recorded from 8 subjects while they were attending to a particular instrument in polyphonic music, i.e. mixtures containing from two to three in-struments. All subjects were non-professional/beginners musicians with different experience levels. Each subject listened to 78 stim-uli, each one consisting of 4 repetitions of the same 6-second long music excerpt. This corresponds to approximately 30-32 minutes of 20-channel EEG recordings. Each attended instrument was previ-ously heard in solo, as part of a training phase. The training excerpt was either from the same musical piece or another, and was played using either the same spatial rendering or a different one. Music stimuli were presented using two speakers positioned ±45oalong the azimuth direction relative to the listener. The spatial rendering was implemented by using conventional stereo panning. The elec-trodes were placed according to the 10-20 international montage
1http://www.tsi.telecom-paristech.fr/aao/en/
2019/07/19/mad-eeg/
system and were referenced to left mastoid in an unipolar setting. The sampling frequency was 256Hz. The acquired EEG data was synchronized with each stimulus, the 50 Hz power-line interference was removed using a notch filter and EOG/ECG artifacts were de-tected and removed using independent component analysis (ICA).
3. METHODS
The goal is to determine the attended instrument in a single-trial fashion based on 24-second long EEG excerpts aligned to corre-sponding audio stimuli (of the same length). Our approach can be summarized in two steps and is similar to the one commonly used for decoding the attention to speech [4–8]. It is shown in Figure 1. First we reconstruct an audio representation of the attended instru-ment from the single-trial EEG response of the user exploiting a decoder previously trained on solos of that instrument. Second, given the isolated instrumental tracks, the attended instrument is recognized as the one that has the highest correlation with the re-constructed stimulus in terms of Pearson’s correlation coefficient. 3.1. Audio Feature Extraction
Three different audio representations were studied, one in the time domain and two in the time-frequency domain, in order to inves-tigate which audio features are best suited to decoding the atten-tion from the EEG. This choice can actually significantly impact the reconstruction quality and the decoding performance. In partic-ular, we tested the time domain amplitude envelope computed using the Hilbert transform (AE) and the magnitude spectrogram (MAG) which have already shown good performance for speech stimulus-reconstruction tasks [4–8]. A recent work explored auditory spec-trograms modeling the peripheral auditory system [28] as they may better model how the attended source is represented in the EEG. We test instead the Mel spectrogram (MEL), a perceptually-scaled representation commonly used for music analysis.
3.2. Stimulus Reconstruction
The stimulus reconstruction model reconstructs an estimate of the stimulus representation ˆs from multi-channel EEG data r through a model g which behaves like a multi-channel Wiener filter. This filter
can be seen as a spatio-temporal decoder which linearly maps the neural activity back to the music representation, as a weighted sum of activity at each electrode in a given temporal context, as follows:
ˆ s(t, f ) =X n X τ g(τ, f, n)r(t + τ, n) (1)
where ˆs is the predicted music representation at time t and fea-ture f , r is the neural response of electrode n at time (t + τ ) and g is the linear transformation function that depends on the time lag τ , feature f , and electrode n. The time lag τ ranges between 0 and τmax, i.e. the time interval where we assume to see the EEG
response to the stimulus.
Equation (1) can be solved by minimizing the mean squared error between the actual and reconstructed stimulus representation, P
t
P
f[s(t, f ) − ˆs(t, f )] 2
, which requires the calculation of the normalized reverse correlation: G(f ) = C−1RRCRS, where CRR =
RRTis the auto-correlation of the EEG data and C
RS= RSTis the
cross-correlation of the stimulus and EEG data across all electrodes, time-lags for a given feature f . Thus the reconstruction of each fea-ture f of the stimulus representation ˆs(t, f ) is independent from the reconstruction of the other features and is obtained by convolv-ing the relative multivariate impulse response G(f ) with the EEG signal. In the case of magnitude and Mel spectrograms where the features correspond to frequency bins, the underlying assumption is that a spectrogram is a time-varying representation of the amplitude envelope at each frequency bin [5].
Since EEG signals are high-dimensional, autocorrelated, noisy data with high trial-to-trial variability, the estimate of the covari-ance matrices can be imprecise and subject to overfitting due to the high number of parameters to estimate [29]. Thus, a shrink-age regularization is used to constrain the model coefficients by smoothly penalizing extreme eigenvalues [29]: the diagonal of the autocovariance matrix CRR is then weighted as follows: C0RR =
(1 − λ)CRR+ λνI, where I is the identity matrix, ν is the average
eigenvalue trace of CRR, and λ ∈ [0, 1] is the smoothing parameter.
4. EXPERIMENTAL RESULTS
All audio representations were time aligned to the EEG responses acquired at 256Hz. Through a grid search over a set of reason-able values for each parameter (λ ∈ [0.1, 1], τmax ∈ [250, 500]
ms, number of Mel bands ∈ [12, 60]), we found the best value for the shrinkage parameter to be λ = 0.1, for τmaxto be 250ms
post stimulus, and for the number of Mel bands to be 24, using the following train/test splits: for each of the 8 subjects train on 14 solos, test on 40 duets and 24 trios. The results are reported in Table 1 for different subsets of the test set corresponding to vari-ants in the stimuli and different audio descriptors in terms of F1 scores. The considered variants consist of varying the number of instruments in the mixture, the melody that is played, the music genre and spatial rendering. Their statistical significance was as-sessed using an adaptation of the computationally-intensive ran-domization test [30], a non-parametric hypothesis test, comparing to chance, which does not make any assumption on the score distri-bution and can be used also for complex non-linear measures such as F1 score [31]. The considered significance levels are 5%, 1% and 0.1% and the tests were performed over 104iterations. Besides the decoding performance, we also evaluate the reconstruction capa-bilities of our system through the Pearson’s correlation coefficient of the reconstructed stimulus representation with the attended
in-F1 score (%)
all ensemble melody/rhythm rendering genre duets trios same diff mono stereo pop classic AE 51 * 58 * 37 n.s. 48 n.s. 53 * 53 * 48 n.s. 54 * 48 n.s. MAG 72 ** 74 ** 66 ** 76 ** 65 ** 73 ** 72 ** 64 ** 79 ** MEL 73 ** 79 ** 73 ** 79 ** 60 ** 74 ** 71 ** 60 ** 83 **
Table 1: F1 scores for different subsets of the test set: all for all the test mixtures, duets and trios for those containing respectively 2 or 3 instruments, sm and dm for those which exhibit respectively the same or a different melody/rhythmical pattern as the solo used to train the model, mono and stereo for those rendered respectively in mono or stereo.“**” denotes high (p < 0.001), “*” good (p < 0.01), and “n.s.” no (p > 0.05) statistical significance of the results.
AE MAG MEL descriptor 0.0 0.1 0.2 0.3 0.4 0.5 0.6 0.7 r source attended unattended mixture
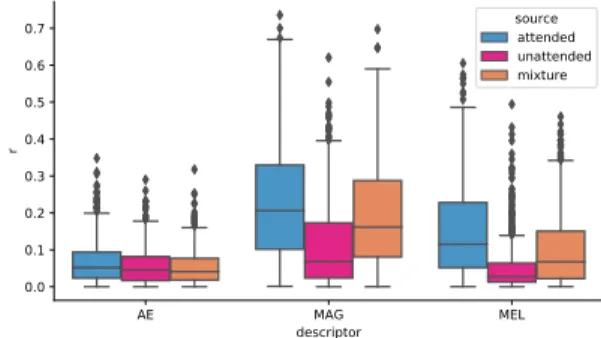
Figure 2: Pearson’s correlation coefficients of the reconstructed stimulus with the attended source (blue), the unattended one (pink) and the mixture (orange) for the three audio descriptors.
strument rattended, the unattended instrument runattendedand the
mixture rmixture.
In all cases except for the amplitude envelope, the F1 scores are statistically above chance (p < 0.001 on a randomization test over 10000 repetitions). In fact, the decoding performance of this feature and its correlation scores are drastically lower than the one found for the two time-frequency descriptors (see Table 1 and Fig-ure 2). Thus, the decoding seems to clearly benefit from the use of a finer audio representation, highlighting amplitude modulations in different frequency bands. Nevertheless, the rattendedare
com-parable to the ones obtained in [7] for speech with the same audio descriptor (median r = 0.054). However, our rattendedvalues are
close to runattendedand this led to a much lower decoding accuracy
than [7]. One reason may be that the music envelopes are signifi-cantly different from the speech ones, as the complexity and mod-ulations of music signals are higher, which makes it difficult to dis-criminate between the envelopes of the attended and the unattended instruments. Here the model is likely to account for effects more related to the whole mixtures than individual instruments, causing rattendedand rmixtureto be really similar. Moreover, we have to
consider that in our case the stimuli were polyphonic and rendered through loudspeakers while in [7] two concurrent speech stimuli were presented as monaural sources using headphones playing a different source to each ear. In general, when both rattendedand
runattended are low and similar, it means that the quality of the
reconstructed stimulus is bad, hence it is difficult to decode the at-tended instrument. Since the performance of the AE are drastically lower, in the remainder of this paper, we will only analyze those of the time-frequency descriptors.
Also in the case of the linear spectrogram, the obtained cor-relations are comparable in terms of magnitude order to the ones
duets trios same diff monostereo pop classic variant 0.0 0.1 0.2 0.3 0.4 0.5 0.6 0.7 r descriptor = MAG
duets trios same diff monostereo pop classic
variant descriptor = MEL
attended unattended
Figure 3: rattendedand runattended scores for the all the
stim-uli variants. Only MAG and MEL descriptors are considered. rattendedand runattended distributions are significantly different
for all the variants (p < 0.001, non-parametric Wilcoxon test).
0.0 0.1 0.2 0.3 0.4 0.5 0.6 0.7 r attended 0.0 0.1 0.2 0.3 0.4 0.5 0.6 0.7 r unattended descriptor = MAG 0.0 0.1 0.2 0.3 0.4 0.5 0.6 0.7 r attended descriptor = MEL Oboe Cello Bass Voice Drums Guitar Horn Bassoon
Figure 4: rattendedis plotted against runattendedfor each duet in
the test set (only MAG and MEL descriptors). Data points below the red line rattended= runattended, are classified correctly. Data
points in the bottom-right corner are classified correctly with a large margin. The instruments are marked with different colors.
obtained previously by [6] for speech in a different setting. Even if MAG correlations with the attended instrument (median r = 0.215) are in general higher than the MEL ones (median r = 0.119), the gap between rattendedand runattendedis higher for MEL as can be
seen in Figure 2, leading to better decoding performances. Also in this case, many misclassifications happen when the reconstructed stimulus quality is low, i.e. when both rattendedand runattended
coefficients are very low (r < 0.2) and close (see Figure 4). Here the model is accounting for effects which are probably more related to the whole mixtures than individual instruments. When rattended
is high, usually the corresponding runattendedis low, meaning that
the model is discriminating the two instruments.
As expected, the number of instruments in the mixtures seems to affect the performances, which are better for duets than trios. This is reasonable, as the more sources we have, the more difficult is the attention decoding task. The spatial rendering, i.e. whether the stimuli are played in a mono or a stereo setting, does not signifi-cantly influence the decoding performance and the correlations val-ues, though surprisingly, mono playback seems to be more advan-tageous than stereo in terms of F1 scores, with the differences not being statistically significant (p > 0.05, non-parametric Wilcoxon test). It seems that the subjects are not helped by a different spatial localization of the instruments to attend to one of them or, at least, the EEG is not linearly tracking any of the related information.
The genre, instead, is highly influencing the performances. Both the time-frequency descriptors behave much better for the
Classical music mixtures compared to Pop ones as can be seen in Table 1. This probably happens because the nature of the Pop ex-cerpts used as stimuli is mostly repetitive musical patterns, which are essentially rhythmical. In our dataset, this is particularly true in mixtures with the Drums and the Bass, which usually have to guide the rhythm and tempo. The Classical mixtures used are inherently different: they exhibit long melodic lines which can be translated in well-defined varying pitch contours. Thus, the very good perfor-mances on the classical pieces can be explained by the fact that our model is tracking well the pitch/harmonic contour of the attended instrument. Usually, when one attends to an instrument one focuses on following the melody line or rhythm played.
That is why we tested if our models are invariant to the melody/rhythmical patternthat is played. In fact, the performance clearly changes when we test the models on different musical pieces from those which were used for training, and is better when the melody/rhythmical pattern remains the same. It is worth clarifying that even in this case, though the same solo excerpt is used during training and testing, during the latter, that solo excerpt is played as part of a mixture (duet or trio) and the EEG response is obvi-ously completely different from that of the training with the solo-only stimulus. This performance degradation observed when the pitch contours varies between training and testing is coherent with the explanation we gave before for the difference of performance among the genres. However, this also means that the generalization ability of the considered models is limited. Even if the models are not invariant to the changing pitch contour, the performance still re-mains significantly better than chance for the two time-frequency representations. In this case, the linear spectrogram seems to be more robust than the Mel one. The lower performance on the Pop excerpts can be explained also by the fact that the Drums are always misclassified as Bass. Our tentative explanation is that when the subject is listening to the Drums and the Bass, the brain’s activity is mostly tracking the rhythm. More experiments using recordings with clearer distinction between melody and rhythm will be needed to confirm these initial findings.
5. CONCLUSION
We have shown that EEG-based auditory attention decoding based on a simple linear regression model yields promising results for decoding the attended instrument in polyphonic music. Through experimental evaluation we have shown that the EEG tracks musically-relevant features which are highly correlated with the time-frequency representation of the attended source and only weakly correlated with the unattended one. Moreover, we have shown that we are actually tracking attention since these features are related with the attended source and not with the mixture in its whole. However, it seems that the models are mostly tracking the pitch contour that is played by the instrument, which reduces its generalization capabilities.
The main limitation is that the proposed paradigm employs the separate “clean” sources of each instrument present in the mixture (to correlate their feature representation to the one predicted with the EEG data). This condition is never met in realistic scenarios where only the mixtures are available. Moreover, our linear model is not tracking all the non-linearity of the EEG signals. Future work will look into testing the proposed approach with non linear models and without access to the clean sources. Moreover, we will extend this approach to a music instrument classification problem, where we assume the target instrument is not known in advance.
6. REFERENCES
[1] N. Ding and J. Z. Simon, “Emergence of neural encoding of auditory objects while listening to competing speakers,” Proceedings of the National Academy of Sciences, vol. 109, no. 29, pp. 11 854–11 859, 2012.
[2] S. Akram, J. Z. Simon, S. A. Shamma, and B. Babadi, “A state-space model for decoding auditory attentional modula-tion from meg in a competing-speaker environment,” in Ad-vances in Neural Information Processing Systems, 2014, pp. 460–468.
[3] C. Brodbeck, A. Presacco, and J. Z. Simon, “Neural source dynamics of brain responses to continuous stimuli: speech processing from acoustics to comprehension,” NeuroImage, vol. 172, pp. 162–174, 2018.
[4] N. Mesgarani, S. V. David, J. B. Fritz, and S. A. Shamma, “Influence of context and behavior on stimulus reconstruction from neural activity in primary auditory cortex,” Journal of neurophysiology, 2009.
[5] B. N. Pasley, S. V. David, N. Mesgarani, A. Flinker, S. A. Shamma, N. E. Crone, R. T. Knight, and E. F. Chang, “Recon-structing speech from human auditory cortex,” PLoS biology, vol. 10, no. 1, p. e1001251, 2012.
[6] N. Mesgarani and E. F. Chang, “Selective cortical represen-tation of attended speaker in multi-talker speech perception,” Nature, vol. 485, no. 7397, p. 233, 2012.
[7] J. A. O’sullivan, A. J. Power, N. Mesgarani, S. Rajaram, J. J. Foxe, B. G. Shinn-Cunningham, M. Slaney, S. A. Shamma, and E. C. Lalor, “Attentional selection in a cocktail party envi-ronment can be decoded from single-trial eeg,” Cerebral Cor-tex, vol. 25, no. 7, pp. 1697–1706, 2014.
[8] M. J. Crosse, G. M. Di Liberto, A. Bednar, and E. C. Lalor, “The multivariate temporal response function (mtrf) toolbox: a matlab toolbox for relating neural signals to continuous stimuli,” Frontiers in human neuroscience, vol. 10, p. 604, 2016.
[9] K. L. Hyde, I. Peretz, and R. J. Zatorre, “Evidence for the role of the right auditory cortex in fine pitch resolution,” Neuropsy-chologia, vol. 46, no. 2, pp. 632–639, 2008.
[10] S. Kumar, W. Sedley, K. V. Nourski, H. Kawasaki, H. Oya, R. D. Patterson, M. A. Howard III, K. J. Friston, and T. D. Griffiths, “Predictive coding and pitch processing in the au-ditory cortex,” Journal of Cognitive Neuroscience, vol. 23, no. 10, pp. 3084–3094, 2011.
[11] Y. Nan and A. D. Friederici, “Differential roles of right tempo-ral cortex and broca’s area in pitch processing: evidence from music and mandarin,” Human brain mapping, vol. 34, no. 9, pp. 2045–2054, 2013.
[12] C. J. Plack, D. Barker, and D. A. Hall, “Pitch coding and pitch processing in the human brain,” Hearing Research, vol. 307, pp. 53–64, 2014.
[13] A. Caclin, M.-H. Giard, B. K. Smith, and S. McAdams, “Inter-active processing of timbre dimensions: A garner interference study,” Brain research, vol. 1138, pp. 159–170, 2007. [14] S. Deike, B. Gaschler-Markefski, A. Brechmann, and H.
Sche-ich, “Auditory stream segregation relying on timbre involves left auditory cortex,” Neuroreport, vol. 15, no. 9, pp. 1511– 1514, 2004.
[15] K. N. Goydke, E. Altenm¨uller, J. M¨oller, and T. F. M¨unte, “Changes in emotional tone and instrumental timbre are re-flected by the mismatch negativity,” Cognitive Brain Re-search, vol. 21, no. 3, pp. 351–359, 2004.
[16] I. Sturm, “Analyzing the perception of natural music with eeg and ecog,” Ph.D. thesis, 2016.
[17] F. Cong, A. H. Phan, Q. Zhao, A. K. Nandi, V. Alluri, P. Toivi-ainen, H. Poikonen, M. HuotilToivi-ainen, A. Cichocki, and T. Ris-taniemi, “Analysis of ongoing eeg elicited by natural music stimuli using nonnegative tensor factorization,” in EUSIPCO. IEEE, 2012, pp. 494–498.
[18] I. Sturm, M. Treder, D. Miklody, H. Purwins, S. D¨ahne, B. Blankertz, and G. Curio, “Extracting the neural represen-tation of tone onsets for separate voices of ensemble music using multivariate eeg analysis.” Psychomusicology: Music, Mind, and Brain, vol. 25, no. 4, p. 366, 2015.
[19] S. Stober, T. Pr¨atzlich, and M. M¨uller, “Brain beats: Tempo extraction from eeg data.” in ISMIR, 2016, pp. 276–282. [20] M. H. Thaut, “Rhythm, human temporality, and brain
func-tion,” Musical communication, pp. 171–191, 2005.
[21] A. Ofner and S. Stober, “Shared generative representation of auditory concepts and eeg to reconstruct perceived and imag-ined music.” in ISMIR, 2018, pp. 392–399.
[22] I. Sturm, S. D¨ahne, B. Blankertz, and G. Curio, “Multi-variate eeg analysis as a novel tool to examine brain responses to natu-ralistic music stimuli,” PloS one, vol. 10, no. 10, p. e0141281, 2015.
[23] R. S. Schaefer, P. Desain, and J. Farquhar, “Shared process-ing of perception and imagery of music in decomposed eeg,” Neuroimage, vol. 70, pp. 317–326, 2013.
[24] M. S. Treder, H. Purwins, D. Miklody, I. Sturm, and B. Blankertz, “Decoding auditory attention to instruments in polyphonic music using single-trial eeg classification,” Jour-nal of neural engineering, vol. 11, no. 2, p. 026009, 2014. [25] B. Kaneshiro, D. T. Nguyen, J. P. Dmochowski, A. M. Norcia,
and J. Berger, “Naturalistic music eeg dataset - hindi (nmed-h),” https://purl.stanford.edu/sd922db3535, 2016.
[26] S. Losorelli, D. T. Nguyen, J. P. Dmochowski, and B. Kaneshiro, “Nmed-t: A tempo-focused dataset of cortical and behavioral responses to naturalistic music,” 2017. [27] S. Stober, A. Sternin, A. M. Owen, and J. A. Grahn,
“To-wards music imagery information retrieval: Introducing the openmiir dataset of eeg recordings from music perception and imagination.” in ISMIR, 2015, pp. 763–769.
[28] H. Akbari, B. Khalighinejad, J. L. Herrero, A. D. Mehta, and N. Mesgarani, “Towards reconstructing intelligible speech from the human auditory cortex,” Scientific reports, vol. 9, no. 1, p. 874, 2019.
[29] B. Blankertz, S. Lemm, M. Treder, S. Haufe, and K.-R. M¨uller, “Single-trial analysis and classification of erp com-ponentsa tutorial,” NeuroImage, vol. 56, no. 2, pp. 814–825, 2011.
[30] E. W. Noreen, Computer-intensive methods for testing hy-potheses. Wiley New York, 1989.
[31] A. Yeh, “More accurate tests for the statistical significance of result differences,” in Proceedings of the 18th conference on Computational linguistics-Volume 2. Association for Com-putational Linguistics, 2000, pp. 947–953.