International Journal of Biological and Agricultural DEROUICHE and al.1(1) Jun 2018 Pages 10-18
Investigation of the Oxidative Stress markers in salivary, serum and
erythrocyte ofEl-Oued (Algeria) Diabetic Patients
DEROUICHE Samir ¹*, HABITA Asma¹, DEGACHI Ouidad¹, NECIB Maroua ¹, CHETEHOUNA Roumaissa ¹
1Department of Cellular and Molecular Biology, Faculty of Natural Sciences and Life,
University of Echahid Hamma Lakhdar El Oued, El Oued 39000, (Algeria).
P
Received 1 Jun 2018/Accepted 19 Jun 2018/ Published online 30 Jun 2018
International Journal of Biological and Agricultral Reasearch ( IJBAR)
Journal home page: www http://www.univ-eloued.dz/ijbar/
DEROUICHE Samir Department of Cellular and Molecular Biology, Faculty of Natural Sciences and Life, University of Echahid Hamma Lakhdar El Oued (Algeria)
E-mail: dersamebio@gmail.com
Abstract
The aim of this study was to evaluate the state of oxidative stress during diabetes in El-Oued (Algeria) patients. The experimentation is carried out on 72 voluntary individuals were divided into three groups. The first group of healthy individuals (controls), the second group diabetic type 1and the third group diabetic type 2, on which we measured some biochemical parameters on serum, erythrocytes and saliva. The Results showed a significant decrease in serum uric acid concentration in diabetics type 1 (10.78%) and diabetics type 2 (26.83%) and a significant decrease (p <0.05)in erythrocytes GSH in both types of diabetes compared to controls. On the other hand, there was a significant increase (p <0.05) in serum and salivary peroxidation lipidique (MDA) in type 1 and 2 diabetics compared to non-diabetics. In addition, a significant correlation (p <0.05) between serum and salivary MDA in type 1 diabetics (R2 = 0.750) and type 2 diabetics (R2 = 0.768)
was shown in this study. In conclusion the present study reveals that diabetes induces an imbalance of oxidant / antioxidant status at serum, erythrocyte and salivary level and that salivary MDA is a good indicator of the state of oxidative stress in diabetes.
International Journal of Biological and Agricultural DEROUICHE and al.1(1) Jun 2018 Pages 10-18
Introduction
Diabetes mellitus is a group of metabolic diseases characterized by hyperglycemia resulting from a disorder that affects the ability of the body to synthesize or use insulin [1]. WHO predicts global growth in the prevalence of diabetes, which is expected to reach 300 million patients by 2025 [2]. Diabetes mellitus is responsible for a serious morbidity including retinopathy with risk of vision loss; Nephropathy leading to renal failure; Peripheral neuropathy with a risk of foot ulcers, amputations and increased incidence of cardiovascular disease atherosclerosis [3]. Many studies suggest that diabetes is accompanied by an oxidative stress that promotes the development of the disease by disrupting insulin secretion, favoring insulin resistance [4]. Oxidative damage due to free radicals is associated withvascular disease in people with type 1 and those with type 2 diabetes mellitus [5]. Oxidative stress defines an imbalance between the levels of reactive oxygen species produced and the ability of a biological system to detoxify the reactive intermediates, creating a perilous situation by contributing to cellular damage [6]. This imbalance appears as a common denominator in various pathological processes in which an oxidative insult causes cell death and tissue damage [7]. The regulation of redox homeostasis is fundamental for the maintenance of normal cellular functions and for the survival of cells [8]. The objective of our study is to evaluate markers of oxidative stress in serum, erythrocyte and saliva to control the state of oxidative stress in type 1 and type 2 diabetics. Subject and methods
Ethical approval (Appendix) was sought and approved by theEthical Committee of the Department of Cellular and MolecularBiology, Faculty of natural science and life, University of ElOued.We studied patients with newly diagnosed and treatedtype 1 diabetics (24 patients)mean aged 42.08 ± 3.81 years and type 2 diabetics (24 patients), mean aged 50.67 ± 2.94 years, werejoined in this study. A total of 24 females' healthy volunteers(mean aged 35.45 ± 4.48 years) served as controls with normalserum blood glucose.All the volunteers in this study live in the El Oued area located in the southeast of Algeria.
Inclusion Criteria
Patients who had clinical diagnosis and laboratory findings ofdiabetes disease type 1 and type 2 for more than three months evidenced
Exclusion Criteria
To eliminate the factors which might affect free radicalantioxidant activity, we excluded all High blood pressure and other chronicdiseases subjects from patient groups and healthy controls. Laboratory Investigations
Fasting blood samples were collected and transferred into EDTA tubes for hemoglobinand GSH assay and in non-heparinized tubes for serum glucose and uric acid analysis. Serum was obtained by centrifugation of the blood at 3000 × rpm for 5 min and stored at -20°C until analysis. Saliva is collected in tubes after a 12-hour fast. The samples were collected between 08:00 hours and 10:00. At least 1 hour after mouth washed. The samples were centrifuged at 4000 rpm for 5 minutes and the transparent supernatanttransferred into another tube and then stored at -20 ° C. until use.Saliva was
International Journal of Biological and Agricultural DEROUICHE and al.1(1) Jun 2018 Pages 10-18
used for MDAassay.The determination of blood glucose is according to the method of Kaplan et al 1984[9],The serum uric acid assay according to the method of Schultz 1984[10].Hemoglobin is assayed automatically by the NFS auto-analyzer. The dosage of salivary and serum MDA according to the method of Nourooz-Zadeh et al., 1996[11]; MDA is the most widely used marker in lipid peroxidation. In brief After hot acid treatment, the aldehydes react with thiobarbituric acid (TBA) to form a chromogenic condensation product consisting of 2 molecules of TBA and one molecule of MDA. The intense absorption of this chromogen takes place at a 532 nm.The GSH assay according to the method of Sedlakand Lindsay 1968[12], which is based on a colorimetric method based on the oxidation reaction of GSH by 5,5'-dithiobis 2-nitrobenzoic acid (DTNB), releasing Thus thionitrobenzoic acid (TNB), the reading of the absorbance is carried out at a 412 nm.
Statistical analysis
The statistical evaluation is carried out by the student T testusingMinitab software(version 13.31) The reported data are the means of measurements and theirstandard error of mean (SEM) values. Results
The results obtained in this study clearly show that diabetes is confirmed by the hyperglycemia observed in type 1 and 2 diabetic patients compared to control, the results also show no significant difference in the concentration of l Hemoglobin in diabetic groups when compared to the control(Table 1).
Table 1.Description and concentrations of glucose and hemoglobin in controls and diabetics Group description Control
(n=24)
Diabetic type 1 (n=24)
Diabetic type 2 (n=24)
Mean age (years) 35.45±4.48 42.08±3.81 50.67±2.94
Sex ratio (men:women) 12:12 10:12 14:8
Blood glucose (g/l) 0.97 ±0.037 2.03±0.12*** 1.70±0.09***
Hemoglobin (g/dl) 13.13±0.39 13.65 ±0.88 13.45 ±0.39
*** p <0.001: significant difference compared to the control group. Values are mean ±SE
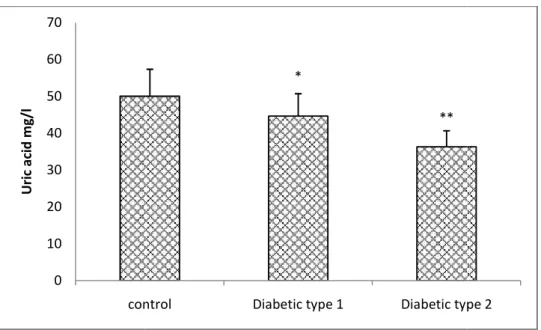
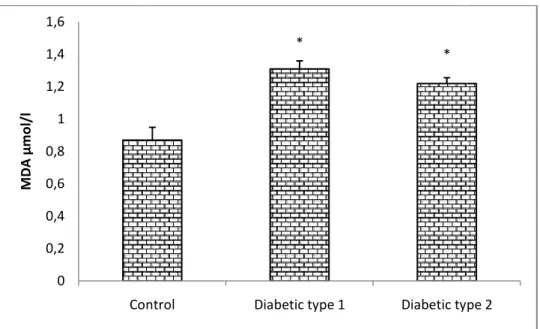
Our results also show that the level of salivary and serum MDA are significantly elevated (p<0.05)in type 1 and type 2 diabetic patients compared to the control(fig 2 and fig 3), concerning antioxidants statue, the results shows a significant decrease (p <0.05 and p <0.01)in the concentration of serum uric acid in Type 1diabetics and type 2diabetics respectively in comparison with the control(fig 1). Moreover, the erythrocyte GSH level is significantly decreased (p <0.05 and p <0.01)in both type 1 and type 2 diabetic respectively compared to controls.(fig 4)
International Journal of Biological and Agricultural
Fig. 1.Serum uric acid concentration in controls and presented as Mean ± ES for (n = 24).
Fig. 2. Serum MDA concentration in controls and data are presented as Mean ± ES for (n = 24).
0 10 20 30 40 50 60 70 control U ric a ci d m g/ l 0 0,5 1 1,5 2 2,5 3 3,5 4 4,5 Control M D A µm ol /l
International Journal of Biological and Agricultural DEROUICHE and al.1
Serum uric acid concentration in controls and type 1 and type 2 diabetic patients. The data are presented as Mean ± ES for (n = 24). * P <0.05, **P <0.01: significant difference compared to the
control group.
concentration in controls and type 1 and type 2 diabetic patients. data are presented as Mean ± ES for (n = 24). * P <0.05: significant difference compared to the
control group.
*
**
control Diabetic type 1 Diabetic type
*
*
Control Diabetic type 1 Diabetic type
1(1) Jun 2018 Pages 10-18
diabetic patients. The data are : significant difference compared to the
diabetic patients. The P <0.05: significant difference compared to the
Diabetic type 2
International Journal of Biological and Agricultural
Fig. 3.Saliva MDA level in controls and as Mean ± ES for (n = 24).
.
Fig. 4.Erythrocyte GSH
The data are presented as Mean ± ES for (n = 24).
In addition, the statistical evaluation <0.05)between serum and salivary MDA with correlation coefficient (R2 = 0.750) and (R
0 0,2 0,4 0,6 0,8 1 1,2 1,4 1,6 Control M D A µm ol /l 0 0,5 1 1,5 2 2,5 Control G SH µ m ol /m g H b
International Journal of Biological and Agricultural DEROUICHE and al.1
in controls and type 1 and type 2 diabetic patients. The data are presented as Mean ± ES for (n = 24). * P <0.05: significant difference compared to the control.
rythrocyte GSH concentration in controls and type 1 and type 2
The data are presented as Mean ± ES for (n = 24). * P <0.05, **P <0.01: significant difference compared to the control group.
In addition, the statistical evaluation(fig 5 and 6)showed there was a good correlation and salivary MDA concentration in both types1Diabetes and
= 0.750) and (R2 = 0.768) respectively.
*
*
Control Diabetic type 1 Diabetic type
*
**
Control Diabetic type 1 Diabetic type
1(1) Jun 2018 Pages 10-18
diabetic patients. The data are presented ference compared to the control.
type 1 and type 2 diabetic patients. : significant difference
showed there was a good correlation (p Diabetes and type 2 diabetes
Diabetic type 2
International Journal of Biological and Agricultural DEROUICHE and al.1(1) Jun 2018 Pages 10-18
Fig. 5. Showing the correlation between serum MDA and Salivary MDA in type2 diabetes (The number of samples used in this correlation was 24).
Fig. 6. Showing the correlation between serum MDA and Salivary MDA in type1diabetes (The number of samples used in this correlation was 24).
4. Discussion
The aim of our study is to evaluate markers of oxidative stress in serum, erythrocyte and saliva to control the state of oxidative stress in diabetes. In our study diabetes is confirmed by the hyperglycemia observed in type 1 and 2 diabetic patients, resulting from a disorder that affects the body's ability to manufacture or use insulin [13]. In our study, we also found that the level of serum uric acid is decreased in type 1 and 2diabetics. The decrease in uric acid can be explained by the increased the formation of free radicals showing that uric acid as an antioxidant is used in the fight against oxidative stress [14]. Oxidative stress is theconsequence of both increased production of free
y = 0,242x + 0,374 R² = 0,768 0 0,2 0,4 0,6 0,8 1 1,2 1,4 1,6 1,8 0 1 2 3 4 5 6 Sa liv ar y M D A µm ol /l
Serum MDA µmol/l
Diabetic type 2 y = 0,418x - 0,118 R² = 0,750 0 0,2 0,4 0,6 0,8 1 1,2 1,4 1,6 1,8 2 0 1 2 3 4 5 Sa liv ar y M DA µ m ol /l
Serum MDA µmol/l
International Journal of Biological and Agricultural DEROUICHE and al.1(1) Jun 2018 Pages 10-18
radicals andreduced capacity of the anti-oxidative defense such as uric acid [15].In addition, serum uric acid level is low due to increased urate clearance [16], a positive relationship has been described between glycosuria and uricosuria, therefore there would be interference between reabsorption Tubular glucose and tubular capacity to reabsorb urate. Hypouricemia may be a marker for the onset of diabetic kidney disease [17]. Our results also show that the level of salivary and serum MDA is significantly elevated in diabetic patients. Saliva may be the first line of defense against oxidative stress [18]. The various changes in saliva compositions indicate that the salivary glands are targeted organs in diabetes mellitus, and then the increase in lipid peroxidation can be discussed by a high concentration of lipid fractions in the saliva and blood as Shown in the Natheer study, 2011 generally follow those seen in the serum which is significantly different from that of the control group. This may indicate that the salivary lipid profile in diabetic patients may result from a systemic composition of dyslipidemia and the serum is reflected in saliva composition [19]. Proportionately increased vulnerability of the diabetic patient to cardiovascular complications. In this study, the results revealed a significant decrease in reduced glutathione (GSH) in diabetics compared to controls.This decrease in GSH levels may be due to its consumption in the scavenging free radicals [20] generated by Diabetes.The latter may cause oxidative stress by numerous routes, such as glucose autoxidation, polyol pathway [21] and glycation of proteins [22], this last glycation resulted from the formation of a covalent bond between the aldehyde function of glucose and the free amino groups of the proteins. This bond gives products known as Amadori which have the particularity of possessing a ketol group which can, in the presence of transition metals, yield an electron to molecular oxygen, leading to the formation of superoxide anions [23]. In addition, elevated glucose concentration may lead to increased GSH oxidation and decreased regeneration [24].The results showed there was a correlation between serum and salivary MDA concentration in both types of Diabetes.This correlation between saliva and oxidative serum biomarker enhances the utility of saliva as a valid diagnostic fluid [25].
Conclusion
In conclusion the present study reveals that diabetes induces significant oxidative stressshown very clearly by serum, salivary and erythrocyte markers, and that salivary MDA agood way of monitoring oxidative stress states associated with type 1 or type 2diabetes.
Conflict of interest
There is no conflict of interest. Acknowledgement
The author thanks the staff of laboratory of Faculty of naturalscience and life for providing research facilities to carryoutpresent work
References
International Journal of Biological and Agricultural DEROUICHE and al.1(1) Jun 2018 Pages 10-18
[2]Gning S, Thiam M, Fall F, Ba-Fall K, Mbaye P, Fourcade L. Diabetes mellitus in sub-Saharan Africa: epidemiological aspects and management issues. Med Trop,2007; 67:607-611.
[3] Tobias D. Diagnosis and Classification of Diabetes Mellitus. Diabetes Care,2004; 37: 581-590.
[4]Rosenstock J, Davies MP, Homep D, Larsen J, Koenenc, Schernthaner G. A randomised, 52-week, treat-to-target trial comparing insulin determine with insulin glargine when administered as add-on to glucose-lowering drugs in insulin-naive people with type 2 diabetes. Diabetologia, 2008; 51: 408–416.
[5] Derouiche S, DoudiDalal, Atia N. Study of Oxidative Stress during Pregnancy. Glob J PharmaceuSci, 2018; 4(5): GJPPS.MS.ID.555646.
[6]Vera D, Eunsung J, Maral M. The Role of Oxidative Stress in Parkinson’s disease. J Parkinsons Dis,2013; 3:461–491.
[7] Ranabela P, João S, Carlos M. Role of oxidative stress in the pathogenesis of nonalcoholic steatohepatitis. Free Radic. Biol. Med, 2012; 52:59- 69.
[8]Chiara G, Isaac S, Harris M, Tak W. Modulation of oxidative stress as an anticancer strategy. Nat Rev Drug Discov, 2013; 12; 931- 947.
[9]Kaplan LA. Glucose. ClinChem The C.V. Mosby Co. St Louis. Toronto,1984;1032- 1036.
[10]Schultz A. Uric acid. ClinChem The C.V.Mosby Co.St Louis. Toronto, 1984; 1261- 1266.
[11]Nourooz-Zadeh J, Tajaddini-Sarmadi J, Linkle Wolff SP. Low density lipoprotein is the major carrier of lipid hydroperoxydes in plasma. Biochem J. 1996; 313: 781-786. [12]Sedlak J, Lindsay RH.AnalBiochem,1968; 25: 192-205.
[13] Zebidi M, Seghiri I, Mehellou Z, Derouiche S. Evaluation ofAntioxidant and Anti- diabetic activity of leave aqueous extracts of OudneyaAfricana.World J Pharm Sci, 2018; 6(5): 48-53.
[14]Mythili A, Jamuna R. Uric acid in type 2 diabetes mellitus. Int J Pharma Bio Sci,2013; 4(3):1084 –1089.
[15] Derouiche S, Djouadi A. An evaluation of stress oxidative and serum electrolytes in female hypothyroid patients. Int J Biol Med Res, 2017; 8(1): 5861-5865.
[16]KushiyamaA, Tanaka K, Hara S., Kawazu S. Linking uric acid metabolism to diabetic complications.World J Diabetes,2014; 5(6): 787-795.
[17]Esparza M, García N.Hypouricemia and tubular transport of uric acid. Nefrologia,2011; 31(1):44-50.
[18]Buczko P, Zalewska A, Szarmach I.. Saliva and oxidative stress in oral cavity and in some systemic disorders. J PhysiolPharmacol, 2015; 66(1):3-9.
[19]Natheer H. Oxidative stress, antioxidant status and lipid profile in the saliva of type 2 diabetics. DiabVasc Dis Res, 2011; 8(1): 22–28.
[20]Atoussi N, Guediri S, Derouiche S.Changes in Haematological,Biochemical and Serum Electrolytes Markers in Women Breast Cancer Patients.Scholl JResAgriBio. 2018, 3(2): 73-177
[21]Prakasam A, Sethupathy S, Pugalendi KV.Antiperoxidative and Antioxidant
International Journal of Biological and Agricultural DEROUICHE and al.1(1) Jun 2018 Pages 10-18
J Biol Med,2005; 7(1): 15-23.
[22]Ramasamy R, Yan SF, Schmidt AM.Glycation and RAGE: Common Links in the Pathogenesis of Microvascular and Macrovascular Complications of Diabetes, Can J Diabetes, 2006; 30(4): 422-429.
[23]DelattreJ, Bonnefont-RousselotD, Bordas-FonfrèdreM,JaudonMC. Diabetes mellitus and oxidative stress. Annales de Biologie Clinique,1999; 57(4): 437-44. [24] Baynes JW, Thorpe SR. Rôle of Oxidative Stress in Diabetic Complications A New Perspective on an Old Paradigm. Diabetes,1999; 48 (9): 1-9.
[25]Wang J, Schipper H, Velly A, Mohit S, Gornitsky M. Salivary biomarkers ofoxidative stress: A critical review. Free RadicBiol Med,2015; 85: 95–104.