21.12.2017
Yeganeh FOROUHESHFAR
Najat EL MEKKAOUI
Université Paris-Dauphine Mme Najat EL MEKKAOUI
Ecole d'Economie de Paris M. Hippolyte D'ALBIS
M. Mouez FODHA
Université Paris 1 Panthéon-Sorbonne
M. Grégory PONTHIERE Université Paris Est (ERUDITE)
M. Philippe DE VREYER Université Paris-Dauphine Sciences économiques Directrice de thèse Présidente du jury Rapporteur Rapporteur Membre du jury
L’Université Paris-Dauphine n’entend donner aucune approbation ni impro-bation aux opinions émises dans les thèses ; ces opinions doivent être considérées comme propres à leurs auteurs.
To Pari To Omid
“Although the road is never ending take a step and keep walking, do not look fearfully into the distance... On this path let the heart be your guide for the body is hesitant and full of fear.”
Acknowledgments
First and foremost, I would like to thank my supervisor, Najat El Mekkaoui, first for accepting me in the master 111, helping me to construct my economic back ground, and for supervising me for the past five years. For all the support, encou-ragements and kindness she has shown me throughout the years. She has definitely been more than a supervisor for me, she has been a mentor, a guide and a true friend. These PhD years are for me filled with great memories, experiences of participating and organizing conferences. Thanks for believing in me, trusting me and implicating me in various different tasks, you made my dissertation years so rich, I profoundly cherish all these invaluable experiences.
I would also like to extend my full gratitude to all the jury members. It is a great honor that they have accepted to reread my work. I thank my two examiners, Professor Mouez Fodha and Professor Grégory Ponthière. I thank them for their availability and kindness. I am especially grateful for their time and extremely helpful critics, comments and recommendations in the pre-defense session. This work could have never been the same without it.
I am grateful to Dr. Sami Ben Naceur for kindly accepting to be a jury member of mine. From the very first days I stared this dissertation his research has shed light on my understanding of the financial markets in the region.
I would like to express my gratitudes towards Professor Hippolyte d’Albis, for his extraordinary character and kindness and for his detailed remarks and continuous help and support during these years, and also for offering me the opportunity to
tening courses I followed when I was pursuing my master’s degree, but especially for his support during my PhD years. From the first day I became a PhD student in Dial he made me feel welcomed and made me realize how lucky I am to be a member of such a great team. He included me in his PhD students seminar circle. I can’t thank him enough for all the encouragements and for considering me as his own student.
I also thank Professor Mouhoub El Mouhoud, I have learned a lot from his classes in my master’s year. Apart from being a great professor, he is a very kind, joyful and humble person that I was lucky enough to encounter. He gave me lots of great advises in the conferences and seminars and more importantly he made me to believe in myself. I am grateful for his kindness.
My sincere thanks also go to Professor Agnès Benassy Quéré, who offered me a life-changing internship in CEPII, that made me realize my love for economics. I changed my field to economics thanks to her influence and guidance, she honored me to be her co-author for which I will always be grateful.
My appreciations also go to Professor Eve Caroli, head of the doctoral program in Economics, for her caring, kindness, goodwill and contribution to the quality of doctoral training and students’ life. Also to members of “Ecole doctorale de Dauphi-ne” for their help, especially Chantal Charlier for her friendliness and help especially for the workshop organizations. I would also like to thank Igor Bratusek for his help with the final step of defense. His good humor, dedication and presence was so com-foting in the stressful moments of finalization. My appreciations also go to all the members of the Laboratoire d’Economie de Dauphine (LEDa) and all Dial members, especially organizers of weekly conferences.
I am also grateful to Professors Martine Carré-Tallon and Bernard Masson for entrusting me to be their teaching assistant for their macroeconomics course
du-ring the past 4 years, for their amiability and always considedu-ring my opinions and suggestions for the course, it was a very rewarding experience for me. Also the “In-ternational Office”, who offered me the opportunity to create my own course from a scratch, that was a whole new experience.
Although dissertation years are filled with many challenges and some may feel discomfort, stress and loneliness, I had the chance to be surrounded by great friends, who were always present to comfort and encourage me. The past five years have been filled with great memories Thanks to all these amazing people (some doctor already, other doctor-to-be) thank you for making PhD years fun and enjoyable : Marine, Lexane, Sandra, Nina, Bjorn, Fatma, Catherine, Marion, Doriane, Thao, Mohammad, Sana, Charlie, Geoffrey, Pierre, Homero, Ayman, Zied, Leslie, Lexane, Mathilde,Sarah, Marin, Virginie, Raphael, Marlon, Karine, Melanie, Anda, Estelle, Anne, Amina , Amine, Amine, Julien, Claire, Raphael, Charlotte, Maroua, Etienne, Etienne, Dio, Morgan, Daniel, Arnold, Eric, Alexie, Thomas and those, not from Dauphine, Maryam, Mahya, Gelareh, Maryam, Mojgan, Javad and Karim. Thanks for all parties, get togethers, coffee breaks, lunches in Crous, “pots”, discussions and debates, everything that made these years so memorable.
I would like to say a heartfelt thank you to my family, my mother, father and brother. Particularly my mom, who has always cared so much for my education. I will always be indebted to your unconditioned support and love, I also want to thank all my family who have provided me moral and emotional support : grandparents, aunts, uncles and cousins. And also my lovely in-laws, mother and father-in-law, who have always shown me love and support. Many thanks to my sisters and brothers in-law for their compassion and love.
Finally, I would like to thank the love of my life, Omid, for his continued support, encouragements and patience. For always having my back through all the ups and downs in the past 9 years. You are the person I bothered the most when my model didn’t converge or when I was blocked, it is such a great relief having you by my side
Table des matières
Acknowledgments i
Table des figures ix
Liste des tableaux xiii
Introduction Générale 1
General Introduction 11
1 A Global overview of the MENA region 19
1 Introduction . . . 20
2 The economic perspective . . . 21
2.1 Growth . . . 22
2.2 Inflation . . . 23
2.3 Employment . . . 25
3 Conflicts in the region . . . 29
4 The demographic perspective . . . 32
5 The financial sector perspective . . . 36
5.1 Financial institutions . . . 37
5.1.1 Size . . . 37
5.1.2 Access . . . 41
5.2 Financial Markets . . . 48 5.2.1 Size . . . 48 5.2.2 Access . . . 52 5.2.3 Efficiency . . . 56 6 Conclusion . . . 57 Appendices 58 1.A What are MENA countries and their classifications . . . 58
1.B Complementory Figures . . . 59
2 Demographic transition, financial markets and growth : Analysis of selected MENA countries 63 1 Introduction . . . 64 2 Theoretical Framework . . . 69 2.1 Demography . . . 70 2.2 Households . . . 72 2.3 Firms . . . 73 2.4 Wages . . . 75
2.5 Cost of investment for the representative firm . . . 75
2.6 Equilibrium . . . 77
3 Calibration . . . 78
3.1 Parameters . . . 78
3.2 The Demographic Shift . . . 80
3.3 Financial efficiency shock . . . 81
4 Results . . . 86
5 Conclusion . . . 102
Appendices 105 2.A The demographic shift parameters . . . 105
TABLE DES MATIÈRES
2.C Robustness check, constant human capital . . . 110
3 Financial and economic development : evidence from MENA coun-tries 115 1 Introduction . . . 117
2 State of art . . . 118
3 Financial market indicators . . . 123
4 Data . . . 124
5 Methodology . . . 125
6 Results . . . 128
7 Conclusion . . . 135
Appendices 138 3.A Variable definition and sources . . . 138
3.B Summary statistics . . . 138
3.C Financial efficiency and growth . . . 140
4 A new comprehensive index for the financial sector development in the MENA region 141 1 Introduction . . . 142
2 Literature Review . . . 145
3 Methodology . . . 148
3.1 Theoretical framework . . . 150
3.2 Data preparation and selection . . . 151
3.3 Treating the missing data . . . 156
3.4 Normalization . . . 159
3.5 Weighting . . . 159
3.6 Aggregation . . . 163
4 Results . . . 165
Appendices 173
4.A Principal Component Analysis . . . 173
4.B Variable Description . . . 175
4.C Rankings for components of sub-indices . . . 178
4.D Evolution of indices . . . 182
5 General Conclusion 187 1 Main results . . . 190
2 Policy relevance . . . 193
3 Limitations and future research . . . 194
Table des figures
1.1 GDP growth for non-oil exporting countries . . . 23
1.2 Crude Oil Prices . . . 24
1.3 GDP growth for oil exporting countries . . . 25
1.4 Unemployment rates in MENA in 2014 : youth vs. total . . . 27
1.5 Unemployment rates in different regions of the world . . . 28
1.6 Unemployment rates in 2014 : female vs. male . . . 29
1.7 Outspreading conflicts in the region . . . 30
1.8 Economic impact of conflict . . . 31
1.9 Youth population in MENA . . . 32
1.10 Fertility and mortality rates in MENA region . . . 33
1.11 Population distribution in 2011 for selected regions . . . 34
1.12 Population under 15 in MENA region (in % of total population) . . 35
1.13 Labor force in MENA region (in % of total population) . . . 35
1.14 Population above 65 years old in MENA region (in % of total popu-lation) . . . 36
1.15 Financial institutions composition (2009) . . . 39
1.16 Central bank assets to GDP . . . 40
1.17 Central bank assets to GDP (2011 vs. 2014) . . . 40
1.18 Size of banks . . . 41
1.19 Size of other financial institutions . . . 42
1.21 Bank accounts per 1000 adults . . . 43
1.22 Account at a formal financial institution age 15+ . . . 44
1.23 Bank branches per 100000 adults . . . 45
1.24 Bank lending deposit spread . . . 46
1.25 Bank net interest margin . . . 46
1.26 Bank overhead costs to total assets . . . 47
1.27 The ratio of the three largest banks’s assets to total banking sector’s assets . . . 47
1.28 Stock market comparaison . . . 49
1.29 Stock market capitalization to GDP . . . 50
1.30 Stock market capitalization to GDP . . . 50
1.31 Stock market total value traded to GDP . . . 51
1.32 Stock market total value traded to GDP . . . 51
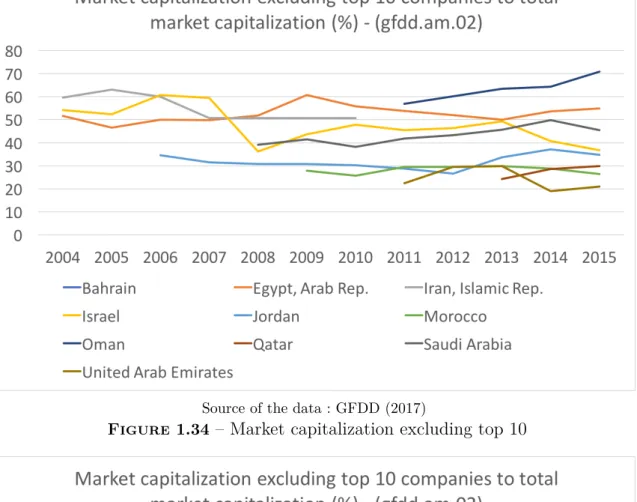
1.33 Market capitalization excluding top 10 . . . 54
1.34 Market capitalization excluding top 10 . . . 54
1.35 Value traded excluding top 10 . . . 55
1.36 Value traded excluding top 10 . . . 55
1.37 Stock market turnover ratio . . . 56
1.B.1GDP per capita - MENA oil-importers . . . 59
1.B.2GDP per capita - MENA oil-exporters . . . 60
1.B.3Population pyramid in MENA countries in 2016 (page1/2) . . . 61
1.B.4Population pyramid in MENA countries in 2016 (page2/2) . . . 62
2.1 Population dynamics by age and total . . . 83
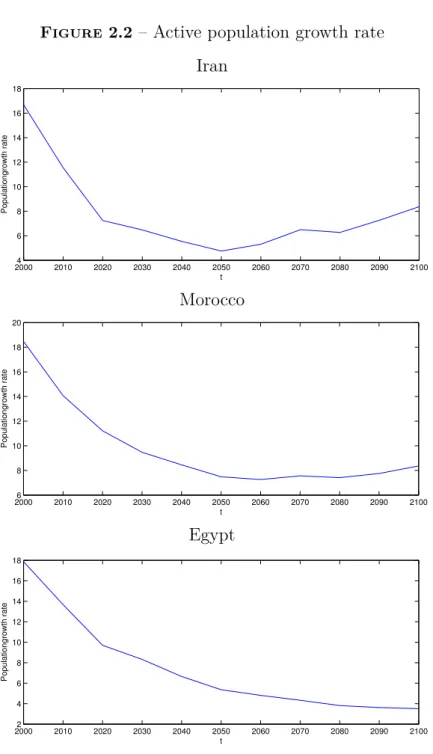
2.2 Active population growth rate . . . 84
2.3 The evolution of the share of the youngest and oldest age group in the labor force . . . 85
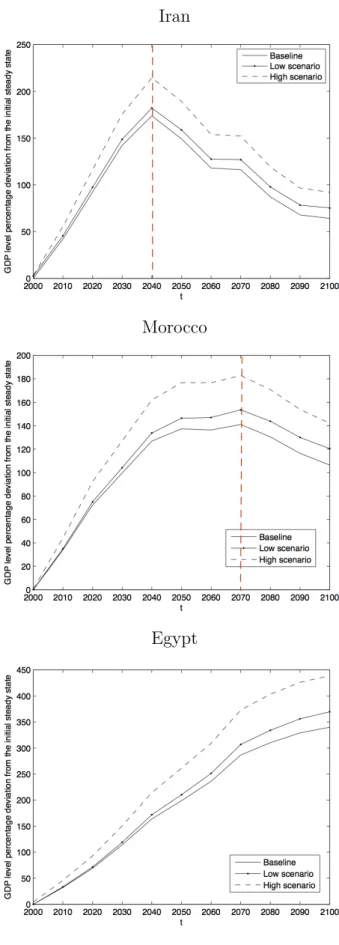
2.1 GDP level evolution (percentage deviation from the initial steady state) . . . 93
TABLE DES FIGURES
2.2 GDP per capita evolution (percentage deviation from the initial steady
state) . . . 94
2.3 Productivity, percentage increase compared to initial steady state . . 95
2.4 Unemployment rate evolution by age after the demographic shift . . . 96
2.5 Total unemployment rate evolution . . . 97
2.6 Total savings evolution, percentage deviation from the initial steady state . . . 98
2.7 Savings per capita evolution by age . . . 99
2.8 Wage evolution by age . . . 100
2.9 Interest rates evolution . . . 101
2.B.1GDP level evolution (percentage deviation from the initial steady state) for Iran . . . 106
2.B.2GDP per capita evolution (percentage deviation from the initial steady state) for Iran . . . 107
2.B.3Total unemployment rate evolution for Iran . . . 107
2.B.4Unemployment rate evolution by age after the demographic shift for Iran . . . 108
2.B.5Total savings evolution, percentage deviation from the initial steady state for Iran . . . 108
2.B.6Savings per capita evolution by age for Iran . . . 109
2.B.7Wage evolution by age for Iran . . . 109
2.B.8Interest rates evolution for Iran . . . 109
2.C.1GDP level evolution (percentage deviation from the initial steady state) . . . 110
2.C.2GDP per capita evolution (percentage deviation from the initial steady state) . . . 111
2.C.3Total unemployment rate evolution . . . 111
2.C.5Total savings evolution, percentage deviation from the initial steady
state . . . 112
2.C.6Wage evolution by age . . . 113
2.C.7Interest rates evolution . . . 113
3.1 Financial development and GDP per capita . . . 125
4.1 The Structure of the Composite Financial Index (CFI) . . . 152
4.2 Normalized weights following Factor Analysis . . . 161
4.1 Correlation of the composite indices with a traditional measure of the financial development : credit to the private sector to GDP . . . 168
4.2 GDP per capita and CFI . . . 170
4.A.1Representation of two components . . . 174
4.D.1CFI evolution . . . 182
4.D.2ME evolution . . . 183
4.D.3FI evolution . . . 184
Liste des tableaux
1.1 Mean of the inflation rate per decade . . . 26
1.2 Unemployment rate evolution in MENA . . . 26
1.3 Structure of the financial sector ( bank-based vs. market-based ) in 2010 . . . 38
1.4 Stock market indicators in 2009 . . . 52
2.1 General technological and preference parameters . . . 78
2.2 Age specific human capital . . . 79
2.3 Frictional labor market parameters and financial market efficiency . . 80
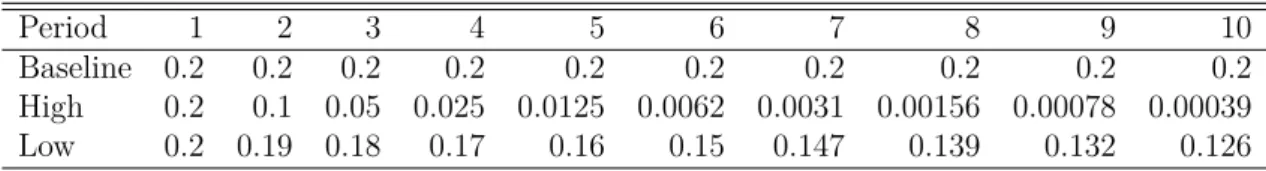
2.4 The value of (1−ϕ) or the cost of capital accumulation under different scenarios . . . 81
2.1 GDP per capita in 2100 . . . 87
2.2 Unemployment rates in 2100 . . . 90
2.A.1Demographic parameters . . . 105
2.B.1The value of (1−ϕ) or the cost of capital accumulation under different scenarios . . . 106
3.1 Variable description and source . . . 124
3.1 Dynamic panel linear regression . . . 129
3.2 Dynamic panel quadratic regression . . . 131
3.3 Panel regression : economic growth and credit to the private sector with country fixed effects table . . . 132
3.4 Panel regression : economic growth and Liquid Liabilities with
coun-try fixed effects table . . . 133
3.5 Panel regression : economic growth and Bank Deposits to GDP with country fixed effects table . . . 134
3.B.1Summary statistics . . . 138
3.B.2Correlation table for the underlying data . . . 139
3.C.1Panel regression for financial efficiency and growth with country fixed effects table . . . 140
4.1 MENA Countries in the sample . . . 151
4.2 Variables in sub-indicators . . . 155
4.3 Summary Statistics . . . 156
4.1 Rankings for CFI index and its components (in 2014) . . . 166
4.2 Summary statistics of indicators . . . 166
4.3 List of stock exchanges in MENA countries . . . 167
4.C.1Rankings for ME index and its components . . . 178
4.C.2Rankings for FI index and its components . . . 179
4.C.3Rankings for SFI index and its components . . . 179
4.C.4Rankings for EFI index and its components . . . 180
4.C.5Rankings for FM index and its components (in 2014) . . . 180
4.C.6Rankings for SFM index and its components (in 2014) . . . 181
Introduction Générale
Le Moyen-Orient et l’Afrique du Nord (MENA) est une région à fort potentiel de développement. Malgré les défis géopolitiques actuels, les pays de la région béné-ficient d’une situation géographique stratégique proche de l’Europe, de l’Afrique et de l’Asie. La structure démographique de la région est un autre atout, les taux de fécondité ont chuté à une vitesse fulgurante au cours des dernières décennies, ce qui rend ces pays enclins à atteindre le dividende démographique. Bien que les pays de la région aient des structures économiques très différentes, certains sont des expor-tateurs et d’autres imporexpor-tateurs de pétrole, ils ont tous un grand potentiel dans des secteurs tels que les énergies renouvelables, l’industrie manufacturière, le tourisme et les services aux entreprises.
Au cours des dernières années, les pays de la région ont mis en œuvre de nom-breuses réformes afin d’accroître l’ouverture économique, la diversification et le dé-veloppement du secteur privé. Ces réformes ont encouragé l’investissement, le com-merce et la croissance économique, mais elles étaient également incomplètes et n’ont pas pleinement abordé les questions économiques et sociales plus larges. Des réformes plus globales sont nécessaires pour adopter des modèles de développement inclusifs et durables qui améliorent les possibilités offertes à tous, en particulier aux jeunes et aux femmes. Pendant ce temps, la région est confrontée à des défis continus, elle souffre de taux de chômage extrêmement élevés chez les jeunes. Parmi les chocs externes, la chute persistante des prix du pétrole frappe fortement l’économie des pays exportateurs de pétrole de la région MENA. Les conflits et la crise des réfugiés
dans la région sont source d’incertitude et exercent une pression sur toute la région, soulignant la nécessité de rétablir la stabilité, d’initier la reconstruction et de fournir des opportunités aux immigrants.
L’impact du développement du secteur financier sur la croissance a été largement étudié dans la littérature économique. De nombreux travaux de recherche mettent en avant le rôle important du secteur financier dans la promotion de la croissance économique. Cinq fonctions clés sont identifiées dans la littérature, Levine (2005) :
— Produire des informations ex-ante sur les investissements possibles et allouer du capital.
— Surveiller les investissements et contrôler la gouvernance d’entreprise — Faciliter la négociation, la diversification et la gestion du risque — Mobiliser et mettre en commun l’épargne
— Faciliter les échanges de biens et services
L’analyse historique conforte l’impact positif du développement financier sur la croissance économique. Sylla (2006), étudie le PIB historique par habitant par rap-port à la moyenne mondiale à partir du XVIe siècle et le relie au développement financier de chaque pays. Par exemple, l’Italie au XVIe siècle avait le PIB par ha-bitant le plus élevé, tandis que les villes-états italiennes ont été les pionnières des technologies financières modernes à l’époque médiévale et de la renaissance. Les Pays-Bas ont connu leur révolution financière au cours des XVIe et XVIIe siècles et leur PIB par habitant a dominé le monde au XVIIe siècle. La révolution finan-cière anglaise a commencé en 1688 et a duré jusqu’au milieu du XVIIIe siècle, juste avant la révolution industrielle. La même tendance est observée pour les États-Unis, la France, l’Allemagne et le Japon où les données historiques suggèrent que le dé-veloppement financier a conduit à une meilleure performance économique et non l’inverse.
financiers favorise la croissance. Saint-Paul (1992), développe un cadre théorique pour analyser l’interaction entre les marchés financiers et le choix technologique. Ses résultats mettent en avant la nécessité de l’intervention du gouvernement pour encourager le développement du secteur financier. Selon Saint-Paul (1992), les re-tombées positives du secteur financier vers l’économie proviennent d’une meilleure diversification des risques, laquelle permet aux agents d’investir dans des projets plus risqués, plus novateurs et plus productifs. Ainsi, un secteur financier développé conduit à une croissance plus élevée.
Les études empiriques qui analysent la relation entre les marchés financier et la croissance trouvent cependant des résultats contradictoires. Levine et al. (2000)constatent une relation causale positive du développement financier sur la croissance dans 71 pays étudiés au cours de la période 1961-1995. Rajan and Zingales (1998) trouvent également la relation causale positive et excluent la causalité inverse.
De nombreuses études ont mis en avant des résultats plus contrastés et ce par-ticulièrement durant la crise financière de 2008-2009. Rousseau and Wachtel (2002) montrent que la finance n’a aucun effet sur la croissance dans les pays où l’inflation est à deux chiffres ; Demetriades and Hook Law (2006) examinent 72 pays sur la période de 1978 à 2000 et constatent que le développement financier n’affecte pas la croissance dans les pays à institutions défaillantes.De Gregorio and Guidotti (1995) est l’une des premières études qui constatent que la relation finance-croissance peut être spécifique. Ils montrent que dans ans pays développés, la profondeur financière est positivement corrélée avec la croissance (au cours de la période 1960-1985), alors que, lorsqu’ils se concentrent sur un panel de 12 pays d’Amérique latine, ils trouvent plutôt une corrélation négative entre la profondeur financière et la croissance. Rous-seau and Wachtel (2011) montrent que la corrélation positive entre la finance et la croissance constatée dans les études précédentes n’est pas robuste lorsque des don-nées plus récentes sont appliquées. Arcand et al. (2015) constatent que l’effet mar-ginal du développement financier sur la croissance du PIB devient négatif lorsque le
crédit au secteur privé dépasse100% du PIB.
La littérature empirique se concentre sur la profondeur financière et utilise presque toujours le “crédit au secteur privé”, comme la mesure de la taille du secteur finan-cier, ce qui ne correspond pas nécessairement aux canaux théoriques par lesquels la finance devrait affecter la croissance économique, c’est pourquoi la nouvelle littéra-ture sur la finance et la croissance explore des mesures alternatives du développement financier Laeven et al. (2015) introduisent l’innovation financière dans un modèle de croissance schumpétérien traditionnel et concluent que l’innovation financière est un moteur de croissance économique. Beck et al. (2014) utilisent la mesure tradition-nelle de l’intermédiation financière (le logarithme du “crédit au secteur privé”) avec un nouvel indicateur de la taille du système financier calculé comme la part de la valeur ajoutée du système financier dans le PIB et constatent que la taille du secteur financier n’est plus statistiquement significative. Ils concluent qu’une expansion du secteur financier n’ a pas d’effet à long terme sur la croissance. Cependant, à court terme, un secteur financier développé stimule la croissance au prix d’une plus grande volatilité dans l’économie.
Certaines études vont encore plus loin et affirment que le développement financier a un impact négatif sur l’économie réelle par une mauvaise allocation des ressources, Bolton et al. (2016), Tobin (1984) et Kneer (2013) suggèrent que les salaires éle-vés dans le secteur financier peuvent en effet avoir des retombées négatives sur les entreprises non financières, car une plus grande absorption des talents dans le sec-teur financier a un effet négatif sur la productivité dans des industries qui, pour des raisons technologiques, dépendent de la main-d’œuvre qualifiée.
La théorie économique souligne l’importance du développement du secteur fi-nancier sur la croissance. A partir d’un certain niveau de développement, l’impact peut être neutre ou négatif, et ce particulièrement dans les pays développés. Dans le cadre des pays en développement, de nombreux auteurs mettent en avant l’impact positif du développement des marchés sur la croissance économique. Les
institu-tions internationales recommandent la promotion du secteur financier dans les zones en développement. Il en est ainsi du Fonds Monétaire International (FMI) et de la Banque mondiale. Selon le FMI, Creane et al. (2006) “Afin de promouvoir une croissance rapide dans les pays MENA, la réforme du secteur financier doit être une
priorité dans l’agenda des gouvernements".1
L’objectif principal de cette thèse est d’analyser l’influence du secteur financier sur la croissance économique dans la région MENA. La thèse cherche donc à répondre aux questions suivantes : Les marchés financiers de la région MENA contribuent-ils au développement économique ? Comment la structure démographique peut-elle influencer cette relation ? Que révèlent les séries chronologiques à long terme sur cette relation et pourquoi ? Quelle est la meilleure façon de mesurer le développement du secteur financier pour les pays de la région ? En quoi les pays de la région diffèrent-ils en termes de développement financier ?
Le développement financier de la région s’accompagne d’une meilleure intégration régionale et internationale des marchés. Ces améliorations s’inscrivent dans le cadre du lancement d’un processus de rapprochement économique avec la création du Conseil de coopération du Golfe (CCG) en 1981, la signature du Traité instituant l’Union du Maghreb arabe (UMA) en 1989, la création de La Grande zone arabe de libre-échange (GZALE) sous l’égide de la Ligue arabe depuis 2005 et la signature de plusieurs accords de coopération et de partenariat entre les pays de la région ou entre eux et le monde occidental, y compris l’Union européenne. Ces intégrations restent différentes selon les pays de la région.
La thèse commence par un état des lieux de la situation économique et financière de la région. Un modèle théorique est développé et simulé pour quantifier l’impact de l’amélioration de l’efficience du secteur financier sur la croissance et le chômage. Une analyse empirique est ensuite menée afin de tester les résultats théoriques obtenus. Un indice de développement du secteur financier est créer pour procéder à une
évaluation plus approfondie de l’évolution des marchés financiers et des institutions financières dans les pays de la région.
Actuellement, la plupart des pays de la région MENA subissent des tensions démographiques, dans un contexte macroéconomique défavorable (taux de chômage des jeunes très élevé), ce qui est considéré par différents experts comme une des sources principales d’instabilité politique. La plupart des décideurs politiques de la région estiment qu’une croissance économique plus forte est un élément crucial de toute stratégie visant à lutter contre les taux de chômage toujours élevés dans la région.
Plusieurs pays de la région ont réalisé de nombreuses réformes structurelles dans le secteur bancaire et financier au cours de ces deux dernières décennies. Les marchés financiers de la région ont connu une croissance relativement importante. En parti-culier, la profondeur et la liquidité des marchés ont fortement augmenté en raison de la vague de privatisation dans le secteur industriel et manufacturier qui a débuté au début des années 90. Ce processus a contribué à l’expansion de la capitalisa-tion boursière totale régionale, multipliée par 9 entre 1993 et 2011. Parallèlement, le nombre de sociétés cotées a augmenté d’environ 60% entre 1993 et 2002.
Le taux de rotation des échanges des actifs financiers est passé de 34% en moyenne dans les années 1990 à plus de 74% dans les années 2000. Pourtant, la taille relative des systèmes financiers locaux par rapport aux économies nationales reste faible. Ainsi, la capitalisation boursière totale de la région atteint 64% du PIB contre une moyenne de 72% dans les pays à revenu intermédiaire, la moyenne mondiale étant de 88%. De même, le ratio de la valeur des transactions boursières par rapport au PIB est de 31% dans la région MENA contre 68% pour les pays à revenu moyen et 106% de la moyenne mondiale. Le développement des marchés de la région MENA reste limité par la domination des banques commerciales, caractéristique commune aux pays de la région.
indis-pensable à la croissance. Le développement des marchés est nécessaire dans les éco-nomies de la région dominée par une forte proportion de jeunes dans la population active. Au cours des prochaines années, selon les estimations des Nations Unies, près de 4 millions de personnes entreront sur le marché du travail de la région. La ré-gion MENA se distingue par des taux de chômage très élevés et ce particulièrement pour les jeunes relativement bien éduqués, sans experience, situés dans les zones ur-baines. Le chômage des jeunes (âgés de 15 à 24 ans)atteint 40% en Tunisie, Jordanie, Egypte, Algérie et Iran. Dans la région, l’éducation n’est pas une garantie contre le chômage. Il est aussi observé que le chômage est plus élevé pour les jeunes les plus éduqués. D’après les travaux du FMI sur la région, les pays importateurs de pétrole de la région ont le taux de chômage des jeunes le plus élevé au monde. De nombreux spécialistes le considèrent comme l’une des principales causes des révoltes connu sous le nom de “Printemps arabe”.
Les modèles mobilisés en économie montrent en général que les rendements d’équilibre des actifs financiers varieront en fonction de l’évolution de la structure par âge de la population. Néanmoins, il est délicat de démontrer ce résultats empiri-quement. L’impact de la démographie sur l’économie réelle ne doit pas être négligé. En effet, le vieillissement de la population peut influencer les marchés financiers dans le mesure où le comportement d’épargne des agents économiques évolue au cours de cycle de vie. Les modèles du cycle de vie montrent une relation positive entre les flux sortants des marchés boursiers et la part des personnes âgées (65 ans et plus). Aussi, une relation négative entre les flux sortants et la part des individus âgés de 45 à 64 ans. Selon Bloom and Canning (2004) depuis le début des années 1980, la littérature a mis en avant l’indépendance de la démographie sur la croissance éco-nomique. Les auteurs ont par la suite souligné que les besoins et la contribution des individus à l’économie varient tout au long de leur cycle de vie, ainsi la struc-ture démographique de l’économie et plus précisément la strucstruc-ture par âge jouent un rôle central dans la croissance économique. Favero et al. (2011) et Favero et al.
(2015), emploient des données américaines et fournissent des preuves empiriques de l’importance d’inclure la structure par âge de la population dans les modèles macro-financiers. Liao (2011) souligne l’importance de la transition démographique en tant que moteur de la croissance et montre que plus d’un tiers de la croissance de PIB à Taïwan au cours des quatre dernières décennies peut être attribué à la transition démographique. Boucekkine et al. (2002), étudient l’impact d’une amélioration de l’espérance de vie sur la croissance et concluent que, même si des probabilités de survie plus élevées conduisent à une meilleure scolarisation et à une retraite plus tardive, elles ne conduisent pas nécessairement à une croissance économique plus élevée. D’Albis (2007) détermine l’impact d’un changement démographique sur le capital par tête et conclut que cette relation est plutôt non monotone, contraire-ment aux modèles classiques à générations imbriquées qui établissent une relation décroissante entre l’accumulation de capital et la structure par âge. Martins et al. (2005) étudient l’impact du vieillissement dans les pays de l’OCDE, et impliquent que le changement de la structure par âge de la population affecte l’offre sur les marchés des capitaux, les marchés du travail et aussi la productivité ; ils concluent que la structure démographique a un impact réel sur les taux de croissance du PIB. Littérature théoriques traitant des marchés financiers et de la démographie, sou-vent, étudie l’effet du changement démographique sur les prix des actifs. Un cadre commun est celui des modèle à générations imbriquées (OLG) qui nous permet d’étu-dier la dynamique d’accumulation de capital. Geanakoplos et al. (2004) montre que les changements démographiques pourraient avoir un impact sur le prix des actifs ; Abel (2003) montre que le baby-boom finira par introduite une baisse dans les prix des actions quand la génération actuelle du baby-boom prendra sa retraite. La re-lation entre l’evolution démographique et les pris des actifs financiers repose ainsi sur l’hypothèse du cycle de vie, qui suggère que les jeunes (de 20 à 39 ans) sont probablement des emprunteurs. Ainsi, les prix des actifs financiers diminueraient ou ne seraient pas affectés à mesure que la proportion de ce groupe d’âge augmente
dans la population total. Le groupe à l’âge moyen (40-64 ans) joue un rôle impor-tant dans l’accumulation du capital et demande des actifs. Cela s’explique par le fait que leur revenue est le plus élevé et qu’ils épargneront probablement pour leur période de retraite. Une augmentation relative de la taille de ce groupe entraînerait une forte demande d’actifs financiers, par exemple des actions et des obligations, ce qui entraînerait une hausse des prix des actifs financiers. Hors, quand cette généra-tion prendre sa retraite (65 ans et plus), ils commencent à réduire leur richesse. Par conséquent, les prix des actifs financiers pourraient subir des pressions à la baisse.
Les chapitres de cette thèse sont les suivants. Le premier chapitre présente un aperçu général de la région, en mettant l’accent sur les perspectives économiques, démographiques et financières de la région. Dans le deuxième chapitre, nous pré-sentons un modèle à générations imbriquées, qui lie la croissance économique, les marchés financiers et la démographie. Le modèle est simulé pour trois pays de la ré-gion présentant des tendances démographiques différentes et les résultats montrent qu’un secteur financier plus efficace conduit à une meilleure performance économique et à des taux d’emploi plus élevés, notamment pour les jeunes. Le troisième chapitre teste empiriquement l’influence du secteur financier sur le secteur réel et trouve un impact négatif du développement du secteur financier sur la croissance économique. Ces résultats mettent en évidence l’inefficacité du secteur financier dans la région, étant donné qu’un développement plus élevé du secteur financier ne parvient pas à transmettre le capital à son utilisation la plus productive et à contribuer à la crois-sance. Cette étude souligne la nécessité de réformer le secteur pour le rendre plus efficace. Le quatrième chapitre est consacré au développement d’un indice financier dédié aux pays de la région qui regroupe les différents aspects du développement financier. L’indice est non seulement limité à la taille, à l’accès et à l’efficacité des marchés financiers et des institutions financières, mais il tient également compte de l’environnement macroéconomique du pays.
General Introduction
The Middle East and North Africa (MENA) is a region with great potential for development yet to be accomplished. Despite the current geopolitical challenges, the countries of the region benefit from a strategic geographical location close Europe, Africa and Asia . The young population is another asset in the region, the fertility rates have dropped strikingly fast in the past decades, unlike any other region in the world making these countries prone to attain the demographic dividend. Although the countries in the region have very different economic structures, some are oil exporters others importers, they all show great potential in sectors such as renewable energies, manufacturing, tourism and business development services.
In recent decades, MENA countries have implemented reforms to increase eco-nomic openness, diversification and private sector development. These reforms en-couraged investment, trade and economic growth ; but they were also incomplete and did not fully address broader economic and social issues. More comprehensive reforms are needed to adopt inclusive and sustainable development models that of-fer better opportunities for all, especially for the youth and for women. There is still high demand from the society for effective changes. Meanwhile the region faces continuous challenges, it suffers from extremely high unemployment rates for youth. Among the external shocks, the persistent fall in the oil prices hits hard the economy of MENA oil-exporting. More importantly, conflicts and refugee crisis in the region is a source of uncertainty and put pressure on all the region highlighting the need to regain stability, initiate reconstruction and provide opportunities for immigrants.
The economic theory is often in favor of the positive impact of the financial sector on growth. Hence, many believe that one key solution to partially overcome these challenges is to promote the financial sector, and policies in this direction are frequently recommended specially by international institutions such as the Interna-tional Monetary Fund and the World Bank. For instance, Creane et al. (2006) argue : “ As countries in the Middle East and North Africa consider ways to promote rapid and lasting economic growth, further financial sector reforms should be high in their agenda.”
The main goal of this thesis is to analyze this commonly held view point, that is, to examine whether there is a significant positive influence of the financial sec-tor on economic growth in the region. The thesis seeks to answer the following questions : Do the financial markets in the MENA region contribute to economic development ? How can an evolving demographic structure affect this relationship ? What do long-term time series, reveal regarding this relationship and why ? As we take into account the specificities of the region, what is the best way to measure the financial sector development ? How do the countries in the region differ in terms of financial development ?
The financial development of the region is accompanied by improvements in re-gional and international market integration. These improvements are in line with the launch of an economic rapprochement process with the creation of the Gulf Co-operation Council (GCC) in 1981, the signing of the Treaty Establishing the Arab Maghreb Union (AMU) in 1989, the establishment of the Arab Free Trade Area (AFTA) under the auspices of the Arab League and the signing of several agree-ments of cooperation and partnership between the countries of the region them-selves or between them and the Western world, including the European Union. This integration remains uneven across different countries of the region.
The thesis , initially gives an overview of the region’s economic and financial status. A theoretical model is introduced and simulated to quantify the impact of
the financial sector efficiency improvement on growth and unemployment, followed by an empirical approach and a deeper look into the available data to test these theoretical findings. An index for the financial sector development is introduced in the last chapter n order to better assess the development of the financial markets and institutions in the countries of the region.
Currently, most MENA countries are enduring demographic tensions leading to very high youth unemployment which is argued to be a source political instability. Most policymakers in the region agree that stronger economic growth is a crucial component of any strategy to address the region’s persistently high levels of unem-ployment and raises its living standards.
The region has been the subject of many structural reforms in the banking and financial sector during the past two decades. In fact, financial markets in the region have grown relatively large, and in particular, depth and liquidity of the market have risen sharply due to the wave of privatization that began touching the industrial and manufacturing sector in the first half of the 90s. This process has contributed to the expansion of the regional total market capitalization, multiplying it by 9, between 1993 and 2011. In parallel, the number of listed companies increased by about 60% between 1993 and 2002. The turnover ratio has also doubled from 34% on average in the 1990s to more than 74% during the 2000s. Yet, the relative size of local financial systems compared to domestic economies remains small. Thus, the total market capitalization of the region relative to its GDP did not exceed 64% against an average of 72% in middle-income countries and a worldwide average of 88%. Similarly, the ratio of the value of stock transactions to GDP was as low as 31% in MENA compared to 68% and 106% for the average middle-income countries and the whole planet. Actually, development of MENA markets remain constrained by the domination of commercial banks, a common characteristic of the countries of the region.
needed in order to enable financial development to be growth stimulator, which is essential in the region regarding its demographic trends and over-representation of young people in the labor force. Over the next few years there would be an estimated 4 million people entering the region’s labor markets. Yet the MENA region has already one of the highest unemployment rates in the developing world ; and MENA unemployed are predominantly young, relatively educated but not skilled workers, primarily located in urban areas. The share of youth (ages 15 to 24) in total unemployment at least doubles the total rate and they represent more than 40% of unemployed in Tunisia, Jordan, Egypt, Algeria and Iran. Unusually, education in this region is not a guarantee against unemployment. In fact, unemployment tends to increase with schooling, exceeding 15% for those with tertiary education in Egypt, Jordan and Tunisia. According to IMF notes on the region, MENA oil importer countries have the highest regional youth unemployment rate in the world, and many debaters regard it as a leading initiator of Arab revolts, so addressing high unemployment is a long-standing but increasingly urgent challenge for MENA countries. Thus, if developed financial markets can improve job market opportunities it can be used to enhance political stability.
The evolution of financial markets is relevant to a number of disciplines such as development economics, political science and demographics. Theoretical models generally suggest that equilibrium returns on financial assets will vary in response to changes in population age structure. Nevertheless, it is not easy to find robust evidence of such relationships in the time series data. Basically, baby boomer’s aging can affect financial markets in their middle ages, when they increase their savings, and also when they are retired and their asset accumulation tends to decline.
Therefore, while development in the financial sector can encourage economic growth, one should not neglect the impact of demographics in the real economy. Life cycle models predict a positive relationship between stock market outflows and the fraction of old people (65 and above), and similarly a negative relationship
between the outflows and fractions of the middle-aged population (45 to 64). Bloom and Canning (2004) argue that since the early 1980s the dominant academic belief was that the population growth is rather neutral to economic growth. However, the emerging evidence indicates that since people’s needs and contributions to the economy vary over their life cycle ; population does matter to growth, with age structure playing a central role. Favero et al. (2011) and Favero et al. (2015), based on US data provide empirical evidence to put forward the importance of including the age structure of the population in the macro-finance models. Liao (2011) highlights the importance of demographic transition as a driver for growth and show that more than one third of the output growth in Taiwan during the past four decades can be attributed to demographic transition. Boucekkine et al. (2002), study the impact of an improvement in life expectancy on growth and conclude that although higher survival probabilities lead to better schooling and later retirement, it does not necessarily lead to higher economic growth. D’Albis (2007), determines the impact of a demographic change on per capita capital and finds that this relationship is rather non-monotonic, in contrary to the classical OLG models that find a strictly decreasing relationship between capital accumulation and age structure. Martins et al. (2005) study the impact of aging in OECD economies, and imply the change in age structure of the population affects supply side of the economy in capital markets, labor markets and also the productivity ; they conclude that demographic structure has a real impact on GDP growth rates.
Theoretical papers dealing with financial markets and demography, investigate the effect of a demographic change on asset prices. A common framework is Over-lapping Generations (OLG) with production and capital accumulation. Geanakoplos et al. (2004) show that demographic changes could impact asset prices ; Abel (2003) shows that baby boom will eventually lead to a meltdown in stock prices as the cur-rent baby boom generation retires. The intuition behind the link between changing demographics and financial asset prices is the life cycle hypothesis, which suggests
young people (aged 20-39) are likely to be net borrowers. Thus financial asset prices would decline or be unaffected as the age group increases. The middle-aged (aged 40-64) are involved heavily in accumulation of net assets. This is because they are at the peak of their earnings potential, and likely to be saving for retirement. A relative increase in the size of this group would lead to a high demand for financial assets, e.g. stocks and bonds, resulting to an increase in financial asset prices. As the age group enters retirement (aged 65+), they start to de-cumulate their wealth. As a result, financial asset prices could come under downward pressure.
The outline of this thesis is as follows. The first chapter presents a general over-view of the region, with a focus on economic, demographic and financial market outlook of the region. In the second chapter an overlapping generation model is pre-sented, which, links economic growth, financial markets and demography. The model is simulated for three countries in the region with very different demographic trends and the results show that a more efficient financial sector leads to better economic performance and higher employment rates, furthermore, youth are the primary be-neficiaries of the reform in the financial sector. The third chapter tests empirically the spillovers from the financial sector to the real sector and finds a negative impact of financial sector development on growth these results highlight the inefficiency of the financial sector in the region, as higher development of the financial sector fails to transmit the capital to its most productive use an contribute to growth. This study underlines the urgent need to reform the sector in ways not to just increase the size of the sector but also its efficiency. The financial sectors are developing and evolving all around the world, this development is accompanied with further deepe-ning of the sector and financial innovation, which adds to the complexity of it, the once commonly used measures of financial development fall short to capture all these aspects, this stress the need to develop comprehensive indices that include different aspects of the financial sector. The fourth chapter is dedicated to the development of a financial index dedicated to the countries of the region that regroups different
aspects of financial development. The index is not only limited to size access and efficiency of the financial markets and institution, it also takes into account the macroeconomic environment of the country.
Chapitre 1
A Global overview of the MENA
region
Résumé
Ce chapitre présente une vue d’ensemble de la région MENA, en mettant l’accent sur trois aspects principaux : économique, démographique et financier. Cette vue d’ensemble est essentielle pour comprendre le contexte de cette thèse, et pour mettre en lumière les défis actuels et futurs auxquels les pays de la région devront faire face. Dans ce chapitre, nous identifions les caractéristiques spécifiques de la région MENA en examinant ses perspectives économiques, démographiques et l’évolution des marchés financiers. En général, l’activité économique est affaiblie par des conflits continus et la baisse significative du cours du pétrole initiée en 2014. La région est l’une des régions les plus jeunes de la planète, mais ce dividende démographique est aussi l’un des plus grands défis auquel la région devra faire face, car les taux de chômage des jeunes sont extrêmement élevés.
Les marchés financiers sont sous-développés et essentiellement dominés par les banques. L’évolution des marchés boursiers varie considérablement d’un pays à l’autre. Au cours des dernières années, nous observons un développement rapide
et hétérogène du système bancaire au sein des pays de la région. Entre-temps, la taille des autres investisseurs institutionnels, tels que les fonds de pension, des socié-tés d’assurance etc, reste faible. La population de ces pays est jeune et relativement bien éduquée. Le taux de chômage élevé de la région touche principalement les jeunes et les femmes.
En conclusion, la principale source de financement de la région reste le secteur bancaire. En outre, la croissance observée sur les marchés financiers telle que la bourse est importante mais reste hétérogène.
1
Introduction
This chapter gives a general overview of the MENA region, with a focus on the economic, demographic and financial outlook of the different countries in the region. This overview is essential to comprehend the context of this thesis, more importantly, to highlight the key challenges MENA countries are currently facing and the ones they will face in the years to come.
In a first step, we need to define which countries are included in the MENA re-gion, different authors may include or exclude specific countries in MENA. Some of these definitions of MENA are detailed in Appendix 1.A, all along different classifica-tions within the region. In this chapter we majorly use the World Bank’s definition of MENA, and only exclude two small countries, namely, Djibouti and Malta since the data is widely missing for them. Hence, in our definition of MENA we include :
Al-geria, Bahrain, Egypt, Iran, Iraq, Israel, Jordan, Kuwait, Lebanon, Libya, Morocco, Oman, Qatar, Saudi Arabia, Syria, Tunisia, United Arab Emirates, West Bank and Gaza, and Yemen.
In this overview, firstly, we focus on the economic perspective of these countries ; specifically we study economic growth, inflation control and employment that are three major elements of economic policy. Boosting growth is one of the key policy
2. THE ECONOMIC PERSPECTIVE
priorities in every county of the planet. In MENA, growth prospects severely chal-lenged in oil-exporting countries with the abrupt and persistent fall in the oil prices since the mid-2014. For MENA oil importers, even though the low oil price is a blessing, deepening conflicts and security disruption are the main barriers against high durable growth.
Secondly, we highlight the current demographic tensions in the region, notably overrepresentation of the youth in the population, causing MENA to be one of the youngest regions in the world, with more than 28% of the population aging between 15 to 29 (see Roudi-Fahimi and Kent (2007), Devlin (2010) and Dhillon et al. (2009)). This implies an increasing number of job seekers entering the labor market, that will exert pressure on the region’s labor markets for years to come. Some argue that the critically high unemployment rates specially among the youth is one of the triggers for the social tensions in the past couple of years known as the Arab spring.
Lastly, we overview the financial sector in the region following the framework introduced by Čihák et al. (2012), we divide the financial sector in financial markets and institution and study the size, access and efficiency within each aspect in past decades.
2
The economic perspective
The economic perspective of the region is largely dominated by geopolitical issues and oil price. Conflicts in Iraq, Libya, Syria, and Yemen are rising uncertainty and deteriorate confidence and present significant downside risks on the economic outlook of the region.
The drastic fall in oil prices in the second half of 2014, had a direct impact on the economic activity in the oil-exporting countries of the region, while on the other hand oil importers are benefiting from lower oil prices as well as economic reforms. The IMF has announced a modest overall growth rate of 2.5 percent for the
region in 2016, 0.5 percent point lower than its May 2015 projections (see Outlook (2015)).
2.1
Growth
Although most oil-importers in MENA progress towards political stability and enjoy lower oil prices accompanied with an improving economic perspective in the euro area that will encourage investment and exports ; but devastating conflicts in Iraq, Libya, and Syria are also intensifying security and social tensions in neighbo-ring countries, especially Lebanon, worsening in security, social tensions and refugee spillovers have weakened the economic activity. Figure 1.1, demonstrates the modest growth rates for MENA oil importer countries since 2000. For all these countries, growth in 2015 is lower than its value before the 2008 global financial crisis, this is partially due to external risks that have risen since October 2015, and also to more volatile financial conditions, and low interest rates in US and euro area. The GDP per capita level varies largely among the countries in the region, some countries are considered as the “High-income” countries namely, Bahrain Israel, Kuwait, Oman, Qatar and Saudi Arabia while others enter the “Upper middle income” group ; Alge-ria, Iran, Iraq, Jordan, Lebanon and Libya, and the remaining are considered “Lower middle income”, who are Egypt, Morocco, Syria, Tunisia, West Bank and Gaza and Yemen. Figures 1.B.1 and 1.B.2 in Appendix 1.B , show the GDP level for MENA the oil-exporters and importers, there does not seem to be a catch-up among the MENA countries.
The situation for oil exporters is not any brighter, since mid-2014 the oil prices have dropped nearly 70 percent to about $40 a barrel. Futures markets anticipate oil prices to recover only modestly to $50 a barrel by the end of this decade, although much uncertainty surrounds this forecast, the early 2010s prices of $100 per barrel seems long way off (See Outlook (2015) and Figure 1.2). This weak prospect for oil prices will lead to sluggish global growth, except for Iran, who is recovering from a
2. THE ECONOMIC PERSPECTIVE
Figure 1.1 – GDP growth for non-oil exporting countries
Source : World Development Indicators
negative growth rate in the post sanction period by boosting its exports. As is shown in Figure 1.3, in 2015 the growth rates remained moderate and around 3 to 4%, only Kuwait is having a negative growth rate of -0.4%, which is due to an ongoing dispute with Saudi Arabia over shared resources and the fall in the oil production by 1.7 % in 2015 that accounts for two-thirds of the Kuwaiti GDP.
2.2
Inflation
Inflation in MENA countries has been fairly controlled. In 2015, the weighted average consumer price index of the region increased by 3.4% annually. Table 1.1 shows the evolution of the inflation rate in MENA countries since the 70s. Within the MENA region, oil-exporting countries, on average achieved lower inflation in the 1980s reflecting tighter monetary policies and the nominal anchor provided by
Figure 1.2 – Crude Oil Prices
Source : http ://www.macrotrends.net/
pegging most of these countries’ currencies to the U.S. dollar. Nonetheless, since the beginning of the 1990s the inflation rate in oil-exporting countries as a group has been increasing, while this figure in non-oil exporting countries has been declining, ending up with a relatively better inflation performance in the latter group in 1990s.
At the individual country level, most of the MENA countries achieved single-digit inflation since the 1980s, and five countries, namely ; Bahrain, Kuwait, Oman, Qatar, and Saudi Arabia had better inflation performance than that of the ave-rage for industrial countries. Egypt significantly reduced inflation in the 1990s by strengthening fiscal and monetary policies. Contrary to Iran enduring the continues burden of inflation on its economy.
During the 2008 financial crisis, inflation rose in the region that got under control by 2009. The main drivers of the decline that began in mid-2014 are lower food and
2. THE ECONOMIC PERSPECTIVE
Figure 1.3 – GDP growth for oil exporting countries
Source : World Development Indicators
energy prices, and also currency appreciation against China and Euro, the main import partners of MENA countries.
Inflation rates remain high in Egypt, Yemen and Syria due to deepening conflicts. The situation of Iran is quiet different though, Iran has long been suffering from high price levels and never achieved a one digit inflation rate, this figure took off drastically after 2010, with the implementation of international sanctions, according to official statistics, inflation reached its highest level of 39% in 2013, and is declining ever since with the sanction relief.
2.3
Employment
Labor market in the region is fairly heterogenous, Table 1.2, presents the evolu-tion of the total unemployment rate for MENA countries.
Table 1.1 – Mean of the inflation rate per decade
Mean of the inflation rate 1970s 1980s 1990s 2000s 2010-2015
Algeria 8.22 9.03 18.55 3.21 4.71 Bahrain 12.56 2.25 0.79 1.57 2.02 Egypt 7.78 17.36 10.48 7.53 9.72 Iran 10.99 19.82 23.7 15.29 21.38 Jordan 10.81 7.02 5.07 3.86 3.42 Kuwait 8.64 3.58 3.13 3.4 3.58 Lebanon 1.18 1.63 Morocco 7.78 7.58 4.44 1.89 1.17 Oman 2.98 2.08 Qatar 3.81 2.87 5.7 1.57 Saudi Arabia 12.39 0.07 1.29 2.09 3.73 Syria 9.24 22.61 8.15 4.9 15.28 Tunisia 7.58 4.87 2.67
Inflation as measured by the consumer price index (data from WDI)
Table 1.2 – Unemployment rate evolution in MENA
Total Unemployment (% of total labor force) 1990s 2000s 2010-2014
Algeria 24.88 18.97 10.06
Bahrain 4.19 4.31 3.78
Egypt, Arab Rep. 9.5 9.84 12.01
Iran, Islamic Rep. 11.95 11.69 13.12
Jordan 15 14.10 12.26 Kuwait 0.8 1.39 3 Lebanon 8.03 8.06 6.23 Morocco 14.37 10.96 9.27 Oman 6.87 7.86 7.4 Qatar 0.41 0.82 0.42 Saudi Arabia 5.74 5.45 5.61
Syrian Arab Republic 8.31 9.76 10.67
Tunisia 15.72 13.92 14.37
United Arab Emirates 2.68 3.24 3.93
MENA 12.64 11.75 11.07
Source : International Labour Organization, Key Indicators of the Labour Market database.
2. THE ECONOMIC PERSPECTIVE
Unemployment in GCC counties1 is fairly low, these countries are mainly
impor-ters of labor force and are rich in natural oil and gas resources. Contrary to the other countries of the region where the unemployment rates are rather high and somehow persistent.
In the region unemployment is a youth phenomenon, and even though the total unemployment rates are not critically high, this figure is nearly tripled for the youth, Figure 1.4 demonstrates this huge gap. Unfortunately youth face difficulties finding a job after entering the labor market and despite their educational achievements. Unemployment rates are naturally higher among the youth in every region of the world, since they have less experience and have been on the market for a shorter period of time, but the gap is not as profound nowhere else on the planet. Hence, creating jobs for the youth is one of the main challenges in the region (see Figure 1.5).
Figure 1.4 – Unemployment rates in MENA in 2014 : youth vs. total
Source of the data : WDI
Youth unemployment refers to the share of the labor force ages 15-24 without work but available for and seeking employment.
1. Golf Cooperation Council (GCC) is a political and economic alliance of six Middle Eastern countries, namely, Saudi Arabia, Kuwait, the United Arab Emirates, Qatar, Bahrain, and Oman.
Figure 1.5 – Unemployment rates in different regions of the world
Source of the data : WDI
Dhillon et al. (2009) highlights the problems associated with the youth critically high levels of unemployment, and argue that even in the period of from 2002 to 2008 when the region faced high economic growth, the quality of education was not satisfactory and young population in the region had hard time to find decent jobs. MENA countries are currently having record number of graduates that are job seekers, and this pressure on the labor market are going to persiste under the present unfavorable economic situation hilighted by global economic downturn leading to fall in oil prices, exports, remittances and foreign investments.
From a gender point of view, unemployment rates among women are nearly twice as high as those for men, due to growing labor participation rates among women, with a high absorption of female labor force in the public sector. Figure 1.6 highlights this gap.
3. CONFLICTS IN THE REGION
Figure 1.6 – Unemployment rates in 2014 : female vs. male
Source of the data : WDI
3
Conflicts in the region
Since about the middle of the last century, the MENA region has experienced more serious and more frequent conflicts than any other region of the world. Figure 1.7 represents this worsening situation.
Conflicts in MENA countries such as Iraq, Libya, Syria, and Yemen have led to massive loss of life, human rights violation and destruction. From an economic perspective these conflicts have caused deep recessions, inflated inflation, worsened budgetary and financial conditions, and damaged institutions. These conflicts have fundamentally changed the physical, economic and social landscape of the region, which looked much more hopeful at the beginning of the Arab Spring just over six years ago. The harmful effects of the conflicts influence the neighboring countries such as other MENA countries and even Europe.
Rother et al. (2016) perform a quantitative analysis for a panel of 179 countries with annual data for the period 1970-2014 and show the impact of conflicts on
Figure 1.7 – Outspreading conflicts in the region
Source : Rother et al. (2016)
growth and inflation are large, on average for MENA Countries during years of conflict face a reduction in GDP growth of 1.5 percentage points ; GDP decrease by 4 percentage points in the first year and inflation increases by 2.3 percentage (Figure 1.8). Moreover, their results show the negative effects increase with the duration of the Conflict
The economic consequences of the conflicts has been disastrous in the domestic level. In 2015, after four years of fighting, the GDP in Syria, was less than half its pre-conflict level in 2010. In 2015 alone, Yemen lost an estimated 25-35 percent of its GDP, while in Libya, where dependence on oil made GDP growth extremely volatile GDP fell 24 percent in 2014 as violence increased. West Bank and Gaza offer a longer-term perspective of what can happen to growth in a fragile situation. The World Bank noted that the economy of the West Bank and the Gaza Strip has
3. CONFLICTS IN THE REGION
Figure 1.8 – Economic impact of conflict
Source : Rother et al. (2016)
virtually stagnated over the past 20 years, during which period almost 250 percent of average growth has been recorded in other MENA countries WB (2015). The strength of these GDP contractions in conflicts is remarkable, as the literature is more nuanced. Studies tend to suggest that the impact of conflicts usually depends heavily on the type, intensity, duration and geographical extent of violence Leeson (2007).
In addition, these conflicts have induced high inflation and burden on exchange rates. In Iraq and Afghanistan, inflation reached more than 30 percent in the mid-2000s and more than 15 percent in Yemen and Libya in 2011, after the supply of critical goods and services collapsed. In Syria, between March 2011 and May 2015, consumer prices raised more than 300 percent. Such inflationary dynamics is usually accompanied by strong devaluation pressure on local currencies. For example, the Syrian Pound has lost 90% percent of its value compared to its pre-war value against the US dollar.
4
The demographic perspective
The MENA region has a vibrant and growing population relative to other deve-loping regions. From 1950 to 2000, the regions population increased by nearly four times, from an estimated 100 million in 1950 to 380 million in 2000 Devlin (2010). This was faster than any other developing region and mostly due to rapid decline in mortality and slow decline in fertility rates.
Many, refer to MENA as the youngest region on the planet, with 90 million individuals being between 15 and 24, or one fifth of its total population in 2010. (see Figure 1.9 and Roudi (2011)). The median age in MENA is 22 years compared to a World average of 28.
Figure 1.9 – Youth population in MENA
Source : Roudi (2011)
Figure 1.10 represents these declines in fertility rates, Iran has the lowest fertility in the region in 2015. According to Assaad and Roudi-Fahimi (2007), the rapidly declining death rates and slowly declining fertility rates lead MENA’s population size quadrupled in the last half of the 20th century. Despite recent fertility declines, MENA’s population is projected to surpass 700 million by 2050. One consequence
4. THE DEMOGRAPHIC PERSPECTIVE
Figure 1.10 – Fertility and mortality rates in MENA region
Source of the data : WDI
of the region recent demographic trends is an increasingly notable youth bulge. This young population provides momentum for continued population growth in the region, despite declining fertility.
Mainly, we can highlight two distinctive characteristics in population trends of the region, first, relatively high proportion of population under 15, and second, the small proportion of retired (population of age 64 and above). These two factors, lead
to low old age-dependency ratio2 both, in present and also in upcoming years. For
the countries of the region, the next few decades could be the best opportunity to boost their economy before the inevitable aging. (See Figure 1.11)
In the following part we distinguish demographic evolutions in each country of the region, as it is shown in Figure 1.12, the ratio of under 15 to total population
2. Old age dependency ratio, is the ratio of older dependents (people older than 64) to the working-age population–those ages 15-64
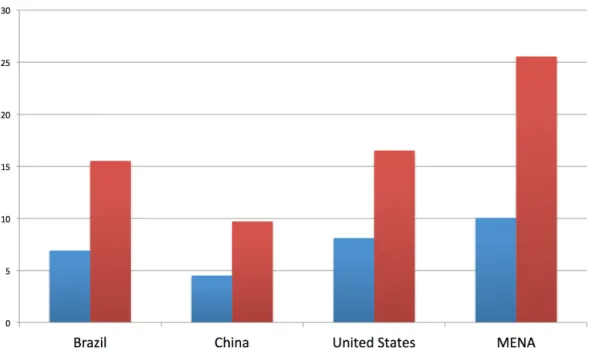
Figure 1.11 – Population distribution in 2011 for selected regions
Source of the data : WDI
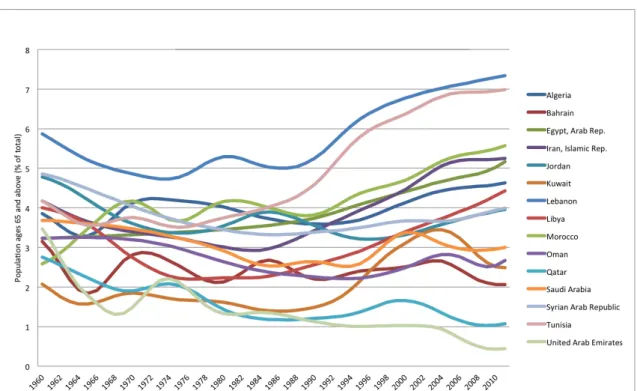
is relatively high, for example in 2011, it is 30.2% in average for MENA region compared to 18.5% for OECD countries. However, this difference is not compensated in a lower share of labor force in total population. As it is shown in Figure 1.13, in 2011, the share of population of age 15 to 64 in total population is around 65% in average for MENA countries which is comparable to 66.53% for OECD countries. Therefore a high ratio of children in the total population lead to a relatively low ratio of retired and elderly. The trend of this ratio is shown in Figure 1.14, which shows, in 2011 the population of age 65 and above represent 4.6% of total population, in average of MENA countries which is relatively low compared to 14.9% in the case of OECD countries.
This positive demographic horizon is an open widow towards better economic performance in the upcoming years.
It is also useful, to take a look at the population pyramids reported in Appendix 1.B, Figures 1.B.3 and 1.B.4, that highlights the diversification in the population structure in the countries of the region. The striking asymmetry between in the
4. THE DEMOGRAPHIC PERSPECTIVE
Figure 1.12 – Population under 15 in MENA region (in % of total population)
Source : WDI
Figure 1.13 – Labor force in MENA region (in % of total population)
Figure 1.14– Population above 65 years old in MENA region (in % of total
popu-lation)
Source : WDI
female and male population in Qatar, United Arab Emirates, Bahrain, Kuwait and Saudi Arabia is due to massive entrance of male labor to these naturally rich oil-exporter countries (this significant immigration is one of the main reasons that these countries are not selected for calibration in the second Chapter.)
5
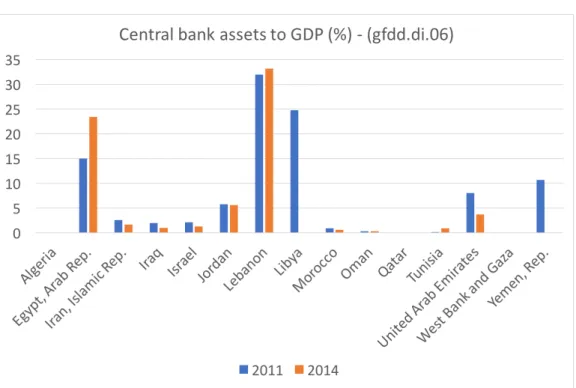
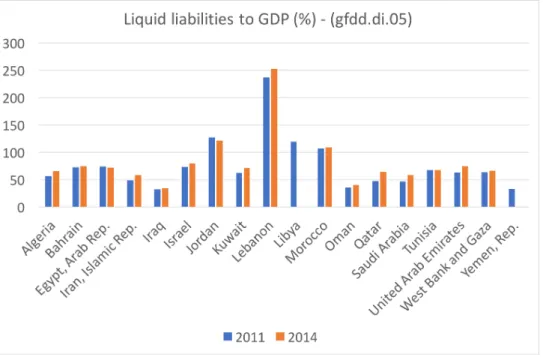
The financial sector perspective
Some studies have already pictured the banking and financial sector of the region so far, using conventional indicators of financial development in the case of MENA region (see Creane et al. (2004)), they unanimously highlight the need to reinforce the institutional environment. Here we use the Global Financial Development Database (GFDD) to picture the financial sector in the region, we follow Čihák et al. (2012) and divide the financial sector in markets and institutions and study the size, access and efficiency for both of these aspects.