Subcortical amyloid relates to cortical morphology in
cognitively normal individuals
Shady Rahayel,1,2 Christian Bocti,3 Pénélope Sévigny Dupont,1,2 Maude Joannette,1,2 Marie Maxime Lavallée,1,2 Jim Nikelski,4 Howard Chertkow,4,5 Sven Joubert1,2 (1) Department of Psychology, Université de Montréal, Montreal, Quebec, Canada (2) Research Centre, Institut universitaire de gériatrie de Montréal, Montreal, Quebec,
Canada
(3) Department of Neurology, Université de Sherbrooke, Sherbrooke, Quebec, Canada (4) Lady Davis Institute for Medical Research, Jewish General Hospital, McGill
University, Montreal, Quebec, Canada
(5) Department of Neurology and Neurosurgery, McGill University, Montreal, Quebec, Canada
Contact information of corresponding author: Shady Rahayel, PhD
Centre de recherche de l’Institut universitaire de gériatrie de Montréal 4545, Chemin Queen-Mary
Montréal, Québec, Canada H3W 1W4
E-mail address: [email protected] Telephone number: +1-514-340-3540 ORCID: 0000-0001-5786-3278
ABSTRACT (150-250 words)
PURPOSE: Amyloid (Aβ) brain deposition can occur in cognitively normal individuals and is associated with cortical volume abnormalities. Aβ-related volume changes are inconsistent across studies. Since volume is composed of surface area and thickness, the relative contribution of Aβ deposition on each of these metrics remains to be understood in cognitively normal individuals.
METHODS: A group of 104 cognitively normal individuals underwent neuropsychological assessment, PiB-PET scan, and MRI acquisition. Surface-based cortical analyses were performed to investigate the effects of cortical and subcortical Aβ burden on cortical volume, thickness, and surface area. Mediation analyses were used to study the effect of thickness and surface area on Aβ-associated volume changes. We also investigated the relationships between structural metrics in clusters with abnormal morphology and regions underlying resting-state functional networks and cognitive performance.
RESULTS: Cortical Aβ was not associated with cortical morphology. Subcortical Aβ burden was associated with changes in cortical volume, thickness, and surface area. Aβ-associated volume changes were driven by cortical surface area with or without thickness but never by thickness alone. Aβ-associated changes overlapped greatly with regions from the default mode network and were associated with lower performance in visuospatial abilities, episodic memory, and working memory.
CONCLUSIONS: In cognitively normal individuals, subcortical Aβ is associated with cortical volume, and this effect was driven by surface area with or without thickness. Aβ-associated cortical changes were found in the default mode network and affected
cognitive performance. Our findings demonstrate the importance of studying subcortical Aβ and cortical surface area in normal aging.
KEYWORDS
Amyloid-beta Subcortical
Default mode network Pittsburgh compound B Cognitive aging
1.1. INTRODUCTION
Alzheimer’s disease (AD) is characterized by beta-amyloid (Aβ) plaques and tau-containing neurofibrillary tangles [1]. Aβ accumulates for decades prior to the onset of clinical AD [2, 3]. The neurodegenerative influence of Aβ may be the greatest in the prodromal stage of AD when cognitive symptoms are still absent or undetected [4]. However, the influence of Aβ on brain morphology remains unclear in cognitively normal individuals.
Neuropathological studies have reported that Aβ deposition starts in the neocortex [1], with basal brain regions being affected first [5]. More specifically, the ventromedial prefrontal cortex, posterior cingulate cortex, and precuneus appear to be the first sites of Aβ deposition in non-demented individuals with normal Aβ positron emission tomography (PET) levels who go from normal to abnormal levels of cerebrospinal (CSF) Aβ levels during follow-up [6]. These regions are major hubs of the default-mode network (DMN), a network whose activity is altered in AD patients and cognitively normal individuals with higher Pittsburgh compound B (PiB) retention [7-9]. In cognitively normal individuals, Aβ-related cortical volume changes, with increases being associated with frontal, temporal, cingulate, and parietal atrophy [10-14], or with increased temporal volume [15].
Cortical volume is a metric composed of two distinct structural components, thickness and surface area [16], that follow different developmental trajectories and originate from distinct genetic determinants [17, 18]. Several studies investigated cortical thickness in
association with Aβ level in cognitively normal individuals, with findings being found in the temporal, parietal, frontal, and even occipital cortices [13, 19-22]. In contrast, only one investigation studied the contribution of thickness and surface area to volume change, with both thinning and reduced cortical surface area (trend) contributing to volume change in the entorhinal cortex in AD patients [23]. However, the interplay between thickness and surface area in volume changes associated with Aβ remains unclear in cognitively normal individuals.
The influence of Aβ is generally investigated using cortical PiB retention [24]. However, subcortical PiB retention appears to be a more sensitive predictor of structural changes, anxiety symptoms, and subsequent cognitive decline [25-28]. Indeed, increased subcortical Aβ burden predicts hippocampal atrophy, cognitive impairment, and cognitive decline with better accuracy than cortical accumulation alone [25, 26, 28]. No study has yet investigated the influence of subcortical Aβ accumulation on cortical morphology in cognitively normal individuals.
In this study, we used surface-based cortical analysis in cognitively normal individuals to investigate the association between cortical and subcortical Aβ burden and cortical volume, thickness, and surface area. We investigated how morphological changes related to resting-state functional networks and cognitive performance, as well as the contribution of thickness and surface area to cortical volume changes associated with Aβ. We hypothesized that subcortical Aβ would have a stronger association with cortical morphology than would cortical Aβ, particularly in regions of the DMN, and that it
would associate with cognitive performance. We also hypothesized that volume changes would be driven by surface area and thickness simultaneously.
1.2. MATERIAL AND METHODS
1.2.1. SubjectsOne hundred and four cognitively normal individuals aged 65 years and older were exclusively included in this study. They were recruited from a pool of healthy elderly volunteers at the Centre de recherche de l’Institut universitaire de gériatrie de Montréal (CRIUGM) and through advertisements. To be included, all subjects had to undergo extensive neuropsychological assessment, PiB-PET scan, and T1-weighted magnetic resonance imaging (MRI) acquisition. They were included if they performed ≥23 on the Montreal Cognitive Assessment (MoCA), ≥-1.5 SD from the mean of age-matched controls on at least one of the two following learning tests: the Logical Memory subtest from the Wechsler Memory Scale (WMS-III) and the two-minute delay from the Delayed Matching-to-Sample (DMS-48) task), and <11 on the Geriatric Depression Scale (GDS). In addition, none of the included participants had to express significant subjective memory complaints, considered as a performance >-2 SD from the mean on two subtests of a memory complaint questionnaire (Conversations and Movies/books subtests from the Self-Evaluation Questionnaire (QAM)). A detailed neuropsychological assessment was then performed in every participant, including assessment of episodic memory, working memory, executive functions, language, attention, processing speed and visuospatial abilities, and composite scores were calculated for each of these domains (see Supplemental Material 1). Exclusion criteria included a history of any neurological
disorder, a medical condition that could negatively affect cognition (e.g., untreated diabetes, thyroid dysfunction, etc.), a severe mental health disorder, a history of moderate to severe traumatic brain injury, a previous consultation for memory complaint, uncorrected hearing and visual problems, a history of alcoholism or drug addiction, as well as general anaesthesia in the last 6 months (see Supplemental Material 2 for a flowchart). Research protocols were reviewed and approved by the CRIUGM and the Montreal Neurological Institute and Hospital Research Ethics Boards. All subjects gave their informed consent prior to their participation in the study.
1.2.2. PET acquisition and processing
PET imaging was conducted at the McConnell Brain Imaging Centre at McGill University on a Siemens/CTI ECAT HR+ scanner in 3D imaging mode (63 parallel planes). PET scans were obtained over 40 minutes (7 frames: 6x300 seconds, and 1x600 seconds) following intravenous bolus injection of 11C-PiB.
The post-acquisition processing proceeded in two dependent stages: (1) submission of all structural volumes to the CIVET pipeline, and (2) subsequent processing of PET volumes via the Beagle pipeline. The CIVET pipeline (version 1.1.11), developed at the Montreal Neurological Institute (MNI) for the fully automated analysis of structural images, produced a wide range of products, including grey and white matter masks and transformations from native into the ICBM152 standardized space [29]. These products were then used by the Beagle multi-modal analysis pipeline [30], which performed alignment of the dynamic volume to the structural, image transformation and resampling
into the ICBM152 space, and spatial smoothing to increase signal-to-noise using a 6-mm full-width at half-maximum (FWHM) kernel. Once dynamic volume processing was completed, the Beagle pipeline then quantified PiB load at each voxel by dividing the PiB signal at the voxel by the average signal strength measured within the cerebellar grey matter (i.e., the reference tissue), a region largely spared from Aβ deposition [31]. As such, ratio values higher than 1.0 meant that the voxels exhibited a PiB-related signal of greater magnitude than that found within the cerebellum. Ratio values were then used to produce both global and localized (region of interest (ROI)-based) metrics. First, three standardized uptake value ratio (SUVR) values were computed: 1) one value representing the average of the values of all grey matter voxels (“global Aβ burden”); 2) one value representing the average of voxels of the cortical surface only (“cortical Aβ burden”) [15]; and 3) one value representing the area-weighted average of mean ratio values derived from the frontal, temporal, parietal, and posterior cingulate cortex (i.e., cortical regions highly associated with PiB retention in AD and normal aging) [24]. The ROI-based values were produced by non-linearly fitting a modified version of the Automated Anatomical Labeling (AAL) template to the ratio values volume [32]. Subcortical Aβ burden was quantified using subcortical ROIs of the bilateral hippocampus, amygdala, putamen, caudate nucleus, pallidum, and thalamus (i.e., 12 subcortical values). This processing has been used before in a study investigating the influence of subcortical Aβ on subcortical morphology in cognitively healthy older adults [28].
1.2.3. MRI acquisition and processing
All imaging data were acquired using a 3T Siemens TrioTIM magnetic resonance scanner (Siemens, Erlangen, Germany). High-resolution T1-weighted images were acquired using magnetization-prepared rapid gradient echo (MPRAGE), with the following parameters: repetition time=2.3 s, echo time=2.94 ms, inversion time=900 ms, flip angle=9 degrees, field of view=256x240, voxel size: 1mm x 1mm x 1.2 mm. PiB-PET imaging and MRI acquisitions both took place within a year, with an average of 89 days.
1.2.3.2. Cortical processing
Cortical reconstruction was performed using FreeSurfer (version 6.0.0) [33, 34]. Briefly, this processing includes motion correction [35], removal of non-brain tissue using a hybrid watershed/surface deformation procedure [36], automated Talairach transformation, segmentation of the subcortical white matter and deep grey matter volumetric structures [37, 38], intensity normalization [39], tessellation of the grey matter-white matter boundary, automated topology correction [40, 41], and surface deformation following intensity gradients to optimally place the grey matter-white matter and grey matter-CSF borders at the location where the greatest shift in intensity defines the transition to the other tissue class [34, 42, 43]. Once the cortical models are complete, a number of deformable procedures can be performed for further data processing and analysis including surface inflation [44], registration to a spherical atlas, which is based on individual cortical folding patterns to match cortical geometry across subjects [45], parcellation of the cerebral cortex into units with respect to gyral and sulcal structure [46, 47], and creation of a variety of surface-based data including maps of cortical volume, thickness, and surface area. This method uses both intensity and continuity information
from the entire three-dimensional magnetic resonance volume in segmentation and deformation procedures to produce representations of cortical thickness, calculated as the closest distance from the grey matter-white matter boundary to the grey-CSF boundary at each vertex on the tessellated surface [42]. The maps produced are not restricted to the voxel resolution of the original data, thus are capable of detecting submillimeter differences between groups. Procedures for the measurement of cortical thickness have been validated against histological analysis [48] and manual measurements [49, 50]. The maps are created using spatial intensity gradients across tissue classes and are therefore not simply reliant on absolute signal intensity. Cortical maps were smoothed using a 20-mm FWHM Gaussian smoothing kernel. Images were inspected and pial and white matter surface errors were manually corrected. Figures were created using Qdec included in the FreeSurfer distribution. One participant had to be removed from the analyses due to scan registration failure during MRI processing.
1.2.4. Statistical analysis
1.2.4.1. Cortical volume, thickness, and surface area analyses
Regression analyses of Aβ values on cortical thickness, surface area, and volume were investigated at each vertex of the cortical surface using general linear modelling. Cortical thickness, surface area, and volume were modelled individually as a function of group by controlling for the effects of age, gender, and education, as well as total intracranial volume for volume and surface area [51]. Analyses were performed in the ipsilateral hemisphere only (e.g., Aβ in the left hippocampus with cortical metrics from the left hemisphere). Results were considered significant at p<0.05 using a Monte-Carlo
simulation approach.
Significant clusters were then overlapped on a resting-state network atlas made of seven independent networks spanning the whole cortex: default-mode, ventral attention, frontoparietal, somatomotor, visual, dorsal attention, and limbic networks [52], and the percentage of overlap of the cluster was calculated. Age-corrected regression analyses were performed to investigate the relationships of cortical metrics showing associations with Aβ with composite cognitive scores. Partial correlation analyses were performed in a similar fashion between Aβ loads and cognitive performance. Correlations were considered significant at p<0.05; these analyses were exploratory in nature and therefore unadjusted for the multiple comparisons.
1.2.4.2. Mediation analysis of cortical volume
Mediation analysis is a statistical method used to test hypotheses regarding the way that an antecedent variable transmits its effect on a consequent variable. In this study, it was used on clusters showing significant associations between Aβ and cortical volume morphology to investigate the mediating effects of cortical thickness and surface area using the PROCESS toolbox [53] in IBM SPSS Statistics, version 22.0. Parallel multiple mediation analyses were conducted since the effects of cortical thickness and surface area on volume were found to be largely independent [18, 54]. Subcortical Aβ load in the structure was used as the antecedent variable, mean cortical volume (normalized for head size) from the cluster showing Aβ-related volume change as the consequent variable, and mean cortical thickness and cortical surface area (normalized for head size) from the
cluster showing Aβ-related volume change as the mediators. As such, the cluster with volume difference was projected back into each subject’s native space in order to extract mean values of volume, thickness, and surface area in this cluster for each subject. These data were entered in the mediation model in order to calculate the total (i.e., effect of amyloid on volume), direct (i.e., effect of amyloid on volume independently from thickness and surface area), and indirect effects (i.e., effects of amyloid on volume through thickness or surface area) of Aβ load on cortical volume. Age, sex, and education were included as covariates for all effects. A bootstrapping approach was used to test for significance with 10,000 bootstrap samples to generate 95% confidence intervals (CI). An association was considered significant when confidence intervals did not cross zero. Bootstrap confidence intervals tend to perform better than other competing approaches such as the normal theory approach, which would have required a normally-shaped sampling distribution for each specific indirect effect [55].
1.3. RESULTS
1.3.1. Demographic and clinical characteristics
As described above, the total sample was composed of 104 cognitively normal individuals (mean age: 73.4 years; 75% women; mean education level: 13.7 ± 3.2 years; mean MoCA score: 27.3) (see flowchart as Supplemental Material 2). One individual was excluded due to scan registration failure during MRI processing, yielding a sample of 103 individuals for the analyses. Demographics, clinical variables, and PiB retention values for the 103 individuals are available in Table 1.
1.3.2. Surface-based cortical analyses
1.3.2.1. Associations with local cortical volume
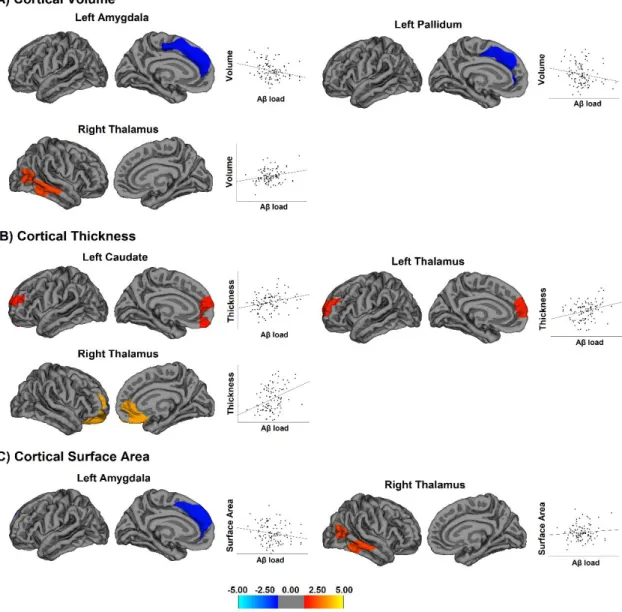
The associations between global and cortical PiB retention values and cortical volume were not significant. In contrast, local cortical volume was significantly associated with Aβ in the left amygdala and pallidum and in the right thalamus (Fig 1A and Table Suppl. 1). Aβ in the left amygdala and pallidum correlated with decreased volume in the medial portion of the superior frontal cortex (r=-0.39 and r=-0.30, respectively). As for the right thalamus, Aβ was associated with increased cortical volume in the middle and inferior temporal cortices that extended towards the temporo-occipital junction (r=0.41).
1.3.2.2. Associations with local cortical thickness
Global and cortical PiB retention values were not associated with cortical thickness. However, Aβ in the left caudate was associated with increased thickness in the medial prefrontal cortex (r=0.39), including the ventromedial and dorsolateral prefrontal cortex (Fig 1B and Table Suppl. 1). Aβ in the left thalamus also associated with thickening in the medial prefrontal cortex (r=0.38), including the dorsolateral prefrontal cortex. In the right thalamus, it was associated with increased thickness in the orbitofrontal, ventromedial, and rostral anterior cingulate cortices (r=0.37). In other words, increase in PiB amyloid retention in the caudate and thalamus was actually associated with cortical thickening in the medial prefrontal cortex.
No associations were found between global or cortical PiB and cortical surface area. In contrast, Aβ in the left amygdala was associated with decreased surface area in the medial frontal cortex (r=-0.38), whereas Aβ in the right thalamus was associated with increased surface area in the middle and inferior temporal cortices (r=0.28), extending posteriorly towards the temporo-occipital junction (Fig 1C and Table Suppl. 1).
1.3.2.4. Overlap with resting-state functional networks
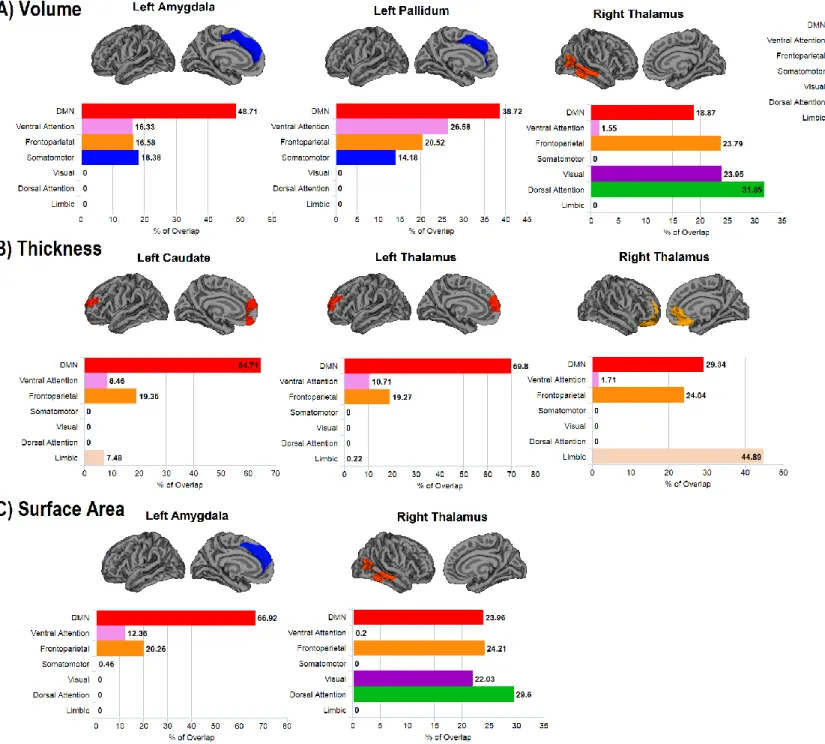
The clusters showing Aβ-associated morphological changes overlapped considerably with the regions of the DMN (Fig 3): in average, 49% of the clusters with morphological changes associated with Aβ overlapped with regions of the DMN, with the highest overlap being found in the anterior medial prefrontal cortex (70%) and the lowest in the posterior temporal cortex (19%). Ventromedial clusters overlapped with the frontoparietal and limbic networks, whereas dorsomedial clusters overlapped more with the frontoparietal, ventral attention, and somatomotor networks. Clusters in the posterior temporal cortex also overlapped on the dorsal attention, frontoparietal, and visual networks.
1.3.2.5. Associations with cognitive performance
Clusters representing an association between subcortical Aβ and morphology were all significantly related to performance in visuospatial abilities (ranging from r=-0.27 to r=0.29) (Table Suppl. 2). Specifically, lower visuospatial performance in subjects was associated with reduced volume and surface area in the frontal and temporal cortices, and with increased thickness in the frontal cortex. Increased volume in the posterior temporal
cortex (related to Aβ in the right thalamus) was associated with lower performance in episodic memory (r=-0.20, p=0.043), whereas decreased surface area (r=0.21, p=0.031) and volume (r=0.21, p=0.036) in the posterior temporal cortex were associated with lower performance in working memory. In contrast, increased Aβ in the left caudate (r=-0.21, p=0.036) and in the left pallidum (r=-0.29, p=0.004) were associated with lower performance in attention. In other words, Aβ was associated with cortical changes, which in turn were associated with cognitive performance.
1.3.3. Mediation analyses
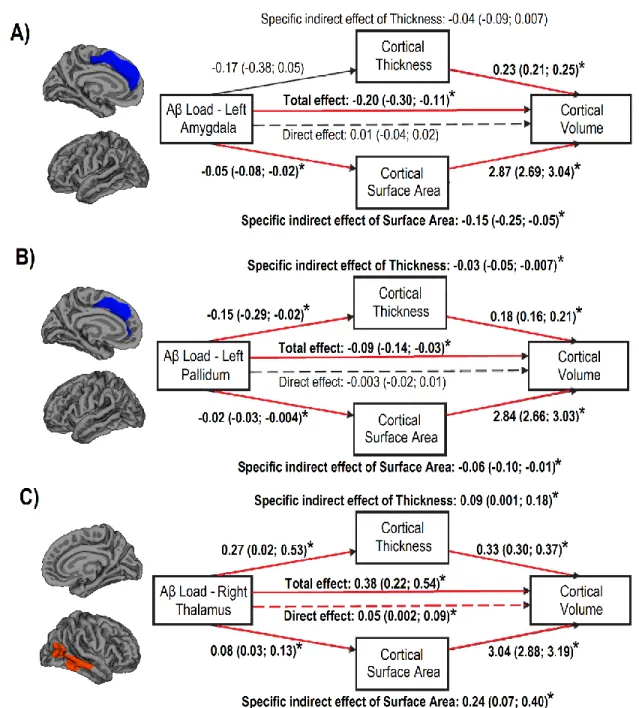
Three mediation analyses were performed to investigate the relative contribution of cortical thickness and surface area to the significant relationship between subcortical PiB retention values and cortical volume. For the left amygdala, the total effect of Aβ load in the structure on the cortical volume in the medial portion of the superior frontal cortex was significant and negative (Fig. 2A). With cortical thickness and surface area entered as mediating factors, the direct effect was no longer significant and the investigation of indirect effects showed that only cortical surface area mediated the influence on cortical volume. For the left pallidum, the effect of Aβ load on cortical volume in the medial portion of the superior frontal cortex was also significant and negative (Fig. 2B). Both cortical thickness and cortical surface area had a significant effect in their mediating influence on volume in the prefrontal cortex. As for the right thalamus, the effect of Aβ load on temporal cortical volume was significant and positive (Fig. 2C). When thickness and surface area were entered as mediating factors, the direct effect of Aβ load on
temporal cortical volume was still significant, as well as the indirect effects of both thickness and surface area on cortical volume.
1.4. DISCUSSION
In this study, we investigated the influence of cortical and subcortical Aβ on cortical morphology in cognitively normal individuals. We found that increasing Aβ burden in the amygdala, pallidum, and thalamus was associated with cortical morphology in the frontal and temporal cortices, particularly in the medial prefrontal cortex and in the posterior temporal cortex. This is in line with evidence of frontal atrophy associated with cortical Aβ in cognitively normal individuals [14, 56, 57]. Indeed, the volume of the superior frontal cortex (i.e., including its medial portion) has been associated with Aβ in cognitively normal individuals, especially in the presence of decreased CSF Aβ, and this region showed among the strongest volume deformation over a one-year period [14]. It also concurs with the first sites of Aβ deposition reported in non-demented subjects with early signs of Aβ accumulation, with other regions reported being the posterior cingulate cortex and precuneus [6]. These regions represent the core regions of the DMN, which is involved in introspective processes and whose activity deactivates during an externally driven attention-demanding task [58]. We showed that the clusters in which morphological changes correlated with subcortical Aβ overlapped considerably with the DMN and with the frontoparietal network, which shares important internetwork coupling with the DMN [59]. This is in line with evidence of altered DMN functioning in cognitively normal individuals with higher PiB level retention [8, 9]. Indeed, it is related to decreased activity in the ventromedial prefrontal cortex and to increased activity in the
dorsal and anterior medial prefrontal cortex [8], which corresponds well with our findings of increased ventromedial thickness and thinning in the more dorsal medial prefrontal areas. The default mode, frontoparietal, and dorsal attention networks share extensive connectional patterns and are involved in introspective processes and visuospatial perceptual attention [59]. In line with this, we found that morphological changes were always associated with lower visuospatial performance in subjects. Interestingly, even increases in frontal and temporal cortical thickness and volume were related to lower performance in visuospatial and episodic memory performance. This suggests that thickening may not act as a compensatory mechanism and may rather represent a deleterious mechanism affecting cognition, i.e., the changes could be the result of maladaptive plasticity [60]. In contrast, increased cortical volume in the posterior temporal cortex related to better visuospatial and working memory performance, suggesting that this change may be an example of compensatory mechanism in cognitively normal individuals. In terms of clinical impact, this means that lower visuospatial performance observed in a subject who is otherwise healthy may be the result of brain changes taking place in association with subcortical Aβ, itself shown to be associated with worse clinical outcome [25-28]. In contrast, the relationships of morphology with episodic memory and working memory, although significant, were only related to Aβ in the thalamus and to the temporal cortex, which may therefore be less representative of a more general brain reorganization.
We found that subcortical Aβ load, particularly in the left amygdala, caudate, pallidum, and thalamus, were associated with morphological changes in the ventromedial prefrontal
cortex and in the dorsomedial prefrontal cortex. In contrast, cortical Aβ did not reveal any morphological changes in the cortex, or at least the use of PiB-PET imaging did not allow identifying an association between cortical Aβ and cortical changes. It concurs with the findings that increased Aβ levels in subcortical nuclei predicted worse clinical outcomes, steeper cognitive decline, anxiety symptoms, and structural abnormalities such as greater hippocampal atrophy [25-27, 61]. We did not find that Aβ in the hippocampus was associated with cortical changes. This is in line with previous evidence of a network based on Aβ deposition, in which the strong relationship between Aβ in the hippocampus and the medial orbitofrontal cortex was actually mediated by the amygdala [62], which was associated with cortical morphology in our study. We also showed that subcortical Aβ levels were not associated with performance in visuospatial abilities, episodic memory, and working memory, which are the three cognitive domains that were associated with Aβ-related cortical changes. In other words, we found that subcortical Aβ levels were related to cortical changes, which in turn were associated with cognitive performance.
We found that increased thalamic Aβ was associated with increased volume in the posterior temporal cortex. This concurs with increased temporal volume in cognitively normal individuals in association with increased cortical Aβ [15]. Cortical thickening is also found in cognitively normal (asymptomatic) individuals with autosomal dominant AD [63]. In this study, in contrast to the prefrontal clusters that correlated with subcortical Aβ, the posterior temporal cortex clusters showed more heterogeneity in their overlap on the resting-state functional networks, comprising regions involved in the
dorsal attention, frontoparietal, and default-mode networks. These three large-scale systems are extensively interconnected [64]; therefore, unlike prefrontal clusters, the increase in temporal metrics may be the result of complex functional changes in several networks. In particular, the dorsal attention network, which does not rely on the medial prefrontal cortex [52], is involved in orienting of attention based on goals and expectations and supports many cognitive functions such as episodic memory encoding and working memory [65]. This concurs with changes in the posterior temporal cortex being associated with performance in episodic memory in our study. In contrast, we did not find associations with performance in executive functions, language, and processing speed, which may be due to these functions being typically associated with regions in which we did not find a relationship with subcortical Aβ (i.e., dorsal regions of the lateral prefrontal cortex, anterior cingulate cortex, parietal cortex, anterior temporal lobe, white matter structure) [66-68]. As for the lack of correlation with attention, this might be related to the tasks part of the composite score, which mostly assessed sustained attention. Therefore, it could be that the brain regions associated with subcortical Aβ influence attentional selectivity more than sustained attention, which would concur with the overlap with frontoparietal and dorsal attention networks. Since clusters of cortical morphology overlapped on distributed resting-state networks and were found exclusively when studying subcortical Aβ, it suggests that Aβ deposition may borrow the structural constraints of intrinsic connectivity networks as proposed by network-spread hypotheses [69].
Cortical surface area is thought to refer to the number of columns formed during ontogeny and thickness to the number of cells within these cortical columns [70]. Cortical surface area and thickness are influenced by distinct genetic determinants and differentially affected in aging [18, 23]. Cortical volume, the product of these two measurements [16], therefore combines the effects of surface area and thickness. In this study, we found that the associations between volume morphology and subcortical Aβ were driven by surface area or by the simultaneous effect of surface area and thickness but never by thickness alone. In other words, surface area drives volume changes and thickness may also contribute independently to these volume changes. This suggests that these metrics deserve separate investigation when studying volume, and that the study of thickness alone may not reveal the whole picture of the morphological changes taking place in the cortex. Interestingly, with regard to the increased temporal cortical volume associated with thalamic Aβ, the direct effect of Aβ remained significant even when taking into account both thickness and surface area, suggesting the role of another structural metric in the change in temporal volume. This metric is likely to have a relatively small effect (coefficient: 0.002-0.09) and may correspond to changes in local gyrification, which has also been found to have an independent effect on grey matter volume alongside thickness and surface area [48]. That volume morphology relates to cortical surface area has interesting implications since specific mutations have been linked to abnormal surface area [71], raising question as to the dynamics underlying Aβ-related changes in cortical organization. It also highlights the importance of not overlooking the measurement of surface area when investigating cortical changes in patients in AD or mild cognitive impairment.
This study had some limitations. First, this study was cross-sectional and did not assess the predictive value of Aβ-related morphological alterations on longitudinal changes in cognitive measures. Moreover, while we investigated the contribution of thickness and surface area to cortical volume, several other structural components may also be involved in forming cortical volume such as the gyrification pattern. Similarly, despite relationships between cortical morphology and cognitive performance, the proportion of explained variance was rather low, suggesting that numerous factors, including other molecular candidates such as tau and neuroinflammatory markers, are likely to explain more variance in cognitively normal individuals. In this study, unlike cortical Aβ, Aβ accumulated in subcortical structures showed morphological changes in the cortex of cognitively normal individuals, particularly in regions composing the DMN, and that these changes were associated with lower cognitive performance.
COMPLIANCE WITH ETHICAL STANDARDS
Funding: This work was funded by the Canadian Institutes of Health Research (#MOP123376) and the Institute of Aging (#IA0120269). SJ was supported by a Chercheur boursier senior award from the Fonds de recherche du Québec – Santé (FRQ-S).
Conflict of Interest: Christian Bocti declares investments at IMEKA. None of the other co-authors report having any conflicts of interests.
Ethical approval: All research protocols were reviewed and in accordance with ethical standards. They were approved by the Centre de recherche de l’Institut universitaire de
gériatrie de Montréal, the Montreal Neurological Institute, and the Hospital Research Ethics Boards.
Informed consent: All subjects gave their informed consent prior to their participation in the study.
REFERENCES
1. Thal DR, Rub U, Orantes M, Braak H. Phases of A beta-deposition in the human brain and its relevance for the development of AD. Neurology. 2002;58:1791-800.
2. Murray ME, Lowe VJ, Graff-Radford NR, Liesinger AM, Cannon A, Przybelski SA, et al. Clinicopathologic and 11C-Pittsburgh compound B implications of Thal amyloid phase across the Alzheimer's disease spectrum. Brain. 2015;138:1370-81. doi:10.1093/brain/awv050.
3. Epelbaum S, Genthon R, Cavedo E, Habert MO, Lamari F, Gagliardi G, et al. Preclinical Alzheimer's disease: A systematic review of the cohorts underlying the concept. Alzheimers Dement. 2017;13:454-67. doi:10.1016/j.jalz.2016.12.003.
4. Jack CR, Jr., Knopman DS, Jagust WJ, Shaw LM, Aisen PS, Weiner MW, et al. Hypothetical model of dynamic biomarkers of the Alzheimer's pathological cascade. Lancet Neurol. 2010;9:119-28. doi:10.1016/S1474-4422(09)70299-6.
5. Braak H, Braak E. Neuropathological stageing of Alzheimer-related changes. Acta Neuropathol. 1991;82:239-59.
6. Palmqvist S, Mattsson N, Hansson O, Alzheimer's Disease Neuroimaging I. Cerebrospinal fluid analysis detects cerebral amyloid-beta accumulation earlier than positron emission tomography. Brain. 2016;139:1226-36. doi:10.1093/brain/aww015. 7. Greicius MD, Srivastava G, Reiss AL, Menon V. Default-mode network activity distinguishes Alzheimer's disease from healthy aging: evidence from functional MRI. Proc Natl Acad Sci U S A. 2004;101:4637-42. doi:10.1073/pnas.0308627101.
8. Mormino EC, Smiljic A, Hayenga AO, Onami SH, Greicius MD, Rabinovici GD, et al. Relationships between beta-amyloid and functional connectivity in different components of the default mode network in aging. Cereb Cortex. 2011;21:2399-407. doi:10.1093/cercor/bhr025.
9. Sperling RA, Laviolette PS, O'Keefe K, O'Brien J, Rentz DM, Pihlajamaki M, et al. Amyloid deposition is associated with impaired default network function in older persons without dementia. Neuron. 2009;63:178-88. doi:10.1016/j.neuron.2009.07.003. 10. de Flores R, La Joie R, Chetelat G. Structural imaging of hippocampal subfields in healthy aging and Alzheimer's disease. Neuroscience. 2015;309:29-50. doi:10.1016/j.neuroscience.2015.08.033.
11. Storandt M, Mintun MA, Head D, Morris JC. Cognitive decline and brain volume loss as signatures of cerebral amyloid-beta peptide deposition identified with Pittsburgh compound B: cognitive decline associated with Abeta deposition. Arch Neurol. 2009;66:1476-81. doi:10.1001/archneurol.2009.272.
12. Fagan AM, Head D, Shah AR, Marcus D, Mintun M, Morris JC, et al. Decreased cerebrospinal fluid Abeta(42) correlates with brain atrophy in cognitively normal elderly. Ann Neurol. 2009;65:176-83. doi:10.1002/ana.21559.
13. Dore V, Villemagne VL, Bourgeat P, Fripp J, Acosta O, Chetelat G, et al. Cross-sectional and longitudinal analysis of the relationship between Abeta deposition, cortical
thickness, and memory in cognitively unimpaired individuals and in Alzheimer disease. JAMA Neurol. 2013;70:903-11. doi:10.1001/jamaneurol.2013.1062.
14. Fjell AM, Walhovd KB, Fennema-Notestine C, McEvoy LK, Hagler DJ, Holland D, et al. Brain atrophy in healthy aging is related to CSF levels of Abeta1-42. Cereb Cortex. 2010;20:2069-79. doi:10.1093/cercor/bhp279.
15. Chetelat G, Villemagne VL, Pike KE, Baron JC, Bourgeat P, Jones G, et al. Larger temporal volume in elderly with high versus low beta-amyloid deposition. Brain. 2010;133:3349-58. doi:10.1093/brain/awq187.
16. Winkler AM, Greve DN, Bjuland KJ, Nichols TE, Sabuncu MR, Ha Berg AK, et al. Joint Analysis of Cortical Area and Thickness as a Replacement for the Analysis of the Volume of the Cerebral Cortex. Cereb Cortex. 2018;28:738-49. doi:10.1093/cercor/bhx308.
17. Winkler AM, Kochunov P, Blangero J, Almasy L, Zilles K, Fox PT, et al. Cortical thickness or grey matter volume? The importance of selecting the phenotype for imaging genetics studies. Neuroimage. 2010;53:1135-46. doi:10.1016/j.neuroimage.2009.12.028. 18. Panizzon MS, Fennema-Notestine C, Eyler LT, Jernigan TL, Prom-Wormley E, Neale M, et al. Distinct genetic influences on cortical surface area and cortical thickness. Cereb Cortex. 2009;19:2728-35. doi:10.1093/cercor/bhp026.
19. Becker JA, Hedden T, Carmasin J, Maye J, Rentz DM, Putcha D, et al. Amyloid-beta associated cortical thinning in clinically normal elderly. Ann Neurol. 2011;69:1032-42. doi:10.1002/ana.22333.
20. Dickerson BC, Bakkour A, Salat DH, Feczko E, Pacheco J, Greve DN, et al. The cortical signature of Alzheimer's disease: regionally specific cortical thinning relates to symptom severity in very mild to mild AD dementia and is detectable in asymptomatic amyloid-positive individuals. Cereb Cortex. 2009;19:497-510. doi:10.1093/cercor/bhn113.
21. Knopman DS, Lundt ES, Therneau TM, Vemuri P, Lowe VJ, Kantarci K, et al. Joint associations of beta-amyloidosis and cortical thickness with cognition. Neurobiol Aging. 2018;65:121-31. doi:10.1016/j.neurobiolaging.2018.01.017.
22. Whitwell JL, Tosakulwong N, Weigand SD, Senjem ML, Lowe VJ, Gunter JL, et al. Does amyloid deposition produce a specific atrophic signature in cognitively normal subjects? Neuroimage Clin. 2013;2:249-57. doi:10.1016/j.nicl.2013.01.006.
23. Dickerson BC, Feczko E, Augustinack JC, Pacheco J, Morris JC, Fischl B, et al. Differential effects of aging and Alzheimer's disease on medial temporal lobe cortical thickness and surface area. Neurobiol Aging. 2009;30:432-40. doi:10.1016/j.neurobiolaging.2007.07.022.
24. Villeneuve S, Rabinovici GD, Cohn-Sheehy BI, Madison C, Ayakta N, Ghosh PM, et al. Existing Pittsburgh Compound-B positron emission tomography thresholds are too high: statistical and pathological evaluation. Brain. 2015;138:2020-33. doi:10.1093/brain/awv112.
25. Cho SH, Shin JH, Jang H, Park S, Kim HJ, Kim SE, et al. Amyloid involvement in subcortical regions predicts cognitive decline. Eur J Nucl Med Mol Imaging. 2018. doi:10.1007/s00259-018-4081-5.
26. Hanseeuw BJ, Betensky RA, Mormino EC, Schultz AP, Sepulcre J, Becker JA, et al. PET staging of amyloidosis using striatum. Alzheimers Dement. 2018. doi:10.1016/j.jalz.2018.04.011.
27. Hanseeuw BJ, Jonas V, Jackson J, Betensky RA, Rentz DM, Johnson KA, et al. Association of anxiety with subcortical amyloidosis in cognitively normal older adults. Mol Psychiatry. 2018. doi:10.1038/s41380-018-0214-2.
28. Rahayel S, Bocti C, Sevigny Dupont P, Joannette M, Lavallee MM, Nikelski J, et al. Subcortical amyloid load is associated with shape and volume in cognitively normal individuals. Hum Brain Mapp. 2019. doi:10.1002/hbm.24680.
29. Ad-Dab'bagh Y, Lyttelton O, Muehlboeck JS, Lepage C, Einarson D, Mok K, et al. The CIVET image-processing environment: A fully automated comprehensive pipeline for anatomical neuroimaging research. In: Corbetta M, editor. Proceedings of the 12th Annual Meeting of the Organization for Human Brain Mapping; 2006.
30. Nikelski J, Chertkow H, Evans A. Running with the Beagle: A Multi-Modal, Integrative Imaging Pipeline Specialized for the Processing of Elderly Brains. Human Amyloid Imaging Conference; 2012. p. 80.
31. Klunk WE, Engler H, Nordberg A, Wang Y, Blomqvist G, Holt DP, et al. Imaging brain amyloid in Alzheimer's disease with Pittsburgh Compound-B. Ann Neurol. 2004;55:306-19. doi:10.1002/ana.20009.
32. Tzourio-Mazoyer N, Landeau B, Papathanassiou D, Crivello F, Etard O, Delcroix N, et al. Automated anatomical labeling of activations in SPM using a macroscopic anatomical parcellation of the MNI MRI single-subject brain. Neuroimage. 2002;15:273-89. doi:10.1006/nimg.2001.0978.
33. Reuter M, Schmansky NJ, Rosas HD, Fischl B. Within-subject template estimation for unbiased longitudinal image analysis. Neuroimage. 2012;61:1402-18. doi:10.1016/j.neuroimage.2012.02.084.
34. Dale AM, Fischl B, Sereno MI. Cortical surface-based analysis. I. Segmentation and surface reconstruction. Neuroimage. 1999;9:179-94. doi:10.1006/nimg.1998.0395. 35. Reuter M, Rosas HD, Fischl B. Highly accurate inverse consistent registration: a robust approach. Neuroimage. 2010;53:1181-96. doi:10.1016/j.neuroimage.2010.07.020. 36. Segonne F, Dale AM, Busa E, Glessner M, Salat D, Hahn HK, et al. A hybrid approach to the skull stripping problem in MRI. Neuroimage. 2004;22:1060-75. doi:10.1016/j.neuroimage.2004.03.032.
37. Fischl B, Salat DH, Busa E, Albert M, Dieterich M, Haselgrove C, et al. Whole brain segmentation: automated labeling of neuroanatomical structures in the human brain. Neuron. 2002;33:341-55.
38. Fischl B, Salat DH, van der Kouwe AJ, Makris N, Segonne F, Quinn BT, et al. Sequence-independent segmentation of magnetic resonance images. Neuroimage. 2004;23 Suppl 1:S69-84. doi:10.1016/j.neuroimage.2004.07.016.
39. Sled JG, Zijdenbos AP, Evans AC. A nonparametric method for automatic correction of intensity nonuniformity in MRI data. IEEE Trans Med Imaging. 1998;17:87-97. doi:10.1109/42.668698.
40. Fischl B, Liu A, Dale AM. Automated manifold surgery: constructing geometrically accurate and topologically correct models of the human cerebral cortex. IEEE Trans Med Imaging. 2001;20:70-80. doi:10.1109/42.906426.
41. Segonne F, Pacheco J, Fischl B. Geometrically accurate topology-correction of cortical surfaces using nonseparating loops. IEEE Trans Med Imaging. 2007;26:518-29. doi:10.1109/TMI.2006.887364.
42. Fischl B, Dale AM. Measuring the thickness of the human cerebral cortex from magnetic resonance images. Proc Natl Acad Sci U S A. 2000;97:11050-5. doi:10.1073/pnas.200033797.
43. Dale AM, Sereno MI. Improved Localizadon of Cortical Activity by Combining EEG and MEG with MRI Cortical Surface Reconstruction: A Linear Approach. J Cogn Neurosci. 1993;5:162-76. doi:10.1162/jocn.1993.5.2.162.
44. Fischl B, Sereno MI, Dale AM. Cortical surface-based analysis. II: Inflation, flattening, and a surface-based coordinate system. Neuroimage. 1999;9:195-207. doi:10.1006/nimg.1998.0396.
45. Fischl B, Sereno MI, Tootell RB, Dale AM. High-resolution intersubject averaging and a coordinate system for the cortical surface. Hum Brain Mapp. 1999;8:272-84.
46. Fischl B, van der Kouwe A, Destrieux C, Halgren E, Segonne F, Salat DH, et al. Automatically parcellating the human cerebral cortex. Cereb Cortex. 2004;14:11-22. 47. Desikan RS, Segonne F, Fischl B, Quinn BT, Dickerson BC, Blacker D, et al. An automated labeling system for subdividing the human cerebral cortex on MRI scans into gyral based regions of interest. Neuroimage. 2006;31:968-80. doi:10.1016/j.neuroimage.2006.01.021.
48. Rosas HD, Liu AK, Hersch S, Glessner M, Ferrante RJ, Salat DH, et al. Regional and progressive thinning of the cortical ribbon in Huntington's disease. Neurology. 2002;58:695-701.
49. Kuperberg GR, Broome MR, McGuire PK, David AS, Eddy M, Ozawa F, et al. Regionally localized thinning of the cerebral cortex in schizophrenia. Arch Gen Psychiatry. 2003;60:878-88. doi:10.1001/archpsyc.60.9.878.
50. Salat DH, Buckner RL, Snyder AZ, Greve DN, Desikan RS, Busa E, et al. Thinning of the cerebral cortex in aging. Cereb Cortex. 2004;14:721-30. doi:10.1093/cercor/bhh032.
51. Im K, Lee JM, Lyttelton O, Kim SH, Evans AC, Kim SI. Brain size and cortical structure in the adult human brain. Cereb Cortex. 2008;18:2181-91. doi:10.1093/cercor/bhm244.
52. Yeo BT, Krienen FM, Sepulcre J, Sabuncu MR, Lashkari D, Hollinshead M, et al. The organization of the human cerebral cortex estimated by intrinsic functional connectivity. J Neurophysiol. 2011;106:1125-65. doi:10.1152/jn.00338.2011.
53. Hayes AF. Introduction to mediation, moderation, and conditional process analysis : a regression-based approach. New York: The Guilford Press; 2013.
54. Winkler AM, Ridgway GR, Webster MA, Smith SM, Nichols TE. Permutation inference for the general linear model. Neuroimage. 2014;92:381-97. doi:10.1016/j.neuroimage.2014.01.060.
55. Williams J, Mackinnon DP. Resampling and Distribution of the Product Methods for Testing Indirect Effects in Complex Models. Struct Equ Modeling. 2008;15:23-51. doi:10.1080/10705510701758166.
56. Tosun D, Schuff N, Truran-Sacrey D, Shaw LM, Trojanowski JQ, Aisen P, et al. Relations between brain tissue loss, CSF biomarkers, and the ApoE genetic profile: a longitudinal MRI study. Neurobiol Aging. 2010;31:1340-54. doi:10.1016/j.neurobiolaging.2010.04.030.
57. Arenaza-Urquijo EM, Molinuevo JL, Sala-Llonch R, Sole-Padulles C, Balasa M, Bosch B, et al. Cognitive reserve proxies relate to gray matter loss in cognitively healthy elderly with abnormal cerebrospinal fluid amyloid-beta levels. J Alzheimers Dis. 2013;35:715-26. doi:10.3233/JAD-121906.
58. Raichle ME. The brain's default mode network. Annu Rev Neurosci. 2015;38:433-47. doi:10.1146/annurev-neuro-071013-014030.
59. Dixon ML, De La Vega A, Mills C, Andrews-Hanna J, Spreng RN, Cole MW, et al. Heterogeneity within the frontoparietal control network and its relationship to the default and dorsal attention networks. Proc Natl Acad Sci U S A. 2018;115:E1598-E607. doi:10.1073/pnas.1715766115.
60. Nava E, Roder B. Adaptation and maladaptation insights from brain plasticity. Prog Brain Res. 2011;191:177-94. doi:10.1016/B978-0-444-53752-2.00005-9.
61. Beach TG, Sue LI, Walker DG, Sabbagh MN, Serrano G, Dugger BN, et al. Striatal amyloid plaque density predicts Braak neurofibrillary stage and clinicopathological Alzheimer's disease: implications for amyloid imaging. J Alzheimers Dis. 2012;28:869-76. doi:10.3233/JAD-2011-111340.
62. Sepulcre J, Sabuncu MR, Becker A, Sperling R, Johnson KA. In vivo characterization of the early states of the amyloid-beta network. Brain. 2013;136:2239-52. doi:10.1093/brain/awt146.
63. Fortea J, Sala-Llonch R, Bartres-Faz D, Bosch B, Llado A, Bargallo N, et al. Increased cortical thickness and caudate volume precede atrophy in PSEN1 mutation carriers. J Alzheimers Dis. 2010;22:909-22. doi:10.3233/JAD-2010-100678.
64. Spreng RN, Sepulcre J, Turner GR, Stevens WD, Schacter DL. Intrinsic architecture underlying the relations among the default, dorsal attention, and frontoparietal control networks of the human brain. J Cogn Neurosci. 2013;25:74-86. doi:10.1162/jocn_a_00281.
65. Sestieri C, Shulman GL, Corbetta M. The contribution of the human posterior parietal cortex to episodic memory. Nat Rev Neurosci. 2017;18:183-92. doi:10.1038/nrn.2017.6.
66. Breukelaar IA, Antees C, Grieve SM, Foster SL, Gomes L, Williams LM, et al. Cognitive control network anatomy correlates with neurocognitive behavior: A longitudinal study. Hum Brain Mapp. 2017;38:631-43. doi:10.1002/hbm.23401.
67. Friederici AD, Gierhan SM. The language network. Curr Opin Neurobiol. 2013;23:250-4. doi:10.1016/j.conb.2012.10.002.
68. Kuznetsova KA, Maniega SM, Ritchie SJ, Cox SR, Storkey AJ, Starr JM, et al. Brain white matter structure and information processing speed in healthy older age. Brain Struct Funct. 2016;221:3223-35. doi:10.1007/s00429-015-1097-5.
69. Seeley WW, Crawford RK, Zhou J, Miller BL, Greicius MD. Neurodegenerative diseases target large-scale human brain networks. Neuron. 2009;62:42-52. doi:10.1016/j.neuron.2009.03.024.
70. Rakic P. Radial unit hypothesis of neocortical expansion. Novartis Found Symp. 2000;228:30-42; discussion -52.
71. Palaniyappan L, Liddle PF. Differential effects of surface area, gyrification and cortical thickness on voxel based morphometric deficits in schizophrenia. Neuroimage. 2012;60:693-9. doi:10.1016/j.neuroimage.2011.12.058.
FIGURE LEGENDS
Figure 1. Associations between Aβ load in subcortical structures and cortical volume, thickness, and surface area.
Associations between subcortical Aβ load in subcortical structures and cortical volume (A), thickness (B), and surface area (C) in cognitively normal individuals. The colour bar indicates the logarithmic scale of p values (-log 10) for between-group differences, with blue areas representing negative relationships and red-yellow areas representing positive relationships (corrected with Monte Carlo simulations at p<0.05).
Figure 2. Mediation analyses of the relationships between subcortical Aβ load and cortical volume.
Mediation models of the associations between subcortical Aβ load and cortical volume through cortical thickness and cortical surface area. Mediation models indicate the regression coefficients with bootstrap 95% confidence intervals, with significant
relationships indicated with an asterisk and as red lines when confidence intervals did not cross zero. Age, sex, and education were entered as covariates.
Figure 3. Overlap between the clusters of cortical morphology associated with subcortical Aβ load and resting-state functional networks.
Overlap between the clusters where cortical volume (A), thickness (B), and surface area (C) is associated with subcortical Aβ in cognitively normal individuals and 7 resting-state functional networks [52]. The x axis represents the percentage of overlap of the cluster
with each one of the resting-state networks. Note that the range differs between the y axes for each cluster.
TABLES
Table 1. Demographic, clinical, and PET characteristics of participants
Variable Participants (n=103) Demographics Age, years 73.4 (6.2) Men, n (%) 26 (25%) Education, years 13.7 (3.2) GDS, /30 3.1 (2.6) MoCA score, /30 27.3 (2.0)
PiB retention values
Global SUVR – All cortical and subcortical regions 1.25 (0.17) Cortical SUVR – All cortical regions 1.24 (0.18)
Cortical SUVR – AD-prone regionsa 1.24 (0.23)
Left hippocampus, mean RV 1.43 (0.10)
Right hippocampus, mean RV 1.41 (0.09)
Left amygdala, mean RV 1.45 (0.12)
Right amygdala, mean RV 1.34 (0.11)
Left caudate, mean RV 1.25 (0.16)
Right caudate, mean RV 1.28 (0.14)
Left putamen, mean RV 1.53 (0.18)
Right putamen, mean RV 1.55 (0.19)
Right pallidum, mean RV 1.68 (0.16)
Left thalamus, mean RV 1.24 (0.12)
Right thalamus, mean RV 1.23 (0.10)
Data are presented as mean (SD).
a
Defined as the area-weighted average of mean ratio values derived from the frontal, temporal, parietal, and posterior cingulate cortex (i.e., cortical regions highly associated with PiB retention in AD and normal aging) [24].
AD = Alzheimer’s disease; GDS = Geriatric Depression Scale; MoCA = Montreal Cognitive Assessment; PiB = Pittsburgh Compound B; RV = ratio value; SUVR = standardized uptake value ratio.