HAL Id: hal-02966561
https://hal.archives-ouvertes.fr/hal-02966561
Submitted on 22 Oct 2020
HAL is a multi-disciplinary open access
archive for the deposit and dissemination of sci-entific research documents, whether they are pub-lished or not. The documents may come from teaching and research institutions in France or abroad, or from public or private research centers.
L’archive ouverte pluridisciplinaire HAL, est destinée au dépôt et à la diffusion de documents scientifiques de niveau recherche, publiés ou non, émanant des établissements d’enseignement et de recherche français ou étrangers, des laboratoires publics ou privés.
Shinsuke Setoshita, Cristian Andrei, Steve Phillips, Habib Haj Salem, Régine
Seidowsky, Mitsuhiro Yao, Kian Keong Chin, Kenny Chen, Yuji Ikeda
To cite this version:
Shinsuke Setoshita, Cristian Andrei, Steve Phillips, Habib Haj Salem, Régine Seidowsky, et al.. Smart Use of Roads, ITF Research reports. [Research Report] IFSTTAR. 2019, 47p. �hal-02966561�
Smart Use of Roads
Corporate Partnership Board
The International Transport Forum is an intergovernmental organisation with 59 member countries. It acts as a think tank for transport policy and organises the Annual Summit of transport ministers. ITF is the only global body that covers all transport modes. The ITF is politically autonomous and administratively integrated with the OECD.
The ITF works for transport policies that improve peoples’ lives. Our mission is to foster a deeper understanding of the role of transport in economic growth, environmental sustainability and social inclusion and to raise the public profile of transport policy.
The ITF organises global dialogue for better transport. We act as a platform for discussion and pre-negotiation of policy issues across all transport modes. We analyse trends, share knowledge and promote exchange among transport decision-makers and civil society. The ITF’s Annual Summit is the world’s largest gathering of transport ministers and the leading global platform for dialogue on transport policy.
The Members of the Forum are: Albania, Armenia, Argentina, Australia, Austria, Azerbaijan, Belarus, Belgium, Bosnia and Herzegovina, Bulgaria, Canada, Chile, China (People’s Republic of), Croatia, Czech Republic, Denmark, Estonia, Finland, France, Georgia, Germany, Greece, Hungary, Iceland, India, Ireland, Israel, Italy, Japan, Kazakhstan, Korea, Latvia, Liechtenstein, Lithuania, Luxembourg, the Republic of North Macedonia, Malta, Mexico, Republic of Moldova, Montenegro, Morocco, the Netherlands, New Zealand, Norway, Poland, Portugal, Romania, Russian Federation, Serbia, Slovak Republic, Slovenia, Spain, Sweden, Switzerland, Turkey, Ukraine, the United Arab Emirates, the United Kingdom and the United States.
International Transport Forum 2 rue André Pascal F-75775 Paris Cedex 16
[email protected] www.itf-oecd.org
ITF Research Reports
ITF Research Reports are in-depth studies of transport policy issues of concern to ITF member
countries. They present the findings of dedicated ITF working groups, which bring together
international experts over a period of usually one to two years, and are vetted by the ITF
Transport Research Committee. Any findings, interpretations and conclusions expressed herein
are those of the authors and do not necessarily reflect the views of the International Transport
Forum or the OECD. Neither the OECD, ITF nor the authors guarantee the accuracy of any data
or other information contained in this publication and accept no responsibility whatsoever for
any consequence of their use. This document and any map included herein are without
prejudice to the status of or sovereignty over any territory, to the delimitation of international
frontiers and boundaries and to the name of any territory, city or area.
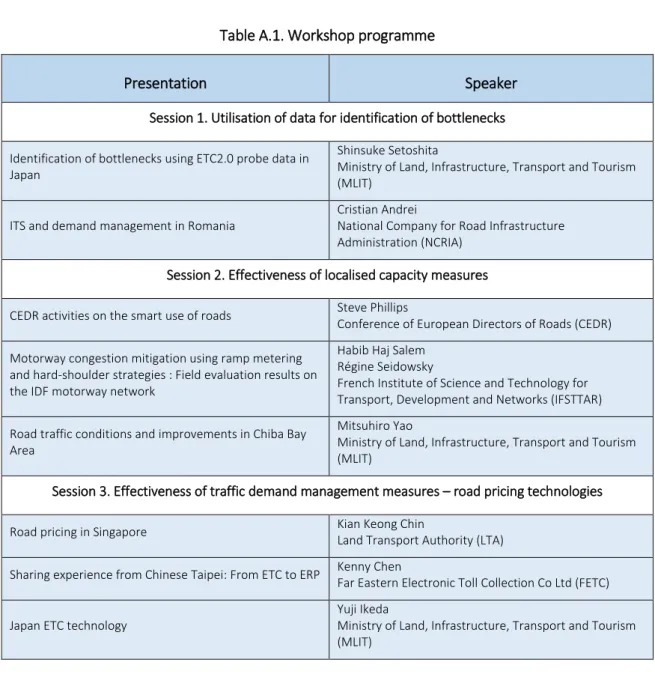
This summary report of the International Transport Forum Working Group on the Smart Use of Roads was prepared by Joanne Leung from the New Zealand Ministry of Transport and Stephen Perkins from the International Transport Forum. It draws on the presentations at a workshop organised by the group and given by Cristian Andrei (Romania), Kenny Chen (Chinese Taipei), Kian Keong Chin (Singapore), Habib Haj-Salem (France), Yuji Ikeda (Japan), Steve Phillips (Centre for Effective Dispute Resolution), Régine Seidowsky (France), Shinsuke Setoshita (Japan) and Mitsuhiro Yao (Japan) and the discussion during the workshop.
Table of contents
Executive summary ... 5
Instruments for optimising use of road capacity ... 8
Technologies for bottleneck detection ... 10
Intelligent Transport Systems and traffic management ... 10
Possible uses of Electronic Toll Collection probe data ... 12
Using mobile network data to monitor network performance... 13
Localised short to medium-term measures for managing traffic ... 16
Hard-shoulder running ... 16
Ramp metering ... 18
Speed harmonisation ... 19
Adaptive signal control system ... 19
Road pricing as a medium to long-term solution for expanding cities ... 21
Road pricing mechanisms ... 21
Managing traffic with road pricing ... 23
Discussion ... 26
Notes ... 28
References ... 29
Annex 1. Summary of the Smart Use of Roads Workshop presentations ... 32
Session 1. Utilisation of data for identification of bottlenecks ... 32
Session 2. Effectiveness of localised capacity measures ... 35
Session 3. Effectiveness of traffic demand management measures: road pricing technologies ... 39
Executive summary
What we did
This report examines strategies and technologies applied to better utilise existing road networks. It has long been recognised that capacity expansion through the construction of new roads alone is not an efficient approach to meeting peak demand, especially in cities with a well-developed road network. This approach to congestion is often unsustainable because pent up demand quickly fills up new road space and congestion will return.
The report summarises the findings of a workshop on alternative responses to congestion organised by the ITF’s Working Group on the Smart Use of Roads. The Workshop brought together 39 experts and practitioners from 11 countries in Tokyo in October 2018. Participants discussed the use of real-time data to identify congestion bottlenecks and to provide dynamic route guidance to travellers and reviewed localised infrastructure measures to relieve congestion in the short to medium term. The Workshop also examined the way in which road tolls have been modified to relieve congestion on the expressway networks of Tokyo and Chinese Taipei and the evolution of Singapore’s road pricing system to maintain its effectiveness in managing demand.
What we found
Making smarter use of roads is increasingly the focus of investment in trunk road networks and their management. This involves investment in information and communications technology, and the use of a mixture of localised and network measures, to optimise use of the network and maximise flow on existing roads rather than simply adding capacity. The strategy is a response to the unsustainable costs of unlimited expansion and the difficulties of expansion in densely built up areas. More fundamentally it responds to the failure of strategies based on expansion of capacity to manage congestion in cities with a well-developed network, with expansion generating additional demand and driving mobility to be more and more car-dependent.
There are three broad categories of real-time traffic information. Those collected from Intelligent Transport Systems (ITS) such as systems with roadside sensors, Electronic Toll Collection (ETC) systems and mobile communications networks. Data from ETC systems combined with traffic counts can be a useful substitute for ITS data, particularly when the on-board units (OBUs) record probe data on driving behaviour (such as braking and acceleration) and trip patterns (origin, destination, parked time). Combined, this can provide information on trip purpose. Mobile phone network data can provide similar if less complete data to that obtained from ITS systems, but with a wider geographical coverage and can contribute to assessment of traffic volumes to make projections of network performance.
Past experience shows that investment in ITS smart motorway technologies can achieve better value for money than network expansion. But such investment can be costly and therefore ITS infrastructure is likely to be installed mainly on selected strategic corridors. Mobile network data can be a valuable supplement to ITS and ETC data, but its use is still at an early stage and business-to-government data sharing is not common.
A number of investments that cost less than adding lanes to motorways can relieve congestion, with much higher benefit-cost ratios (BCRs) than network expansion. These include adapting hard-shoulders
(safety lanes) to take peak hour traffic, controlling access to express ways through ramp metering and variable speed limits and speed calming devices to smooth and increase traffic flow. The latter include pulsing banks of LED strips providing a visual signal that acts to synchronise and adjust vehicle speeds. The safety implications of hard-shoulder running are addressed by lowering variable speed limits when in use and Variable Message Sign (VMS) posting to evacuate lanes in case of emergency. In practice hard-shoulder running is found to reduce both safety risk and travel time and improve journey time reliability. Tolls on tolled roads can be adjusted to steer traffic away from congested sections of the network. This has been done very successfully in Tokyo, following completion of its trunk ring roads. What were largely distance-based tolls were modified in 2016 to equalise charges for crossing the city through the centre or via the ring roads. This resulted in a large shift of traffic to the ring roads, cutting congestion sharply. Tolls on the national expressway network in Chinese Taipei have been rationalised and modified to begin to steer demand away from congested locations and periods.
The biggest reduction in congestion with the modification of Chinese Taipei’s motorway tolls has been achieved by removing toll plazas. Manual fee collection has been replaced entirely with drive-through ETC technology after a phase-in period to allow for reassignment of labour. Other tolled motorway systems should replicate this experience.
Congestion is most successfully addressed by a complete set of tools for managing traffic demand and integrating transport and land use planning. Singapore has developed the most comprehensive policies. These include joint planning of transport - infrastructure investment and public transport services - with land-use change and property development, together with a full suite of measures to manage car ownership and use. The tools include auctioning of permits to buy cars that limits car ownership as well charges on the use of cars - fuel taxes, parking charges and road pricing. Tokyo uses a similarly broad set of demand management instruments to cut congestion to current low levels. For example, car ownership is limited by the requirement to own or lease off-street parking space before purchase and urban expressways are tolled, with congestion-based tolling being considered for the future. At the same time, the expressway network is being expanded, including development of ring routes around urban area, to complete Tokyo’s basic road network.
What we recommend
Make use of smart technologies part of the response to congestion
Intelligent Transport Systems (ITS) use information and communication technologies to enable users to be better informed and make more coordinated and smarter use of transport networks. Investment in ITS provides better value for money than network capacity expansion in some circumstances and should be considered as part of strategies to address congestion. For cities with existing tolling systems, upgrading tolling technologies can reduce congestion at charging points by eliminating the need for motorists to stop for payment. Modifying existing tolling systems to manage congestion at specific locations and time of day is a particularly cost-effective option.
Invest in improving junctions where these create bottlenecks
In general, one of the major causes of congestions on motorways is reduced traffic flow around interchanges and ramps where lanes merge and diverge. Experience in Tokyo demonstrates that localised investment to improve road geometry and expand capacity at these points can be very successful in eliminating congestion on the network, at least where overall traffic demand is constrained by tolls.
Use hard-shoulder running and ramp metering to get the most out of trunk road capacity
A range of effective, active traffic demand management measures, such as hard-shoulder running, ramp metering, and speed harmonisation, have been used in many place with proven results. These measures provide better value for money than network expansion, at least in the medium-term.
Use congestion pricing for active traffic management as part of integrated urban policies
Charging for the use of roads with prices differentiated by route, location, time of day and day of the week has proven to be effective in changing behaviour and limiting congestion, notably in Singapore. Demand-responsive road pricing is the most efficient way of balancing supply and demand for road use in the long-term. In cities it works best as part of a comprehensive set of measures to manage car ownership and use and integrate land-use and transport planning. Without road pricing and/or instruments that price the impact of consuming road and parking space into the cost of owning a car, it is congestion itself that regulates demand.
Adopt barrier-free electronic tolling to remove bottlenecks
Even simple forms of congestion pricing, without time and distance-based differentiated pricing, can be effective in managing demand, as London’s Congestion Charge demonstrates. A range of technologies can be used for barrier-free toll collection and enforcement and experience in Chinese Taipei and Singapore shows how simple systems can evolve over time to incorporate technological innovation for more effective traffic management. Replacing manual fee collection with barrier-free systems should be a priority for removing congestion bottlenecks. Whatever system is selected, the focus should first and foremost be on ensuring the basic toll collection and enforcement function is operational before incorporating other functions.
Instruments for optimising use of road capacity
It has long been recognised that building the way out is not always an efficient or desirable solution for meeting growing road transport demand (Goodwin, 1999). In congested cities with a well-developed road network, adding road capacity induces further demand. Without demand management measures to either price the use of scarce space or restrict car ownership, congestion will always clog the road network. Congestion as a result of excessive transport demand results both in delays and unreliable journey times. A Working Group on Improving Reliability on Surface Transport Networks held by the International Transport Forum (ITF, 2009) identified four instruments to optimise congestion on transport networks:• better the management of existing capacity using proactive network oversight and better incident management
• charge directly for road use to improve efficiency and the level of reliability where feasible • provide information to users that enable them to mitigate the adverse effects of poor reliability
by altering their travel plans and schedules
• increase the physical capacity of infrastructure, either through supplying extra capacity or improving the quality of existing capacity, based on appropriate network standards and the level of use.
The first three instruments are the topics of interest in this report. These instruments focus on finding ways to utilise existing capacity, where possible and appropriate. To do so effectively, it is necessary to obtain a clear picture of what the capacity constraints are so that targeted measures can be applied at the right time and location. In this digital era with an ever-growing source of information about users and their travel patterns, technologies have been and are being developed to provide the information infrastructure providers, operators and users need to make informed decisions.
The application of strategies and policies to reduce travel demand is commonly used to reduce such travel demand, or to redistribute this demand in time or location. In addition to the interventions to increase walking and cycling, ride-sharing and public transport use, it is also necessary to improve space utilisation in areas with capacity constraints. Active traffic management measures are then called for to dynamically manage traffic flow based on prevailing traffic conditions observed through the use of real-time data. Examples of measures that have been automated with technologies include hard-shoulder running, speed harmonisation, ramp metering, queue warning, and a combination of these.
The objectives of the Workshop were to review:
• methods to identify locations of bottleneck using data collected from electronic devices (such as smartphones, in-vehicle navigation systems and data collected from integrated tolling systems) • the relative effectiveness of localised capacity measures (such as hard-shoulder running) to
relieve bottleneck congestion
• the relative effectiveness and efficiency of long-term measures (such as road pricing) to redistribute traffic over time and/or space.
In brief, the Workshop sought to discuss how best to identify bottleneck locations using data collected from Intelligent Transport Systems (ITS), Electronic Toll Collection (ETC) systems and mobile networks; to
manage them with short- to medium-term measures at local levels and to influence traffic behaviours with a combination of long-term measures at the network level.
This report compliments the Social Impacts of Road Pricing Roundtable Summary and Conclusions Report (Number 170) but with a focus on road pricing technologies and uses road pricing as part of the integrated solutions to traffic demand management. It also looks at how technological developments have improved the efficiency and effectiveness of road pricing schemes; what and how information can be collected during scheme operation and how big data and information collected during scheme operation could be utilised to inform pricing and non-pricing strategies to better manage traffic.
This report is organised as follows. The first section discusses the types of data and technologies that can be used to identify bottlenecks. It is then followed by a discussion on localised short- to medium-term measures. The third section will discuss the long-term measures, including the use of demand-responsive road pricing.
Technologies for bottleneck detection
Access to real-time traffic data and information is one of the pre-requisite requirements for effective management of bottlenecks. The Workshop discussed three major sources of real-time traffic information – data collected from Intelligent Transport Systems (ITS), Electronic Toll Collection (ECT) systems and blue tooth and smart phone data. Each of these sources has its advantages and disadvantages.
Intelligent Transport Systems and traffic management
Advancement in Intelligent Transport Systems (ITS) technologies has made it possible to collect, analyse and disseminate a large amount of traffic information more quickly than ever before. ITS, consists of traffic detection, information, management, control, communications and user interface systems, that monitor traffic and identify bottlenecks and other disruptions as they occur on the road. Once disruption is detected or predicted, an ITS automatically deploys measures to lessen the effects or, in some instances, to prevent the disruption from occurring in the first place.
ITS also plays a key role in enabling collection and transmission of real-time movement data to complement or supplement traditional modelling techniques, which predict behaviours in real-time. Much of the infrastructure for ITS can also be employed in the implementation of demand-responsive road pricing schemes. Technologies evolve very quickly and therefore maintenance of ITS infrastructure can be costly especially when upgrades are required over time to ensure systems continue to be compatible with latest technologies. With careful planning, the high economic, safety and reliability benefits can often justify the cost of the investment, especially when compared to capacity expansion projects. This has already been experienced in some European cities, Romania and the United Kingdom, however, funding and skill shortages are currently two issues that highway authorities face regarding the future development of ITS.
The European experience of Intelligent Transport Systems
National road authorities in Europe are currently coordinating national research and development strategies through the Centre for Effective Dispute Resolution (CEDR) to understand and cope with rapid technological advancements in and uptake of connected vehicles (vehicles with communication capabilities with other vehicles, roadside infrastructure and other users). CEDR has identified that the establishment of a digital road infrastructure (sensors, roadside infrastructure to facilitate vehicle-to-infrastructure communication technologies, cellular technology developments) is important. In addition, it also recommends substantial improvements in back office systems, services and processes to support transmission of large amount of data in real-time. Such advancements include improvements in content delivery between systems and platforms (e.g. cloud-to-cloud to providers of in-vehicle services) and improved frameworks to address IT security and privacy issues.
CEDR expects that continuation of the existing out-dated systems that manage traffic is likely to result in a net cost as benefits will decrease over time while maintenance costs will likely increase in the future. Investment in ITS will involve a high increase in costs in initial years but benefits are also likely to increase
over time with the rising application opportunities as technology continues to develop (Philips, 2018). CEDR estimates that to develop or upgrade a total of 43 000 kilometres of the motorway road networks within CEDR countries it would require an investment over the next ten years of around EUR 10 billion (+/- 20%) into ITS (Philips, 2018). For any project like this that affects multiple jurisdictions, there is always a risk around interoperability if different countries adopt different components at different points in time. A more pressing issue though is to find additional time and resource to continue running existing systems and meeting investment needs for the new system at the same time. Given ITS infrastructure would deliver wider benefits to users (e.g. to autonomous vehicle owners), more work around identification of different funding mechanisms to ensure beneficiaries contribute to the costs of such investment has been called for (Philips, 2018).
The Romanian experience of Intelligent Transport Systems
Rapid development in transport infrastructure is occurring in Romania to support economic growth and movements of people and freight. The Romanian government is planning a 1 766 km expansion of its motorway and expressway network that currently measures 783 km in length. The expansion will provide better connectivity between regions. The expansion costs EUR 47 billion (financed by European Union funds, state budget and public-private partnership) and includes 5%-10% of funds earmarked for ITS infrastructure (Andrei, 2018).
Investment in the ITS infrastructure includes traffic monitoring systems (e.g. cameras, road sensors, Weigh In Motion (WIM) sensors and inductive loop traffic counter), traffic management systems (e.g. electronic messaging signs installed at interchanges); passenger information systems (e.g. weather information collection and dissemination system); law enforcement system (e.g. Automatic Number Plate Recognition) and toll collection system (e.g. back office support). Regional ITS monitoring centres located in Bucharest, Timişoara (Pecica), Brasov (Sǎlişte) and Constanța (Valea Dacilor) have already been built, or near completion, to deliver various traffic information services.
Weather information collected in Romania and integrated into ITS has been successful in providing advance warnings to travellers concerning delays or closures caused by snow storms that might influence their travel plans. Cameras that have been installed every 2 kilometres provide traffic control centres real-time information on traffic delays. They have also helped to detect point-to-point average speed, mainly for measuring throughput and flow as current legislation in Romania does not allow this technology to be used to fine vehicles detected with average speeds higher than the posted limit. The major issue currently experienced by the Romania government regarding ITS infrastructure is the shortage in local technical capability to maintain the systems, a role currently out-sourced to foreign contractors. Skill and capability shortages is a worldwide issue that needs to be addressed, not only in regard to the development and maintenance of the ITS but also in the analysis of the mass amount of real-time data (including merging of different datasets) generated from multiple sources.
The United Kingdom experience of Intelligent Transport Systems
The National Traffic Information Service (NTIS) was set up in the United Kingdom in 2011, replacing the National Traffic Control Centre (NTCC), to help improve the operational effectiveness of Highways England. The NTIS was set up to enable strategic traffic management of the highway network to minimise congestion caused by incidents, road works and events and to provide accurate real-time information to the public to help motorists avoid traffic queues. Information collected from road sensors, radars mounted on lamp posts or gantries and over 3 000 traffic cameras is used to understand network
performance to enable more efficient operations (such as automated incident detection and management) and to measure the effectiveness of interventions (DfT, 2017). By reducing delays and improving reliability and safety, analysis suggests that the NTIS has produced net benefits of more than GBP 370 million eight years on from 2011 (DfT, 2017).
The NTCC and later NTIS both provide a range of technology related services including variable message signs (VMS), DATEX II (a data feed which was transferred between ICT systems without manual intervention) and incident information. The establishment of the NTIS was part of the evolution of the Smart Motorways concept in the United Kingdom. Smart motorways refer to sections of motorway that actively manage traffic to make better use of existing road space.
In the United Kingdom, this includes using variable speed limits and, where appropriate, dynamic use of hard-shoulders as a running lane on a temporary or permanent basis. The technology related services provided by the NTIS support automated operation of these smart motorways. Electronic signs are programmed to respond automatically to manage the flow of traffic and to inform motorists of variable speed limits and about whether the hard-shoulder or other lanes are open. They are also used to provide supporting information to drivers about hazards, diversions and the cause of any restrictions or delays (DfT, 2017). As the volume of traffic increases, the smart motorway automatically adjusts the speed limit to manage congestion and to increase throughput on the affected motorway sections.
According to the DfT, the construction costs of smart motorways are on average 40% lower than for traditional widening schemes, with a reduced environmental impact as well as a quicker completion time (Dft, 2017). With the success of the first smart motorway opened on the M42 in 2006, the system has been extended across the network. In 2015, DfT announced an investment of GBP 1.5 billion in 15 smart motorway schemes between 2015 and 2020. These schemes have been assessed to have an overall benefit-cost ratio (BCR) of 5.7 to 1 (DfT, 2015). A further investment of GBP 500 million was announced in mid-2018 for four additional smart motorway projects.
While across-the-board investment in ITS on highways or motorways is unlikely to be justifiable due to differences in the level of traffic density between locations, such investment might be warranted for strategic corridors and other locations where the efficiency of network operation could be improved without the need to expand capacity.
Possible uses of Electronic Toll Collection probe data
ITS technologies and related roadside infrastructure are often employed to implement electronic toll collection (ETC). In addition to the data collected through the roadside ITS equipment, probe data collected from vehicles equipped with on-board units (OBUs) can provide additional information on the vehicles (e.g. to distinguish between vehicle sizes or types) and the routes travelled. Combining traffic and vehicle information with administrative databases of the vehicles and the drivers, it is possible to identify high-risk congestion locations and driving behaviours to enable targeted actions to be implemented. Probe data can also be used to assess the effectiveness of different traffic management strategies.
In theory, probe data from ETC could be used for many purposes, but in practice there may be limitations especially if data privacy is perceived as a concern for the implementation of a pricing scheme. Lessons from Singapore suggested it is necessary to start from basic functions before committing to a multiple purposes system to avoid delays due to public acceptance or development issues.
In Singapore, data is only captured and used on a ‘need to know’ basis. To counter privacy concerns, Singapore OBU data is not linked to car systems and the data collected is mainly related to travel speed and is subject to the Data Protection Act to safeguard data use and disclosure. A selection of vehicles regularly has the data from their OBUs analysed, in an aggregated and anonymised manner, to determine the traffic conditions to help inform motorists of any delays in real-time either through the OBUs, roadside electronic message signs or smart phones (Chin, 2018). This is especially useful when there are ad-hoc incidents that cause unanticipated congestion on the roads. Motorists can adjust their travel plans accordingly. The OBUs used in Singapore can also display information on events that may cause traffic delays, the availability of real-time parking spaces (where information available), alerts on roads or areas that are off-limit to special vehicles and advice on alternate routes (Chin, 2018).
In Tokyo, OBUs are used to receive data from the roadside sensors to provide route guidance to motorists. Combined with the modification of tolls to equalise the costs of crossing the city by more congested central routes and uncongested ring roads the route guidance system has succeeded in reducing congestion to low levels.
When the uptake of OBUs is high, for example by 94% in Chinese Taipei, probe data can also be used to determine the level of traffic and throughput in addition to providing information on average speed and travel time. Global positioning systems (GPS) trace a sample of vehicles in the traffic stream, in conjunction with road characteristics, weather information and temporal information and can help to estimate highway volume and predict delays (Young et al., 2017). In other cases, volume sensors (e.g. loop or radar detectors) are often installed to provide vehicle counts and occupancy at select locations. The cost of installation and maintenance usually limits the number of volume sensors on the network and mobile data sampling can be a useful complement to extend monitoring.
Using mobile network data to monitor network performance
Travel behaviour and preferences have been changing rapidly over the past decade and will continue to do so in the near future due to technological advancements and changes in social norms and culture. Updating and developing transport model every five to ten years is not sufficient to reflect these changes. Emerging research has started investigating the feasibility of using big data such as mobile network data to provide more frequent, higher quality and clearer resolution of transport movement data to supplement or even replace traditional transport modelling (Catapult Transport Systems, 2016; Street Light Data, 2017; NCHRP, 2018).
What is big data? There are many definitions but big data refers to any data generated by sensors, vehicles, videos and the Internet of Things (IoT). The subset of big data that is relevant to the Smart use of roads Workshop discussion is location records that are created by smart mobile devices and connected vehicles (i.e. Global Positioning System (GPS) enabled).
All GPS-navigation systems and smart mobile devices with internet access will have something called ‘ping1’, a basic programme that allows a user to verify that a particular internal protocol (IP) address exists and can accept requests. Ping can be used for testing connectivity and determining response time of connection. Using computer algorithms, ping data (data on the reachability of devises linked by the internet) can be analysed to identify the location of mobile telecommunication and telematic devices by time of day. By following the series of pings, it is possible to determine the origins, the routes and the destinations of the owners of these mobile devices. When information from a large number of mobile devices is collected and analysed together with license plate information, it is possible to create origin-destination matrices that represent travellers in a local area over time (Street Light Data, 2017).
The sample size of mobile network data is much higher than that of traditional travel surveys. Information that can be extracted from mobile devices and connected vehicles includes:
• time of day/month/year, weekday vs. weekends or holidays • average and distribution of travel time
• average and distribution of travel speed
• origin-destination (O-D) matrices on specific corridors or network • trip lengths
• pass through traffic (i.e. trips with O/D outside the study area).
By analysing such information, it would be possible to understand inter-city and inter-regional traffic movements, detect whether there are issues with the network and highlight locations that require better land use planning and improvements. For example, if the majority of drivers drive short distances in a specific local area, it may indicate that it is not be practical or safe to walk or cycle in that area. In addition, by comparing selected performance indicators (e.g. mean speed by time-period for specific corridors) before and after an intervention, it is therefore possible to identify the effect of an intervention in reducing traffic. Such information could then be used to estimate reduction in emissions; improvements in accessibility and identify distributive impacts.
The advantages that mobile network data can provide over probe data from ITS or ETC include: the possibility to identify trips made for different trip purposes (inferred by detecting home and work end of trips), modes (inferred by frequency and locations of stops) and not being constrained by physical roadside infrastructure at wider areas or regions. In addition, the marginal cost of transferring and analysing mobile network data that are automatically created should in principle be much less than the cost of building additional infrastructure to collect similar information using other means.
Discussion at the Workshop noted that technology platforms already exist to turn big data into useful information for policy or operational purposes, however, uptake is slow. According to a poll conducted by Big Data Europe in February 20182, the two key barriers for using big data are costs and lack of expertise. This view was also echoed at the Workshop. There is an urgent need for transport practitioners and researchers to develop closer working relationships with providers of big data analytics to explore the scopes and possibilities of what could be achieved with such data. This is beginning to happen in many places including for example in South America, where Brazil and Peru are joining forces to pilot a project that uses WAZE data to analyse bottlenecks and to identify other issues on the roads. Data held by the private sector such as mobile telecommunication operators and car manufacturers can be used for a range of applications that lead to more targeted public policy interventions, such as clearing congestion and managing road safety. The European Commission is facilitating business-to-business (B2B) and business-to-business-to-government (B2G) data sharing especially the use of non-personal and automatically generated data from the IoT. It released the Guidance on private sector data sharing3 for a stakeholder’s consultation in October 2018 as part of its Digital Single Market Strategy that aims to open up digital opportunities for people and business. To support B2G data sharing, the guidance (European Commission, 2018) includes a set of principles (Box 1) that aim to establishing mutual trust between businesses and government around the ownership, access, use and re-use of private sector data. Countries that are developing a business-to-government data sharing programme may wish to monitor the ongoing development of this European Commission initiative.
Box 1. Business-to-government data sharing principles
Make sure data requests are proportionate to the level of public interest: This relates to providing a clear and demonstrable public interest that is proportionate to the level of details required subject to appropriate data protection clauses. The cost and effort required for the supply and re-use of private sector data should be reasonable compared with the expected public benefits.
Set clear boundaries around data use and re-use: This relates to how, when and how often the required private sector data is used. It should be limited by it purposes or duration with appropriate assurance, legal and ethical provisions that govern the re-use and disclosure of data.
Respect private sector interests: Business-to-government (B2G) data collaboration must respect the private sector’s interests around trade secrets, other commercially sensitive information and the ability to monetise the insights derived from the data with respect to other interested parties.
Respect public sector interests: B2G data collaboration agreements acknowledge the public interest goal by giving the public sector body preferential treatment over other customers. This should be reflected in the setting of the fee levels. B2G data collaboration agreements should reduce the need for other types of data collection such as surveys and reduce the overall burden on citizens and companies.
Address data issues jointly: The private sector should offer reasonable and proportionate support to help assess the quality of the data for the stated purposes. Public bodies, in turn, should ensure that data coming from different sources is processed correctly to avoid introduction of biases and errors.
Be transparent: B2G collaboration should be transparent about the parties to the agreement and their objectives. Public bodies’ insights and best practices of B2G collaboration should be made publicly available as long as they do not compromise the confidentiality of the data.
Localised short to medium-term measures
for managing traffic
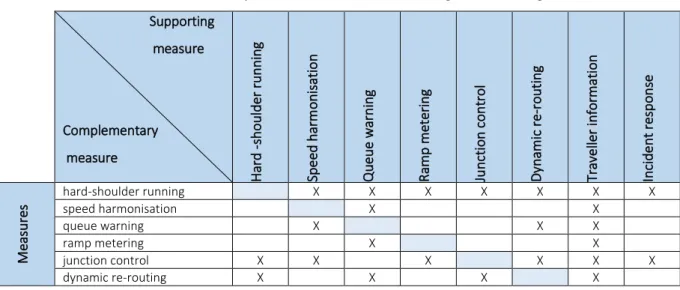
There are a number of localised active traffic management strategies that could be used as short- to medium-term measures to ease congestion and manage non-recurrent delays caused by events and incidents. These include hard-shoulder running, speed harmonisation, queue warning, ramp metering, junction control, dynamic re-routing, incident response and traveller information services. Many of the strategies can be used concurrently to enhance the effects of individual measures. Some of these measures can provide important support for the successful implementation of another measure while others are nice to have but not critical. For example, speed harmonisation is a critical supportive measure for implementing hard-shoulder running but hard-shoulder running is not a necessary measure for the implementation of speed harmonisation.
The Workshop discussed the benefits from the use of hard-shoulders and ramp meters, which are typically supported by variable speed limits (speed harmonisation) and electronic message signs. Many of these measures are often used as part of the smart motorways package (e.g. DfT, 2015; Wang et al., 2017). Other long-term solutions that can influence permanent shift in travel demands have been called for such as those that acknowledge the risk of induced traffic to fill road spaces once a bottleneck has been cleared and therefore creating additional bottlenecks elsewhere.
Hard-shoulder running
Hard-shoulder running (HSR) is a strategy to utilise the hard-shoulders on highways for general purpose use either during high traffic conditions or in some instances as an alternate solution to adding another lane. Temporary use of hard-shoulders at fixed times has been effective in relieving recurrent or intermittent traffic congestion (e.g. Brinckerhoff, 2010; FHWA, 2010; Levecq et al., 2011; CEDR, 2012). In addition, HSR is also frequently used as an incident management tool (Ma et al., 2016).
The practice of using hard-shoulder lanes is not new and has been around for over 20 years. For example, in the United States, buses have been allowed to use 290 miles of hard-shoulder on freeways and arterials in Minneapolis metropolitan areas since early 1990s. Since then many other American states introduced various hard-shoulder running applications such as for general purpose traffic (e.g. Virginia I-66 introduced in 1992 and Washington State Route 2 introduced in 2009) or priced dynamics shoulder lane (e.g. Minnesota I-35W introduced in 2009) (FHWA, 2010). Other countries that have a history of using HSR include France, Germany, the Netherlands and the United Kingdom (CEDR, 2012). Studies of hard-shoulder use in the United States and Europe found hard-shoulder use to be highly effective in reducing travel time (ranging from 10% to 30%), improving reliability (ranging from 20% to 35%) and increasing throughput (ranging from 5% to 40%) (Brinckerhoff, 2010; FHWA, 2010; Levecq et al., 2011; CEDR, 2012; Wang et al., 2017; Haj-Salem and Seidowsky, 2018). Hard-shoulder running can also enhance the effectiveness of ramp metering strategy (Haj-Salem et al., 2014; Haj-Salem and Seidowsky, 2018).
A perceived issue associated with HSR are the potential impacts on safety especially when there are deficiencies in merge distance, lane width, access control or reduced clearance at on/off ramps. In the future, autonomous vehicles should be able to overcome some of these constraints through their use of narrower lane width and reduced clearance at on/off ramps. In the meantime, HSR should be used in conjunction with other measures to mitigate any potential increase in safety risk. This includes variable speed limits, to mitigate an increase in safety risk due to reduced lane width or clearance, and other additional roadway features, such as lane control signals to manage up and down streams traffic and also video surveillance to enforce shoulder uses.
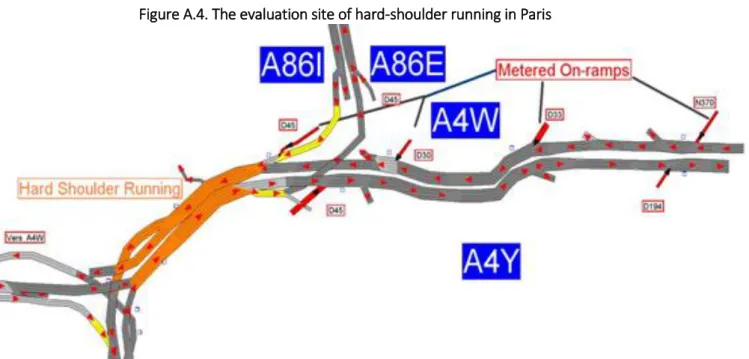
An evaluation of HSR in Paris on A4-A86 (with the use of variable messaging signs and lane assignment signals) found that its use at weaving- section reduced road crashes by 8% (Haj-Salem and Seidowsky, 2018). However, the reduction became smaller (3%) and statistically insignificant when upstream, downstream and traffic condition effects are considered. Other studies found HSR reduced road crashes by 25%-85% (FHWA, 2010; Levecq et al., 2011; CEDR, 2012; Wang et al., 2017; FHWA, 2017). There is also evidence in the United Kingdom that HSR improved safety amongst the frequency of road crashes, falling by more than half after the smart motorway incorporating HSR on the M42 in Birmingham was opened (DfT, 2015).
In addition to any potential safety risk, the use of HSR can reduce access by emergency vehicles. To minimise the impacts on operation and safety, CEDR (2012) recommended using HSR only as temporary measure and supporting it with other measures to minimise the upstream and downstream effects. The cost of implementation of HSR varies significantly, depending on whether shoulder treatments (e.g. bitumen strengthening or replacement, shoulder widening and lane re-marking) are required to ensure the shoulder lane has adequate width and surface quality to cater for increased use. For dynamic HSR application, there will also be a cost associated with the installation of traffic management equipment such as traffic detection devices, cameras, variable messaging signs (VMS), digital data collection and transmission platform for VMS, traveller information system (to inform opening/closing of HSR in advance) and other roadside infrastructure.
In the Netherlands, the total costs of investment and maintenance (excluding cost associated with traffic control centre operation) of the HSR programme over a 15-year period has been estimated at between EUR 477 000 and EUR 576 000 per kilometre (CEDR, 2012). On the other hand, the cost of the M42 active traffic management (ATM) pilot project in the United Kingdom was over GBP 5 million per kilometre (Levecq et al., 2011). Since the cost of adding an extra lane is at least several times more than this, HSR should still represent value for money and would have a much higher benefit-cost ratio (BCR) than that of adding an extra lane.
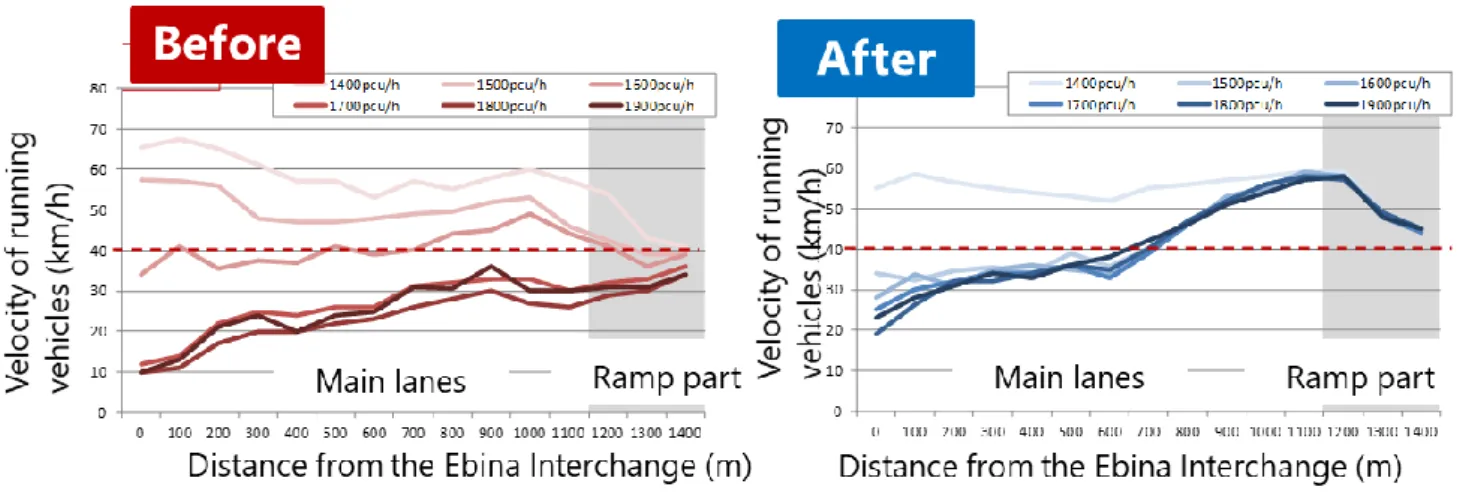
The essential requirements for a successful HSR are: the length of the treatment segment must be long enough (at least 5 kilometres); there must be no bottleneck downstream of the shoulder use segment; the shoulder width should be at least three metres and there must be sufficient pavement strength on the shoulder (Levecq et al., 2011). Where hard-shoulder running begins or terminates at a ramp junction, junction control is often required to maintain lane continuity and safe operations (Brinckerhoff, 2010). In addition, it would also be preferable to implement active incident management and installation of emergency refuge areas, since hard-shoulders have been removed for use as a breakdown lane. HSR can be enhanced by supporting measures such as speed harmonisation and ramp metering (Table 1).
Table 1. Relationships between active traffic management strategies Supporting measure Complementary measure H ar d -s h ou lder run n ing Spe ed harm on isat io n Q ueu e war n ing R am p m et er ing Ju nc ti on c on tr ol D yna m ic r e-rou ti ng Tr av e ller inform at ion Inc ide nt r esp on se M eas ur es hard-shoulder running X X X X X X X speed harmonisation X X queue warning X X X ramp metering X X junction control X X X X X X dynamic re-routing X X X X Source: Brinckerhoff (2010)
Ramp metering
Ramp metering works by managing the number of vehicles entering the highway by using traffic signals at on-ramps. It is also suitable to manage traffic where there are fewer downstream lanes than upstream lanes (FHWA, 2010). Traffic signals start working automatically when traffic sensors indicate travel speed has slowed below a predetermined level due to traffic saturation. Ramp metering can be operated using fixed-time signals without the use of real-time measurements to allow several vehicle entries at a time. It can also be operated in response to traffic based on real-time measurements of flow and lane occupancy data.
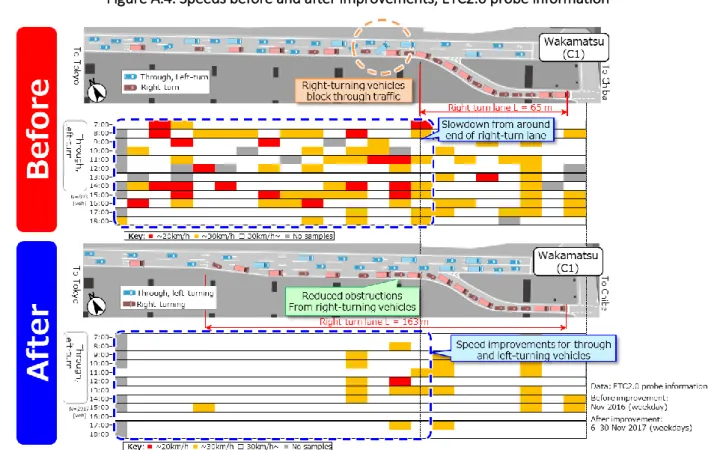
The ALINEA field trials conducted in Paris (in 1999 and 2008) are examples of traffic-responsive application of ramp metering. It has been found that traffic-responsive ramp metering measure outperformed it fixed time variation (Haj-Salem et al., 2001) in all the four aspects considered (reduction of travel time, mean speed, total time spend on the network and throughput). A more recent study found that combining traffic responsive ramp metering with hard-shoulder running enhanced the effectiveness of both measures (Haj-Salem et al., 2014). As a result of the success of the earlier trials, France is currently extending the ALINEA programme to a total of 75 on-ramps by the end of 2019 (Haj-Salem and Seidowsky, 2018).
Zhang and Levinson (2010) showed that although the use of ramp meters generally degrades the conditions of on-ramps and risk adding delays to the arterial network, the use of ramp meters can reduce highways delays by increasing capacity at segments upstream of bottlenecks as well as at bottlenecks themselves. The two sources of capacity improvements may explain why ramp metering is an effective measure to prevent or minimise the effects of bottlenecks. Applications of demand-responsive ramp metering in the United Kingdom, the United States, France and Germany have been found to be effective in reducing crash severity and crash occurrence (between 20% and 40%); improving speed (between 3% and 10%) and throughput (between 5% and 20%), reducing overall average network travel time (by around 15%) and congestion (up to 50%) (CEDR, 2012; Wang et al., 2017; FHWA, 2017).
Speed harmonisation
Speed harmonisation involves varying the speed limits with the aim of gradually lowering the average speed to minimise congestion and reduce stop-start traffic conditions. Speed harmonisation is typically used in conjunction with queue warning4 and is activated with variable speed limit signs. After traffic sensors detect real-time traffic conditions, information is sent to traffic management system to calculate the optimal speeds for vehicles. Drivers will be informed about any change in the optimal speeds so they can make appropriate adjustment accordingly.
Speed harmonisation was introduced in the United Kingdom on the M25 in 1995 and achieved positive results in reducing stop-start traffic conditions, emissions and property damage only crashes. In Germany and the Netherlands, similar measures reduced travel time by between 5% and 15% while increasing capacity by around 5% (Levecq et al., 2011; CEDR, 2012). To mitigate any increase in road safety risk resulting from HSR, speed harmonisation is recommended for more effective use of hard-shoulders to manage increased traffic.
Infrastructure can also be designed to encourage appropriate speeds, with self-explaining street layouts and rumble strips at junctions on expressways for example. Japan has taken this step further, using banks of light emitting diodes on roadside walls to pulse at a frequency tuned to appropriate speeds. This is used to encourage drivers not to slow down unconsciously due to change of incline or on entry to tunnels, and to decelerate before curve sections. This has proved effective for improving both safety and traffic flow.
Adaptive signal control system
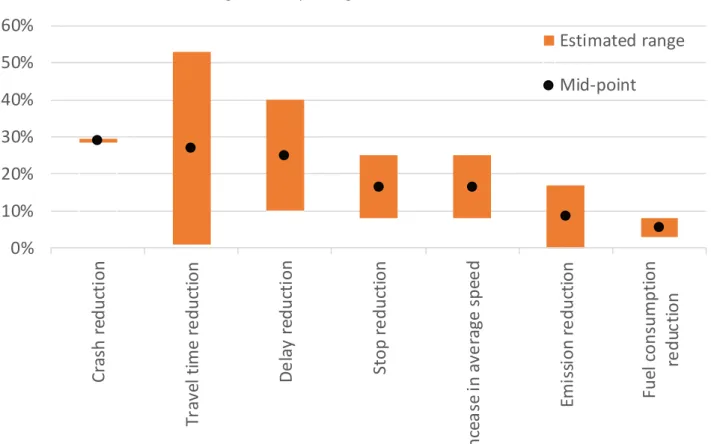
Proactive traffic management can also be achieved by smarter use of signal systems, such as adoption of advanced and adaptive signal control systems. These systems actively monitor traffic conditions and coordinate control of traffic signals by adjusting the lengths of signal phases based on prevailing traffic conditions. In certain locations, the benefit-cost ratio (BCR) of installing adaptive signal control can be as high as 60:1 (FHWA, 2017).
Figure 1 shows the ranges of benefits obtained from over 20 years of international evaluation studies, research syntheses, journal articles and conference papers from the deployment of adaptive signal control systems. Apart from mobility benefits (including reductions in travel time, delay and stop and increase in average speed), adaptive signal control systems also deliver safety and environmental co-benefits. The cost of adaptive signal control per intersection was estimated at around EUR 30 000 per intersection.
Figure 1. Adaptive signal control benefits
Source: FHWA (2017) and ITS Knowledge Resources (http://www.itsknowledgeresources.its.dot.gov/)
0%
10%
20%
30%
40%
50%
60%
Cr
as
h
r
ed
u
cti
o
n
Tr
av
el
ti
me
r
e
d
u
cti
o
n
D
e
la
y
re
d
u
cti
o
n
Sto
p
r
e
d
u
cti
o
n
In
ce
a
se
in
a
ve
ra
ge
s
p
ee
d
Emi
ss
io
n
r
e
d
u
cti
o
n
Fu
el
c
o
n
su
mp
ti
o
n
re
d
uc
ti
o
n
Estimated range
Mid-point
Road pricing as a medium to long-term
solution for expanding cities
Road pricing is an efficient way to manage traffic demand. It can reduce travel time variability significantly and contribute to a more optimal allocation of scarce urban space to roads and between road users. A discussion on the theory and practice of charging for road use can be found in the Social Impacts of Road Pricing Roundtable Summary and Conclusion report (ITF, 2018).
There are many decisions, such as defining the charging objective, charging schemes and charge levels, to consider before the implementation of road pricing. Amongst these, it is necessary to determine the road pricing technologies to adopt, including tolling mechanisms and supporting infrastructure. Technology choice should be determined by system objectives, and not the other way round (ITF, 2010). The Workshop discussed experience in Asia and noted the systems and technologies deployed in Tokyo, Singapore and Chinese Taipei.
There was a general agreement that road pricing is the most effective form of demand management that has long-lasting effects in managing congestion, which in turn will have emissions, safety and other benefits. While some road pricing technologies offer more functionality than others, the recommendation is to use the simplest, most cost-effective technology suited to managing congestion and ensure this is functional before considering added features that might complicate delivery and risk delays.
Road pricing mechanisms
Road pricing systems typically consist of three components – detection; payment and enforcement. Intelligent Transport Systems (ITS) technologies have enabled automation of all these processes. The earliest form of road pricing mechanism was the paper-based area permit used in Singapore when it first introduced a cordon-based area licencing scheme (ALS) in 1975. The scheme required all cars entering the centre business district (CBD) area to display an ALS permit, sold at kiosks located outside the CBD. Although the scheme was successful in reducing traffic entering the CBD, enforcement was a major issue as non-compliance was detected manually by enforcement officers.
The Singapore ALS permit mechanism is similar to the vignette (road tax sticker) regime used in several European countries including Austria, Romania and Switzerland. The vignette is a pre-paid compulsory road tax for all vehicles using motorways or entering the CBD area (e.g. in Malta prior to 2007), for the duration of the selected period (one day, week, month or year). In addition, some countries (e.g. the United Kingdom) are running vignette systems for heavy vehicles. Today, vignette stickers are mostly replaced by electronic vignettes (e.g. the common toll collection system in the Netherlands, Luxembourg, Denmark, and Sweden called the Eurovignette).
Four generations of road tolling mechanisms have evolved over the last 40 years: manual toll collection, automated toll collection, free-flow Electronic Toll Collection (ECT) and satellite-based toll collection. Manual toll collection is the first generation tolling mechanism. It requires the use of a tolling plaza and vehicles need to stop at the toll booths, with barriers, to process payment. This stop-and-go collection
mechanism typically has a throughput of around 800 vehicles per lane-hour (Chen, 2018). This manual toll collection mechanism can still be seen, e.g. in Hong Kong’s toll roads and tunnels for collecting toll payment from vehicles that are not equipped with an automated electronic tolling transponder. A key advantage of manual toll collection is that it is easy to implement, as it does not require installation of on-board units (OBUs) or ITS related roadside infrastructure. However, it is labour intensive and the need to build toll plazas adds cost and utilises limited and expensive road space. Such a collection mechanism is better suited for charging the use of a link, tunnel or bridge and is not suitable for demand-responsive pricing and distance-based pricing.
The second generation tolling mechanism is automated electronic tolling. This tolling requires both vehicles and tollbooths to be equipped with dedicated sensors and transponders to allow automatic toll collection with vehicles passing through at low speed (around 20 kph). When a vehicle equipped with an ETC transponder passes through a toll booth, the transponder communicates instantaneously with the device installed adjacent to the toll booth. This communication facilitates toll payment by deducting it from a pre-paid account. This toll collection system has a throughput of around 1 000 vehicles per lane-hour at 20 kph (Chen, 2018). For enforcement purposes, a barrier might still be used at the tollbooths. Automated toll collection increases toll collection accuracy, reduces costs and speeds up the toll collection process. However, it does require investment in ITS technologies, roadside infrastructure and vehicle owners need to install in-vehicle transponders.
The third generation of tolling mechanism is free-flow Electronic Toll Collection (ECT). This tolling mechanism does not require installation of tollbooths but roadside infrastructure such as gantries are needed to communicate with vehicles for toll collection. It requires communication technologies such as Dedicated Short-Range Communication (DSRC), Radio-Frequency Identification (RFID) or Automatic Number Plate Recognition (ANPR) to complete and enforce the toll payment transaction. However, vehicles do not need to stop or slow down at the gantries.
There are two types of free-flow ECT systems – lane free-flow and multi-lane free-flow. The single-lane free-flow system used in Chinese Taipei during 2006-2013 had an average throughput of 1 500 vehicles per lane-hour with an average speed passing through the gantries of around 70 kph. The current multi-lane free-flow system used in Chinese Taipei increased throughput to 2 100 vehicles per lane-hour and vehicles can now pass through the gantries at 100 kph or even higher speeds (Chen, 2018).
Although it has been available for some time (e.g. the Toll Collect system introduced in Germany for heavy vehicles in 2005), satellite positioning-based tolling is the newest generation of tolling mechanism for cities. This tolling mechanism uses Global Navigation Satellite System (GNSS) technology to provide positioning services required for toll calculation. GNSS helps to detect and charge vehicles based on location, time and distance travelled within virtual boundaries that define toll sections and rates. Satellite positioning tolling requires vehicles to install OBUs and is supported by DSRC and cellular network. GNSS can be used not only to toll specific roads but to toll vehicles regardless of which type or class of road they drive on (European GNSS Agency, 2015).
Work is underway in Singapore to move from the existing DSRC gantry-based system to deployment of a GNSS-based system by 2020 (Chin, 2018) (see Box 2). By using geo-fences (or virtual gantries), roadside infrastructure would be required mainly for enforcement purposes. In general, GNSS-based tolling require gantries every 50 kilometres for enforcement purposes and much could be removed, whereas non-GNSS based tolling mechanism requires gantries every three to five kilometres (European GNSS Agency, 2015). Chinese Taipei’s current multi-lane free-flow system requires over 300 gantries on its 1 000 kilometres highways network (Chen, 2018).
Managing traffic with road pricing
Once a road pricing system is in place, charge rates can be varied to manage demand based on flow, speed, distance or other trip characteristics. How changes in the level of charges influence travel behaviours has been demonstrated by Chinese Taipei’s ETC scheme.
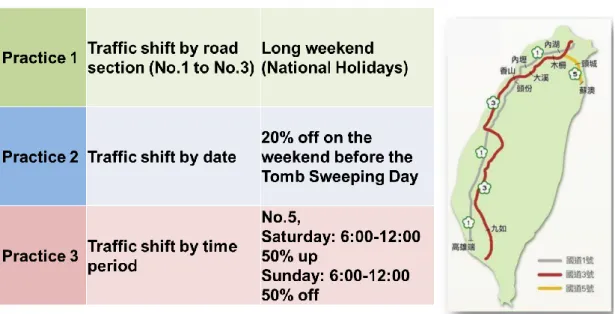
Road pricing schemes in Chinese Taipei
To help cope with recurrent congestion during long weekends, Chinese Taipei applies differential road pricing to encourage traffic to shift routes by increasing the prices on state highway 1 while at the same time providing a discount for the alternate route on state highway 3. Over the past two years, this practice has resulted in 1.4% of traffic shifting from state highway 1 to state highway 3, enough to make a significant difference to congestion. Similar application was also trialled in Tokyo to reduce congestion on the shorter and more direct expressways by encouraging traffic to use the longer alternate routes simply by equalising the end–to-end charge rate. It has resulted in an 8% reduction in traffic on congested expressways. The next step is to test the use of differential rates based on traffic conditions to evaluate the effects on route choice decisions.
Differential road pricing was also used to shift traffic by date of travel in Chinese Taipei. By providing discounts on the key highways for the weekend prior to the annual Tomb Sweeping Day festival, which is a major holiday. This practice was successful in shifting 2%-3% of travel to the earlier date. The third practice regularly applied in Chinese Taipei aims to shift the time of day that people travel by increasing tolls by 50% on the route from the capital to popular weekend destinations on Saturday mornings, with a 50% discount for traffic returning on Sunday morning. This has resulted in a 3% reduction in traffic volume on Saturday morning when the network is most utilised. Although the reduction in volume may seem low, it was sufficient to significantly reduce travel time (by 13%) and reduce congestion duration (by 29%).
Chinese Taipei developed its first flat rate Electronic Toll Collection (ETC) in 2006 using Dedicated Short-Range Communication (DSRC) technology supported by 23 toll plazas. The DSRC ETC was replaced by Radio-Frequency Identification (RFID) ETC in 2012. In 2014, the barrier base tolling mechanism was replaced by multi-lane free-flow open road tolling, currently supported by 333 free-flow gantries for the 1 000 km state highway network. To transition to distance-based charging, Chinese Taipei first changed the payment method from manual ETC to automatic ETC. It then applied tolling tariff changes by switching from pass-based to distance-based. At the same time, the toll plazas were gradually decommissioned. (FETC, 2017)
The on-board units (OBUs) were subsequently replaced by eTag. Communications is the key to reduce users’ anxiety about tariff changes. The easy-to-use features of e-tag makes large improvements in the adoption of OBUs from around 43% to 94% in just 18 months, whereas it took five years to get to the 40% when the flat rate ETC was introduced. Now their system processes 15 million average daily transactions, with almost 100% tolling accuracy. (FETC, 2017)
Road pricing scheme in Singapore
In Singapore, tolls are varied by time of day and by the location of the charging gantry, and rates are reviewed every three months based on data on traffic speeds and adjusted where necessary to maintain speeds around 20 km/h - 30 km/h on city roads and 45 km/h - 65 km/h on expressways (Chin, 2018).
Singapore introduced the cordon-based Area Licensing Scheme (ALS) in 1975. In 1998, it was replaced by an Electronic Road Pricing (ERP) system that uses a Dedicated Short-Range Communication (DSRC) and custom-built charging gantries with antennae and enforcement cameras to detect and communicate with electronic in-vehicle units. Charges are set to maintain average travel speeds on the roads (45 km/h - 65 km/h on expressways and 20 km/h - 30 km/h on other roads), and this was done every three months so that the prevailing road pricing charges remain relevant. During the long school holidays in June and at the end of each year, some of the pricing points have their pricing levels lowered (or removed) if lower traffic flows will be expected during those periods. Singapore is currently developing the next generation of road pricing systems based on Global Navigation Satellite System (GNSS) technology. (Chin, 2018) Singapore’s next generation road pricing system will utilise satellite signals supplemented by augmented beacons and DSRC system for locations with weak satellite signals. The new electronic on-board units (OBUs) will be resistant to signal jamming and deceiving, with encryption technology and anti-tampering features. The OBU will monitor the location of the vehicle and automatically calculate the road pricing charge once the vehicle enters the virtual boundary. The new system will maintain some of the existing pricing points and structure initially. Enforcement cameras will be installed with complementary beacons to ensure vehicles have working OBUs fitted and capture the vehicle’s licence plate in case enforcement action will be required due to non-compliance. The OBUs will also provide real-time information to travellers on the congestion levels in real-time. The Singapore government expects to deploy the next generation road pricing system around 2020. (Chin, 2018)
Figure 2: Schematic of Singapore’s next generation road pricing system
Source: Land Transport Authority, Singapore (2017)
Road pricing schemes in Japan
Japan first developed its Electronic Toll Collection (ETC) system in 2000. The ETC employs nationally unified standards to allow multiple road operators to operate and manage toll roads with different types of payment systems, such as uniform tolls and distanced-based tolls, using the same collection mechanisms. Since then, there has been high nationwide uptake, and currently about 90% of vehicles on expressways use this system. (Ikeda, 2018)
In 2014, the ETC system was integrated with probe data collection and other additional functions to develop the ETC2.0 system. Currently, about three million ETC2.0 compatible on-board units (OBUs) have already been installed on vehicles using the network. ETC 2.0 is the world's first infrastructure-to-vehicle collaboration system that offers driving support services enabled by high-throughput bidirectional communication through 1 700 ITS Spots (antennas) installed alongside the expressways. ETC 2.0 provides a wide variety of information transmitted from the ITS Spots, such as location of hazardous points along the road network and potential or actual congestion. When used in conjunction with a car navigation device equipped with ETC 2.0, users can select the optimal route using information available for a maximum of about 1 000 km of the expressways. (Ikeda, 2018)
Road pricing schemes in Malta
Another form of road pricing is the time-based pricing used in Valletta, Malta. The city’s “controlled vehicular access” charge has successfully increased accessibility by reducing the duration vehicles are parked inside the cordon and the number of vehicles entering the cordon each day. The level of public acceptance is high possibly due to the extensive exemption provisions, which could also be the reason for disappointing results in terms of congestion improvement.
To improve access to the city, reduce congestion and better utilise parking space, the fortified city of Valletta (capital of Malta) launched a “pay-as-you-go” Controlled Vehicular Access (CVA) system in May 20075. Prior to the introduction of CVA, access to the inner-city was restricted to drivers who paid an annual fee of EUR 46 for a Vignette displayed on the vehicle.
The CVA system uses Automatic Number Plate Recognition (ANPR) technology and dedicated camera systems to monitor and photograph vehicles entering and exiting the CVA boundary6. The system then
automatically calculates the time the vehicle remained inside the Valletta CVA boundary and computes the fee due for access and parking based on the tariffs set by Transport Malta.
Valletta’s CVA charges vary according to the time spent in the zone, time of day (charges apply for weekdays between 8am and 6pm and on Saturday between 8am and 1pm) and days of the year (public holidays and Sunday are free)7. Access for first 30 minutes is free; access for 31-60 minutes costs EUR 0.82 and EUR 0.82 per hour thereafter up to a maximum charge of EUR 6.52. Various permutations of exemptions are offered to ensure fairness; these include exception for residents, relatives, senior citizens, businesses, service providers, medical and emergency services and electric vehicles (Ison and Attard, 2013). The CVA system did not solve the congestion issue. However, it has improved accessibility to the city centre by shortening the average time a vehicle was parked.