Science Arts & Métiers (SAM)
is an open access repository that collects the work of Arts et Métiers Institute of Technology researchers and makes it freely available over the web where possible.
This is an author-deposited version published in: https://sam.ensam.eu Handle ID: .http://hdl.handle.net/10985/8275
To cite this version :
Benjamin AUBERT, Claudio VERGARI, Brice ILHARREBORDE, Aurélien COURVOISIER, Wafa SKALLI - 3D reconstruction of ribcage geometry from biplanar radiographs using a statistical parametric model approach - Computer Methods in Biomechanics and Biomedical Engineering : Imaging & Visualization p.In Press - 2014
3D Reconstruction of Rib Cage Geometry from Biplanar
Radiographs using a Statistical Parametric Model approach
Aubert B.
1, Vergari C.
1, Ilharreborde B.
2, Courvoisier A.
1,3, Skalli, W.
1Affiliations: 1
Arts et Metiers ParisTech, LBM, 151 bd de l'hopital, 75013 Paris, France 2
Pediatric Orthopaedic Department, Robert Debré Hospital, AP-HP, Paris Diderot University, 48 Bd Sérurier, 75019 Paris, France
3
Pediatric Orthopaedic Department, Grenoble University Hospital, Joseph Fourier University, Grenoble cedex 9, BP 217 38043, France
Corresponding author: Benjamin AUBERT
LBM, Arts et Métiers ParisTech 151 Bd de l’Hôpital
75013 PARIS FRANCE
Abstract
Rib cage 3D reconstruction is an important prerequisite for thoracic spine modelling, particularly for studies of the deformed thorax in adolescent idiopathic scoliosis. This study proposes a new method for rib cage 3D reconstruction from biplanar radiographs, using a statistical parametric model approach.
Simplified parametric models were defined at the hierarchical levels of rib cage surface, rib midline and rib surface, and applied on a database of 86 trunks. The resulting parameter database served to statistical models learning which were used to quickly provide a first estimate of the reconstruction from identifications on both radiographs. This solution was then refined by manual adjustments in order to improve the matching between model and image. Accuracy was assessed by comparison with 29 rib cages from CT scans in terms of geometrical parameter differences and in terms of line-to-line error distance between the rib midlines. Intra and inter-observer reproducibility were determined regarding 20 scoliotic patients.
The first estimate (mean reconstruction time of 2’30) was sufficient to extract the main rib cage global parameters with a 95% confidence interval lower than 7%, 8%, 2% and 4° for rib cage volume, antero-posterior and lateral maximal diameters and maximal rib hump, respectively. The mean error distance was 5.4 mm (max 35mm) down to 3.6 mm (max 24 mm) after the manual adjustment step (+3’30).
The proposed method will improve developments of rib cage finite element modeling and evaluation of clinical outcomes.
Key words
3D reconstruction; Human rib cage; Adolescent Idiopathic Scoliosis; Clinical Measurements; Statistical Parametric Model; Stereoradiography
1. Introduction
Three-dimensional (3D) models of the spine and rib cage are required for the analysis of adolescent idiopathic scoliosis (AIS), since idiopathic scoliosis is a 3D deformity affecting the whole trunk.
Clinical parameters computed from 3D models, such as Cobb angle or vertebrae axial rotation, can be used to monitor scoliosis progression during growth or the effect of routine clinical treatment by orthotic bracing or surgery (Ilharreborde et al. 2011). Rib cage global parameters, such as rib cage volume, spinal penetration index and rib hump angle (Dubousset et al. 2003) and other morphological parameters complete the spine analysis, particularly for the deformed thorax which can raise clinically relevant issues for pulmonary restrictive disease (Sabourin et al. 2010; Johnston et al. 2011). Furthermore, 3D models are necessary for the development of realistic subject-specific finite element models (FEM) which are used to understand the mechanisms of initiation of structural deformation and predict treatment effects (Nie et al. 2009; Clin et al. 2010; Drevelle et al. 2010; Little et al. 2013) or used in crash simulation to investigate injury mechanisms.
Accurate 3D models reconstructed from Computerized Tomography scanning (CT) involve a long manual processing time and this imaging modality induces a high radiation dose, which is detrimental for young patients (Pearce et al. 2012). Moreover, even if low dose CT protocols are being developed (Abul-Kasim 2010), the supine position affects the natural curvature and reduces the actual Cobb angle and rib cage rotation compared to the standing position. As an alternative, two biplanar calibrated radiographs are used in conjunction with 3D reconstruction algorithms to reconstruct bone geometry.
Several previous studies have proposed rib cage 3D reconstruction methods from PA (Postero-Anterior) and LAT (Lateral) X-ray views, which is the standard for clinical imaging and for spine 3D reconstruction (non-exhaustive list: Mitton et al. 2000; Benameur et al. 2001; Humbert et al. 2009). Studies were dedicated either to computer aided diagnosis for chest analysis and lung disease (Dworzak et al. 2010; Koehler et al. 2010) or to subject-specific FEM and scoliosis (Benameur et al. 2005; Mitton et al. 2008; Jolivet et al. 2010; Seoud et al. 2011; Grenier et al. 2013). Statistical shape models, used in Benameur et al. 2005 and Dworzak et al. 2010, facilitate the fully automated detection of objects in images by
providing a plausible shape with the respect of the shape variability extracted from a set of training objects. However, the first estimate (i.e., the initial solution) must be similar to the actual solution in order to ensure the convergence and avoid mismatching, especially using in-vivo datasets with noisy and poor contrast images. The methods proposed by Mitton et al. (2008) and Seoud et al. (2011) took 30 and 40 minutes per rib cage, respectively, which is a limitation for routine clinical use.
Jolivet et al. (2010) proposed an alternative method based on a geometric rib cage representation using a global parametric bi-cubic surface. The surface shape was controlled by cubic splines reconstructed from 54 anatomical landmarks identified in both views. Ribs were modeled by their midlines, which were evaluated by the surface function. The reported time of digitalization was 3 minutes for asymptomatic rib cage. This was a faster method that could be used for non-deformed rib cages and was adopted by (Courvoisier et al. 2013) for global rib cage analysis of mid-scoliotic cases. However, the parametric modeling described only the global rib cage shape, and the method needed improvements since manual adjustment of rib midlines was not supported. Therefore bias could occur in the presence of a large scoliotic deformation. Moreover, identification of a large number of anatomical landmarks was required, including areas which were not clearly visible in LAT view.
Recently, the method proposed by (Grenier et al. 2013) integrated prior summary statistics to delimit the search space of upper rib orientations and thus overcome the partial information problem due to arm and shoulder superimposition (LAT view). The method used an automated segmentation method of rib outer contours in PA view which required manual identification of four points per ribs. Additional interactive manual ribs segmentation in LAT view involved a total reconstruction time of 40 minutes per rib cage.
In summary, existing methods for 3D reconstruction are either too time consuming for routine clinical use, either they lack the accuracy needed for research applications. This study aimed to develop a rib cage 3D reconstruction method, allowing fast and accurate reconstruction of the in-vivo geometry from biplanar radiographs, based on the statistical parametric model approach (Pomero et al. 2004; Humbert et al. 2009; Chaibi et al. 2012; Lebailly et al. 2012). The accuracy of the proposed method was assessed by comparison with 3D reconstructions from 29 CT scans, and intra and inter-observer reproducibility was determined for rib cage global parameters regarding 20 scoliotic patients.
2. Materials and Methods
2.1) Reconstruction method
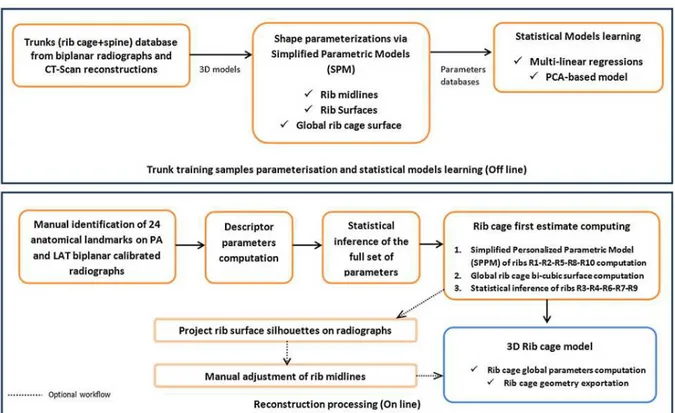
This family of methods introduces prior knowledge by specifying a simplified parametric model (SPM) to represent the structure to be reconstructed using a simplified representation (schematic). A SPM definition step finds the best combination of basic geometric primitives (such as points, lines, circles, etc.) described by parameters (such as coordinates, angles, radius, distances, etc.) to approximate the shape. SPM serves to build a parameters database from a training set of reference objects. Parameters database feeds statistical models and determines the inferences of the full set of parameters from a reduced set of descriptors. Descriptors are computed from manual identifications on both PA and LAT radiographs of visible anatomical landmarks. The resulting full set of parameters gives a specific instance of SPM(the personalized model). The features of the personalized model are generally used to drive the 3D deformation of a morpho-realistic 3D generic model (polygonal mesh) to turn the simplified representation into morpho-realistic representation encompassing the personalized geometric primitives. Finally, projection of 3D model silhouettes (Benameur et al. 2001; Laporte et al. 2003) on radiographs is performed in order to add a step of interactive adjustments and improve the matching between model and image information.
In this study, three hierarchical levels of description were adopted for the specific anatomical structure of the rib cage: a SPM for the rib outer surface shape (local shape of each rib), one for the ribs midline 3D trajectories and one for the entire rib cage surface for global representation.
Inspired by a method which was developed for the spine (Humbert et al. 2009), a transverse statistical model was adopted for each costal level to infer the rib midline curve trajectory and local geometrical properties of the rib surface. A longitudinal statistical model managed the inferences of dependent parameters between ribs in order to deal with rib relationships. The rib cage reconstruction framework is presented in figure 1.
2.2) Subjects and imaging
Images and associated 3D reconstructions were derived from anonymous CT scans (29 rib cages, slice thickness varying from 0.5 to 2.25 mm) and from EOS biplanar radiographs
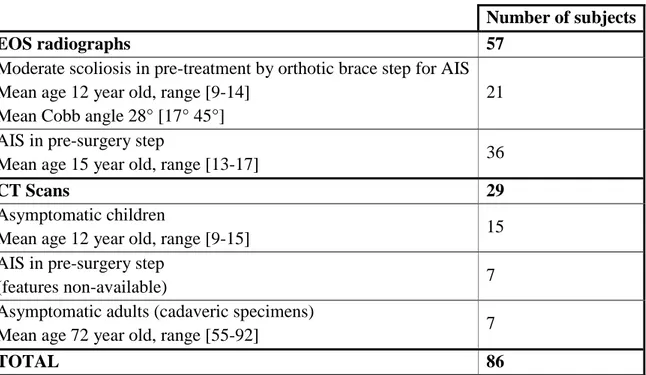
(EOS Imaging, Paris, France) (57 rib cages) collected from previous studies (Ilharreborde et al. 2011; Courvoisier et al. 2013; Sandoz et al. 2013). Table 1 provides the main demographic data of the subjects. EOS system provided self-calibrated biplanar radiographs (constant geometrical calibration parameters).
2.3) 3D Trunks database
For detailed description of rib shapes, 3D reconstruction of rib outer surfaces (Fig. 2.c) from CT scans was performed using the Avizo® software (VSG, Burlington, USA). All reconstructions were verified and corrected in case of incorrect segmentation or voids in the 3D mesh, while incomplete images with thorax truncated between ribs 1 (R1) to 10 (R10) were excluded from the study. Overall, 580 rib surfaces from CT scans were available covering costal levels R1 to R10.
For spine 3D reconstruction from CT scans, PA and LAT digitally reconstructed radiographs (DRR) were generated from CT volume data by ray tracing computation (Penney et al. 1998), in order to recreate the two projections of a biplanar environment (Fig. 2.a). The DRRs served to reconstruct the spine using the method proposed by Humbert et al. (2009).
For global description of rib cages in the standing position (which cannot be achieved using supine CT data), 3D reconstructions from EOS biplanar radiographs were performed following the methods described by Humbert et al. (2009) for the spine and by Jolivet et al. (2010) for the rib cage. Since this last method did not allow manual adjustments, a refinement of 3D reconstructions was performed by using a moving least squares deformation algorithm (Cresson et al. 2008) consisting of manually moving handles of deformation until a good fit was observed between the projected 3D rib midlines and X-ray images.
2.4) Simplified parametric model of ribs
Reconstructions of each rib outer surface were used to extract rib midlines (Fig. 2.d) ; the outer surfaces were cut with thirty cross-sectional planes (Fig.2.e), equispaced along the rib, and the centroids of rib cross–sections were used to define the rib midline curve (Sandoz et al. 2013).
Rib midline trajectory was parameterized by two circles (Roberts et al. 1972); both circles were inscribed in a 3D plane pPost and pLat respectively (Fig. 3). The maximal
distance point (MD) between rib midline curve and its orthogonal projection on the chord segment was also defined (Fig. 3).
In order to build a representation of the rib surfaces, the outline of each cross-section was approximated with an ellipse parameterized by radii (A and B) and local twist angle (Fig. 2.f), which were computed by a least squares algorithm (Fitzgibbon et al. 1999).
2.5) Personalized parametric model of a rib
The geometric modeling yielded a set of parameters defining the rib SPM: rib chord length, rib chord angles interpreted in a thorax coordinate referential frame (see appendix 1), coordinates of MD point (in thorax frame), radii of primitive circles defining the rib, etc… Processing the reference objects yielded a SPM database that was first used to compute the Pearson correlation matrix in order to analyze the relationships between parameters. A subset of parameters was assigned to predictor parameters with the knowledge that descriptors had to be computed from landmark identificated on radiographs.
Statistical model learning
Multi-linear regression models were tested. For an estimation of a parameter from predictor parameters ,.., , the corresponding model had the following form:
= . + ⋯ + . + = + (1)
Where and b were the coefficients learned and represents the residuals of statistical model. To assess the inference uncertainty, the standard error of estimate (SEE= =
∑ with was the ith
residual of the ith training sample) was computed through a “leave one out” procedure, computing the difference when the ith training sample was removed from the training set.
2.6) Global rib cage description
A bi-cubic surface, controlled by the midlines of ribs R2, R5, R8 and R10, was used to approximate the ribcage surface from R2 to R10 for both left and right sides (Fig. 4). Midlines of the remaining ribs (R3, R4, R6, R7 and R9) were inferred in the surface’s parametric space, and they were therefore constrained by the surface; inferences were implemented with a statistical model based on principal component analysis (PCA).
The surface was computed by fitting a global bi-cubic surface function ( f(u,v) = XYZ ) on the sampling of equispaced points from bi-cubic patches defined by a network of control splines (Fig. 4). Due to the specificity of this continuous surface, a rib trajectory could be parameterized by eight control points in (u,v) coordinates and was defined by varying u from 0 to 1 (uniformly spaced). Thus, only eight parameters for the v direction were required to evaluate a rib midline using the surface function.
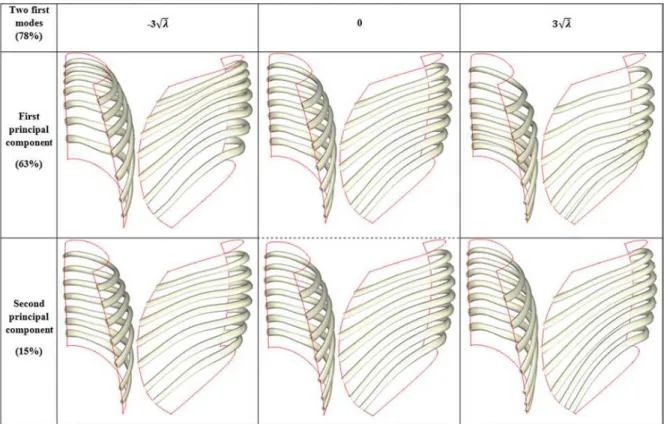
A centered PCA was computed on v coordinates for costal levels R3 to R9 (N = 7 ribs x 8 parameters = 56) from the dataset of rib cages reconstructed in the standing position. The first ten principal components represented 95% of the variance (63% for the first one). The PCA-model was similar to a point distribution model (Cootes et al. 1995) and had the following form:
= ̅ + Φ !ℎ − 3%& ≤ ≤ 3%& (2)
where m was a vector of ten contribution weight parameters for each component mode (bounded by ±3√& factors to reach a plausible solution), Φ was the covariance eigenvector matrix and & the associated eigenvalues of the ten first principal components selected and ̅ was the data mean. . Effects of the first two modes are presented in Figure 5.
2.7) Reconstruction process
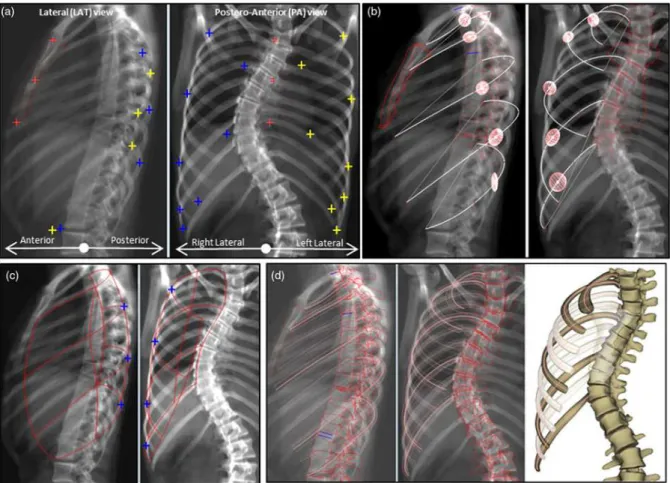
a) First estimate computing Identification on X-Rays views
24 anatomical landmarks were manually identified on the radiographs (Fig. 6.a): 2 on R2 (most lateral point and rib tip on PA view), 3 on R5 and R8 (most lateral point and rib tip on PA view, and most posterior point on LAT view), 4 on R10 (most lateral point on PA view, most posterior point on LAT view and a stereo corresponding point (both views) for the rib tip). Only two of these landmarks were stereocorresponding points (i.e., defined both in PA and lateral views): the left and right R10 rib tips. These were the only points for which 3D coordinates were available; for the others, only their 2D projection was available. A deformable sternum template eased the identification of sternum points (upper tip, Louis angle, lower tip) in both views by using a moving least square deformation of a sternum 3D generic model (Fig. 6.b). A statistical model initialized the position of the template.
First estimate computation
Rib head points were extracted from the 3D reconstruction of the spine. Chord lengths and angles of the ribs R1, R5, R8, and the coordinates of the MD point (Figure 3) were estimated for ribs R1, R2, R5, R8 and R10 from predictor parameters computed from anatomical landmarks. For example, the intersection of the projection lines of the rib tip anatomical landmarks with a subject’s local coronal plane, as calculated from the spine 3D reconstruction between T1 and T10, was used to compute the chord frontal angles of ribs R2, R5, R8, R10.
Thus, transverse inferences predicted missing parameters from other one and finally obtain the ribs midlines R1-R2-R5-R8-R10 personalized models (Fig. 6.b). These rib midlines were then refined in order to enclose them into the anatomical landmark projection lines. The bi-cubic surface was then computed (Fig. 6.c).
Estimate of R3-R4-R6-R7-R9 rib midlines
PCA-model modes were iteratively optimized (using the method described by Cootes et al. (1995) for weight computing) in order to minimize the distance between a subset of known parameters (V coordinates of ribs R5-R8 in addition to rib head points for all levels) and current output of the model. The resulting V coordinates served to evaluate rib trajectories with the bi-cubic surface function.
Estimate of rib outer surfaces
Once all rib midlines were computed, multi-linear regression models (one for each costal level) inferred local parameters of ellipses from rib midline descriptor parameters (the length, the chord length and the maximal distance). Point samples on ellipses allowed computing a mesh representing the outer rib surface (Fig. 6.d).
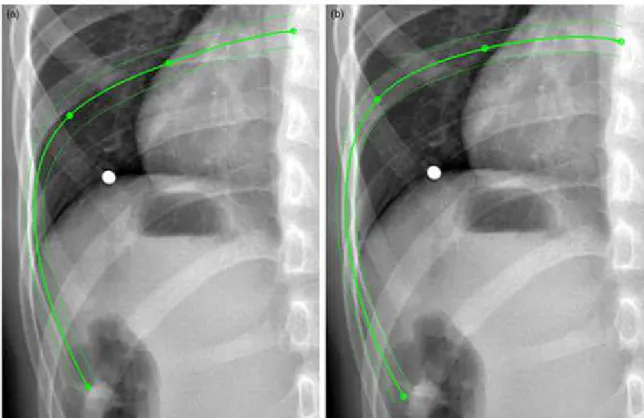
b) Interactive adjustments
This manual step of refinement consisted in interactively moving points of the rib head, MD point, maximum posterior point and the rib tip in order to improve the matching between the projected rib surface silhouette and the X-ray image (Fig. 10). The rib head was constrained to belong to a curve passing through costal insertion points to avoid disconnecting from the spine. The elevation of rib tip in the LAT view was constrained by the elevation in the PA view which had a better visibility for rib tip. The rib midline personalized model was
updated with new values of descriptor parameters at each displacement; longitudinal inference, however, was released in this phase, allowing independent adjustment of each rib.
2.8) Global measurement output
The following rib cage global parameters were extracted from the 3D reconstructions: • Thoracic lateral and antero-posterior maximum diameters, obtained by intersecting the
rib cage surface with a horizontal plane (Fig. 7.a) at vertebral levels T3 to T10 and by selecting maximal values along the rib levels (Courvoisier et al. 2013).
• Maximum angular rib hump computed between the acetabular axis and the axis passing through the most posterior prominent points;
• Rib cage volume calculated with a closed meshing joining all rib midlines (Fig. 7.b); • Volumetric spinal penetration index (SPI) (Dubousset et al. 2003), corresponding to
the ratio of volume of the spine that penetrates the volume of rib cage expressed as a percentage (Fig. 7.c)
2.9) Assessment protocol
Accuracy
Accuracy was assessed by comparison with the 29 thoraxes reconstructed from the CT scan, which was considered as the “gold standard”. Digitally reconstructed radiographic images (PA and LAT) were produced from CT scan (cf. 2.3) and used to perform rib cage 3D reconstruction in biplanar partial information conditions. For each comparison, the rib cage being assessed was removed from the database used for statistical model learning (“leave one out” procedure). Errors were computed in terms of line-to-line distances between rib midlines (30 equidistant points, i.e. 600 points per entire rib cage) and in terms of differences between geometrical parameters both for the first estimate and after the manual adjustments step.
Reproducibility
A subset of EOS X-rays dataset from twenty mild to severe scoliotic patients (mean Cobb angle 37°, range [8° 57°]) were used for reproducibility assessment. 3D reconstructions of rib cages were performed twice by three operators: two bio-medical engineers (B.A. and C.V.) and an orthopaedic surgeon (B.I.), all fully trained in the reconstruction method. The intra and inter-observer reproducibility were assessed for geometrical parameters by
computing the 95% confidence interval (95% CI) based on the normative method described in (ISO-5725 1994).
Manual processing times
In order to assess the reconstruction time, two times were measured: 1) for the rib cage first estimate: the time needed to manually digitalize anatomical landmarks and 2) the time needed for optional step of rib midlines manual adjustments. The computational time to generate the first estimate was negligible (a few seconds).
3. Results Accuracy
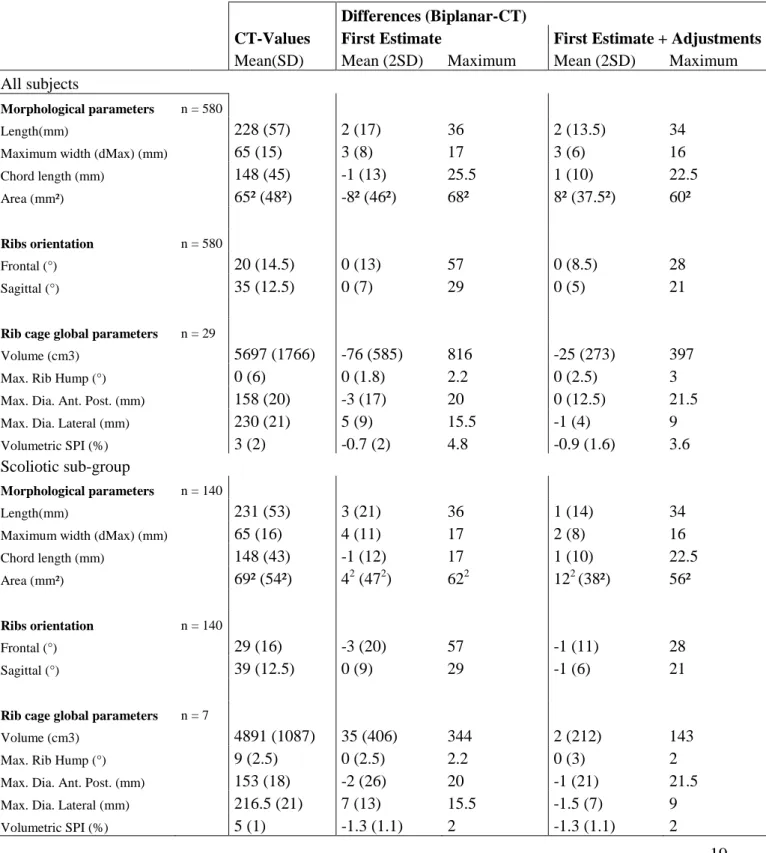
The mean error in line-to-line distance was 5.4 mm, a 2 RMS (Root Mean Square) of 13.5 mm and a maximum error of 35 mm for the first estimate, which reduced to 3.6 mm, 2 RMS of 8.8 mm and maximum of 24.3 mm after manual adjustments. An error map (Fig. 8) shows the repartition of the 95% CI (2 RMS) for the first estimate. The mean and variability (2 STD) parameter differences (Biplanar-CT) between 3D reconstruction from DRR and from CT-Scan are presented in Table 2. Mean differences in morphological parameters were 2 mm for rib length and 3 mm for maximum width. No systematical biases (mean≈0°) were observed for rib orientations. For the rib cage global parameters, maximum differences on the first estimate were 14% for rib cage volume, 13% for antero-posterior maximum diameter and 7% for lateral maximum diameter. Table 2 also reports results for the sub-group of scoliotic patients; accuracy for this group was similar to the whole population of study, but it can be observed that the adjustment step improved accuracy more in this group than in the non-scoliotic population.
Reproducibility
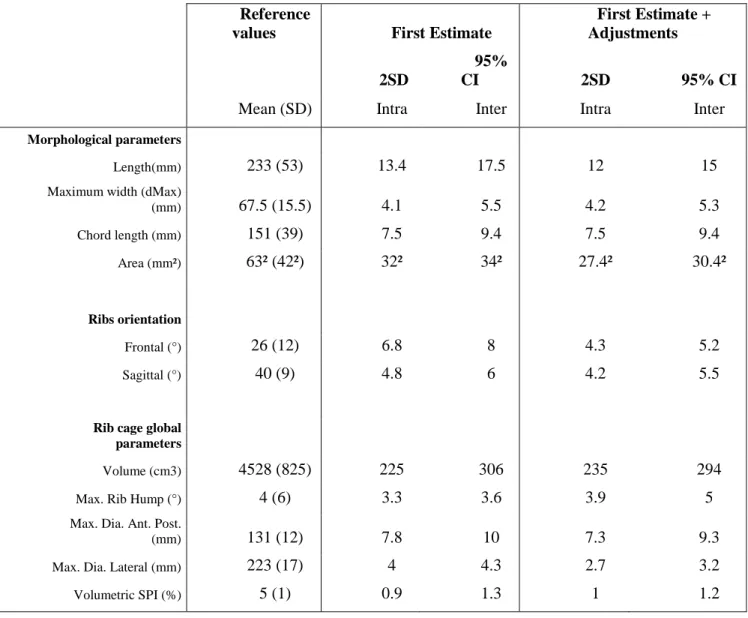
Results for the intra and inter-observer reproducibility study are presented in Table 3 for ribs morphological parameters, rib orientations and rib cage global parameters. On the first estimate, 95% CI were ± 306 cm3 for the rib cage volume, ± 3.6° for maximal rib hump, ± 10 mm and ± 4.3 mm for antero-posterior and lateral maximum diameters and, finally, ± 1.3% for volumetric spinal penetration index (SPI) . Adjustments improved the 95% CI mainly for rib orientations (improved of 2° to 3°) and rib area (232 mm²), the effect was less than 1% for
other parameters except for a slight increase (1.4°) for rib hump. Examples of 3D reconstructions are presented in Figure 9.
Manual processing times
From the first to the last anatomical landmark identified, the mean user-time was 2’30 minutes [1’50 - 6’10]. The total mean time needed for rib cage 3D reconstruction including adjustments step was 6 minutes [2’40 - 10’10].
4. Discussion
This study proposed a method for rib cage reconstruction from biplanar radiographs, using the statistical parametric model approach. The global purpose was to obtain in a short period of time, compatible with routine clinical use, a parametric rib cage surface controlled by rib midlines of few costal levels. Required identifications were therefore only needed for these ribs, and other costal levels were inferred. Then, a manual adjustment step allowed the refinement of rib midlines.
In Jolivet et al. (2010), our team had partially integrated this approach, although the rib cage was not fully parameterized and statistical inferences were not integrated.. In the present work, only a reduced set of 24 anatomical identifications was necessary both for normal and scoliotic rib cage global analysis. Moreover, identification of most posterior anatomical landmarks in the upper thoracic area (R1-R2-R3) were not very visible according to (Jolivet et al. 2010) due to shoulder superimposition. The proposed method did not require these points, preferring statistical inference to infer positions. When bone structures were visible, first estimate positions could be improved by manual adjustments. The identification of the sternum, which is often difficult, was simplified using a 3D template showing the sternum outline.
The shape accuracy of the proposed method, computed as line-to-line distances between ribs midline from biplanar DRR and CT-Scan, did not require registration since the referential frame was the same for both modalities. As a consequence, errors were not minimized due to the 3D/3D registration often used to align objects for comparisons. The error map (Fig. 8) revealed that maximum errors of reconstruction were localized on the rib anterior area. Rib bone tip and cartilage boundary were often not very clear in radiographs.
A PCA-model was used to infer trajectories of ribs R3,R4,R6,R7,R9 in surface parametric space, allowing realistic repartition of ribs along surface, by optimizing only ten parameters. Moreover, our parametric approach allowed rapid computing of the PCA using SPM parameters, instead of learning entire 3D coordinates of objects’ point cloud. Inter-individual variability of rib cage shape is high due to the nature of this structure. The statistical learning often used in statistical shape model methods requires the alignment of 3D models before capturing modes of deformation. In our case, the parametric bi-cubic surface was normalized in u, v coordinates that facilitate the learning and fast optimization. The computer processing time required to compute the first estimate was a few seconds on standard PCs (for instance, Intel Xeon CPU 3 GHz with 4 GB RAM) while rib manual adjustments were performed in real time.
Furthermore, the proposed hierarchical statistical parametric approach allowed the use of two sets of imaging data to teach the statistical models:
• The detailed description of rib surface and rib midline shape from accurate CT scan 3D reconstructions (acquisition in a supine position) were independent of the position and orientations of the ribs and trained the transverse inferences.
• The longitudinal inference yielding orientations and repartition of ribs were from biplanar radiographs 3D reconstruction carried out in the standing position.
The identification time was shortened (2’30) amounting to an average of manual processing time of 6 minutes for scoliotic patients when including manual adjustment step. Both accuracy and reproducibility assessments revealed that the first estimate was relevant and sufficient to obtain the main rib cage global parameters. Optional adjustments increased the shape accuracy of the rib midlines and reduced the error maxima that are essential for personalized finite element model (FEM) simulation.
Operators in this study were experienced with the reconstruction method and had the skills required to precisely identify the anatomical landmarks. In fact, there is a cognitive cost induced by these identifications: the user must learn to distinguish the costal level and discriminate between the right and left side of the posterior ribs in the LAT X-ray (which is the same limitation as in the method of Seoud et al. (2011)). Although training is required, users became experienced after a relatively fast learning curve considering the limited number
of identifications required. Generally, the reconstruction of ten patients with different shapes and X-rays conditions were sufficient, and the training took less than one day provided the user is familiar with chest X-rays. Therefore, this approach could be well suited for routine clinical use.
When anatomical landmarks are swapped (mis-assignment of left and right most posterior points in LAT view) or misplaced, descriptor parameters are impacted and the first estimate gives a less accurate solution. In routine clinical use, the mismatch between projected first estimate and radiograph information can confuse the users (Fig. 10). In fact, fast localized adjustments are sufficient to correctly adapt the model where the most important gaps occur. Adding an oblique radiographic view, as it was done by Dansereau and Stokes (1988) , would help discriminating ribcage left and right side. However, PA and LAT views are already performed in clinical routine, and adding a third radiography for ribcage reconstruction is not justified as it would increase the radiation dose induced to a class of patients who is already subjected to many X-ray and CT acquisitions during their lifetime. An algorithm is currently being developed for left and right disambiguation by computing the two solutions (from identified most posterior landmarks and virtually swapped landmarks) which will analyze the consistency between the rib hump angle and the vertebral axial rotation.
A morpho-realistic model of the ribs could be added in a future version in order to improve the realism of costo-transverse and costo-vertebral joints and link the two parametric models of vertebrae and ribs. Currently, the representation of ribs by elliptical tube surfaces was determined by statistical inferences and it could not be personalized. Therefore, its accuracy was not assessed, and did not affect global accuracy which was based on midlines only. On the other hand, the presence of rib outer surface eased the alignment of rib midlines during model adjustments (by showing the projected outline of rib surface, Figure 6d).
The EOS system (Dubousset et al. 2005) used in this study, allows simultaneous PA and LAT perpendicular digital radiograph acquisition in the standing position. This system is particularly well suited in the follow-up of adolescents who are likely to develop AIS because it involves very low radiation dose compared to a conventional radiograph system (Deschenes et al. 2010).
The proposed rib cage 3D reconstruction method is well designed for scoliotic patient follow-up, or clinical diagnosis for other abnormal deformities. To our knowledge, easy
access to the rib cage volume and orientation parameters, including the fundamental spinal penetration index, does not currently exist with such limited levels of X-ray exposure in the standing position.
5. Conclusion
This study has developed a fast and clinically relevant 3D reconstruction method, adapted both to non-deformed and deformed rib cages, with reported accuracy and reliability. Acknowledgements
This work was funded by Paris Tech BiomecAM chair on subject specific muscular skeletal modeling, and we express our acknowledgments to the chair founders: Cotrel foundation, Société générale, Protéor Company and COVEA consortium. We extend your acknowledgements to Alina Badina for medical imaging data, Alexandre Journé for his advices, and Thomas Joubert for his technical support.
Conflict of interest
References
Abul-Kasim, K. (2010). "Low-dose spine CT: optimisation and clinical implementation." Radiat Prot Dosimetry 139(1-3): 169-172.
Benameur, S., M. Mignotte, et al. (2005). "Three-dimensional biplanar reconstruction of scoliotic rib cage using the estimation of a mixture of probabilistic prior models." Ieee Transactions on Biomedical Engineering 52(10): 1713-1728.
Benameur, S., M. Mignotte, et al. (2001). 3D biplanar reconstruction of scoliotic vertebrae using statistical models. Computer Vision and Pattern Recognition, 2001. CVPR 2001. Proceedings of the 2001 IEEE Computer Society Conference on.
Clin, J., C. E. Aubin, et al. (2010). "Comparison of the biomechanical 3D efficiency of different brace designs for the treatment of scoliosis using a finite element model." Eur Spine J 19(7): 1169-1178.
Cootes, T. F., C. J. Taylor, et al. (1995). "Active Shape Models - Their Training and Application." Computer Vision and Image Understanding 61(1): 38-59.
Courvoisier, A., B. Ilharreborde, et al. (2013). "Evaluation of a 3D reconstruction method of the rib cage in scoliotic patients." Spine Deformity.
Cresson, T., B. Godbout, et al. (2008). "Surface reconstruction from planar x-ray images using moving least squares." Conf Proc IEEE Eng Med Biol Soc 2008: 3967-3970. Dansereau, J. and I. A. F. Stokes (1988). "Measurements of the three-dimensional shape of
the rib cage." Journal of Biomechanics 21(11): 893-901.
Deschenes, S., G. Charron, et al. (2010). "Diagnostic imaging of spinal deformities: reducing patients radiation dose with a new slot-scanning X-ray imager." Spine (Phila Pa 1976)
35(9): 989-994.
Drevelle, X., Y. Lafon, et al. (2010). "Analysis of idiopathic scoliosis progression by using numerical simulation." Spine (Phila Pa 1976) 35(10): E407-412.
Dubousset, J., G. Charpak, et al. (2005). "[A new 2D and 3D imaging approach to musculoskeletal physiology and pathology with low-dose radiation and the standing position: the EOS system]." Bull Acad Natl Med 189(2): 287-297; discussion 297-300.
Dubousset, J., P. Wicart, et al. (2003). "Spinal penetration index: new three-dimensional quantified reference for lordoscoliosis and other spinal deformities." J Orthop Sci 8(1): 41-49.
Dumas, R., A. Le Bras, et al. (2004). "Validation of the relative 3D orientation of vertebrae reconstructed by bi-planar radiography." Med Eng Phys 26(5): 415-422.
Dworzak, J., H. Lamecker, et al. (2010). "3D reconstruction of the human rib cage from 2D projection images using a statistical shape model." Int J Comput Assist Radiol Surg
5(2): 111-124.
Fitzgibbon, A., M. Pilu, et al. (1999). "Direct least square fitting of ellipses." Ieee Transactions on Pattern Analysis and Machine Intelligence 21(5): 476-480.
Humbert, L., J. A. De Guise, et al. (2009). "3D reconstruction of the spine from biplanar X-rays using parametric models based on transversal and longitudinal inferences." Med Eng Phys 31(6): 681-687.
Ilharreborde, B., J. S. Steffen, et al. (2011). "Angle measurement reproducibility using EOS three-dimensional reconstructions in adolescent idiopathic scoliosis treated by posterior instrumentation." Spine (Phila Pa 1976) 36(20): E1306-1313.
ISO-5725 (1994). "Accuracy (trueness and precision) of measurement methods and results." Johnston, C. E., B. S. Richards, et al. (2011). "Correlation of preoperative deformity
magnitude and pulmonary function tests in adolescent idiopathic scoliosis." Spine (Phila Pa 1976) 36(14): 1096-1102.
Jolivet, E., B. Sandoz, et al. (2010). "Fast 3D reconstruction of the rib cage from biplanar radiographs." Med Biol Eng Comput 48(8): 821-828.
Koehler, C., T. Wischgoll, et al. (2010). "Reconstructing the human ribcage in 3d with x-rays and geometric models." MultiMedia, IEEE 17(3): 46-53.
Laporte, S., W. Skalli, et al. (2003). "A biplanar reconstruction method based on 2D and 3D contours: application to the distal femur." Comput Methods Biomech Biomed Engin
6(1): 1-6.
Little, J. P., M. T. Izatt, et al. (2013). "An FE investigation simulating intra-operative corrective forces applied to correct scoliosis deformity." Scoliosis 8(1): 9.
Mitton, D., C. Landry, et al. (2000). "3D reconstruction method from biplanar radiography using non-stereocorresponding points and elastic deformable meshes." Medical and Biological Engineering and Computing 38(2): 133-139.
Mitton, D., K. Zhao, et al. (2008). "3D reconstruction of the ribs from lateral and frontal X-rays in comparison to 3D CT-scan reconstruction." J Biomech 41(3): 706-710.
Nie, W. Z., M. Ye, et al. (2009). "The patient-specific brace design and biomechanical analysis of adolescent idiopathic scoliosis." J Biomech Eng 131(4): 041007.
Pearce, M. S., J. A. Salotti, et al. (2012). "Radiation exposure from CT scans in childhood and subsequent risk of leukaemia and brain tumours: a retrospective cohort study." Lancet
380(9840): 499-505.
Penney, G. P., J. Weese, et al. (1998). "A comparison of similarity measures for use in 2-D-3-D medical image registration." IEEE Trans Med Imaging 17(4): 586-595.
Roberts, S. B. and P. H. Chen (1972). "Global geometric characteristics of typical human ribs." J Biomech 5(2): 191-201.
Sabourin, M., E. Jolivet, et al. (2010). "Three-dimensional stereoradiographic modeling of rib cage before and after spinal growing rod procedures in early-onset scoliosis." Clin Biomech (Bristol, Avon) 25(4): 284-291.
Sandoz, B., A. Badina, et al. (2013). "Quantitative geometric analysis of rib, costal cartilage and sternum from childhood to teenagehood." Med Biol Eng Comput.
Seoud, L., F. Cheriet, et al. (2011). "A novel method for the 3-D reconstruction of scoliotic ribs from frontal and lateral radiographs." IEEE Trans Biomed Eng 58(5): 1135-1146.
Tables
Table 1: Medical imaging data features
Number of subjects
EOS radiographs 57
Moderate scoliosis in pre-treatment by orthotic brace step for AIS Mean age 12 year old, range [9-14]
Mean Cobb angle 28° [17° 45°]
21 AIS in pre-surgery step
Mean age 15 year old, range [13-17] 36
CT Scans 29
Asymptomatic children
Mean age 12 year old, range [9-15] 15
AIS in pre-surgery step
(features non-available) 7
Asymptomatic adults (cadaveric specimens)
Mean age 72 year old, range [55-92] 7
Table 2: Accuracy results for parameters for all subject and for the sub-group of scoliotic
patients. Reference values were measured on 29 rib cage reconstructions from CT-Scan. Differences (biplanar – CT) for rib cage global parameters and rib morphological parameters were reported in parameter units (Areas are reported as their square root for easier reading, for example area of 652 mm² = 4225 mm2 is equal to the area of a 65 by 65 mm square) for the first estimate and including adjustments step.
Differences (Biplanar-CT)
CT-Values First Estimate First Estimate + Adjustments
Mean(SD) Mean (2SD) Maximum Mean (2SD) Maximum
All subjects
Morphological parameters n = 580
Length(mm) 228 (57) 2 (17) 36 2 (13.5) 34
Maximum width (dMax) (mm) 65 (15) 3 (8) 17 3 (6) 16
Chord length (mm) 148 (45) -1 (13) 25.5 1 (10) 22.5
Area (mm²) 65² (48²) -8² (46²) 68² 8² (37.5²) 60²
Ribs orientation n = 580
Frontal (°) 20 (14.5) 0 (13) 57 0 (8.5) 28
Sagittal (°) 35 (12.5) 0 (7) 29 0 (5) 21
Rib cage global parameters n = 29
Volume (cm3) 5697 (1766) -76 (585) 816 -25 (273) 397
Max. Rib Hump (°) 0 (6) 0 (1.8) 2.2 0 (2.5) 3
Max. Dia. Ant. Post. (mm) 158 (20) -3 (17) 20 0 (12.5) 21.5
Max. Dia. Lateral (mm) 230 (21) 5 (9) 15.5 -1 (4) 9
Volumetric SPI (%) 3 (2) -0.7 (2) 4.8 -0.9 (1.6) 3.6
Scoliotic sub-group
Morphological parameters n = 140
Length(mm) 231 (53) 3 (21) 36 1 (14) 34
Maximum width (dMax) (mm) 65 (16) 4 (11) 17 2 (8) 16
Chord length (mm) 148 (43) -1 (12) 17 1 (10) 22.5
Area (mm²) 69² (54²) 42 (472) 622 122 (38²) 56²
Ribs orientation n = 140
Frontal (°) 29 (16) -3 (20) 57 -1 (11) 28
Sagittal (°) 39 (12.5) 0 (9) 29 -1 (6) 21
Rib cage global parameters n = 7
Volume (cm3) 4891 (1087) 35 (406) 344 2 (212) 143
Max. Rib Hump (°) 9 (2.5) 0 (2.5) 2.2 0 (3) 2
Max. Dia. Ant. Post. (mm) 153 (18) -2 (26) 20 -1 (21) 21.5
Max. Dia. Lateral (mm) 216.5 (21) 7 (13) 15.5 -1.5 (7) 9
Table 3: Reproducibility of intra and inter-observer results with 95% CI expressed in
parameter units for both first estimate solution and including manual adjustments step (Areas are reported as their square root for better reading, for example area of 652 mm² = 4225 mm2 is equal to the area of a 65 by 65 mm square)
Reference
values First Estimate
First Estimate + Adjustments 2SD
95%
CI 2SD 95% CI
Mean (SD) Intra Inter Intra Inter
Morphological parameters
Length(mm) 233 (53) 13.4 17.5 12 15
Maximum width (dMax)
(mm) 67.5 (15.5) 4.1 5.5 4.2 5.3 Chord length (mm) 151 (39) 7.5 9.4 7.5 9.4 Area (mm²) 63² (42²) 32² 34² 27.4² 30.4² Ribs orientation Frontal (°) 26 (12) 6.8 8 4.3 5.2 Sagittal (°) 40 (9) 4.8 6 4.2 5.5
Rib cage global parameters
Volume (cm3) 4528 (825) 225 306 235 294
Max. Rib Hump (°) 4 (6) 3.3 3.6 3.9 5
Max. Dia. Ant. Post.
(mm) 131 (12) 7.8 10 7.3 9.3
Max. Dia. Lateral (mm) 223 (17) 4 4.3 2.7 3.2
Figures
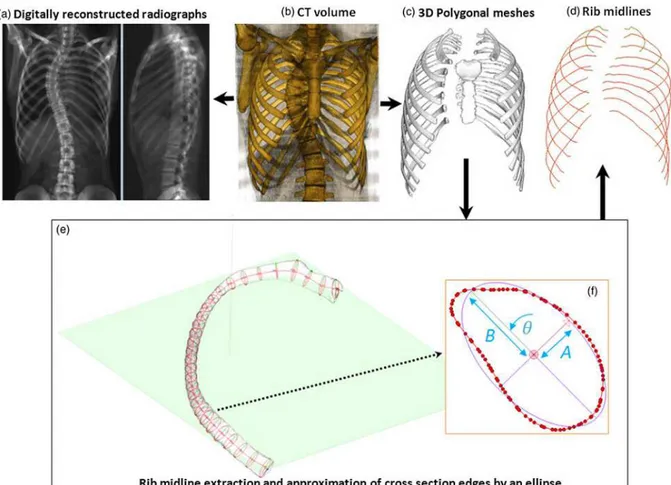
Figure 2: Data extraction from CT scans: The CT volumetric dataset (b) was used to compute two digital reconstructed radiographs (a) and to perform the 3D reconstruction (c).
The rib outer surfaces were cut by thirty cross sectional planes to extract rib midlines (d-e). The shape of each cross section was approximated by an ellipse (f).
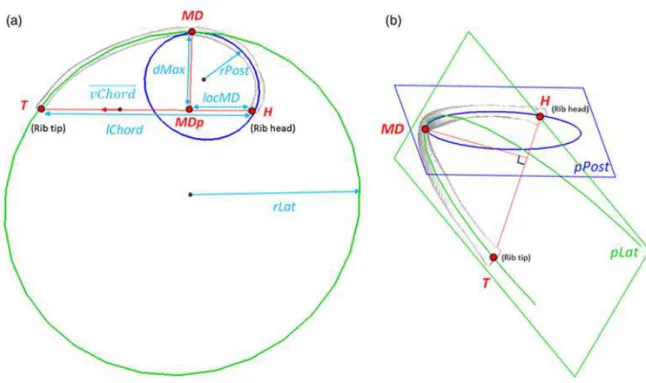
Figure 3: parameters of a rib midline (a): transverse plane view, (b) frontal plane view. Nomenclature: H (insertion joint with vertebrae, or rib head), T (anterior extremity, or rib tip),
MD (point corresponding to maximal distance between rib midline curve and its orthogonal projection on the chord segment), MDp (orthogonal projection of MD in the chord line
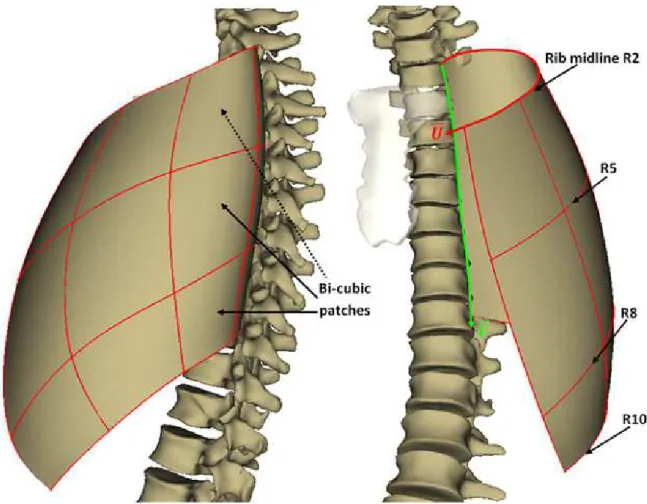
Figure 4: Network of cubic splines (red) controlling the bi-cubic surface of the thorax for both left and right sides. Rib midlines R2, R5, R8 and R10 gave the global shape of the rib
cage surface. A curvilinear frame in [U, V] coordinates was associated with the bi-cubic surface.
Figure 5: Effects of the two first mode of deformations for parameterized trajectory on surface (V coordinates) reconstructed from PCA-model for ribs R3 to R9 (R2 and R10 were
Figure 6: From identifications to first estimate: a) Anatomical landmarks digitalized on both radiographs (left and right side was plotted in yellow and blue) : tip of ribs R2-R5-R8 in frontal views and tip of R10 in both views; most lateral point in PA view of ribs
R2-R5-R8-R10; most posterior points of ribs R5-R8-R10 in LAT view ; b) inference of rib chord and midline (white) for right side with representation of ±2SEE estimation of inferred MD points
by ellipsoids; c) Refinement of midlines to enclose identification projection lines and computation of the bi-cubic rib cage surface; d) resulting 3D reconstruction views in projection and 3D view. Remaining ribs estimated with PCA-based model were showed as
Figure 7: Rib cage global parameters: a) maximum antero-posterior and lateral diameters and maximal rib hump angle computed in transversal planes; b) volume of rib cage; c) transversal (left) and lateral (right) views of volumetric spinal penetration
Figure 8: Errors map of the first estimate reconstruction. Color bar values represented the 95% CI of line-to-line distances computed using the 29 rib cages from CT-Scan.
Figure 9: Three 3D reconstruction examples of scoliotic patients from the reproducibility study. The black outline represented the projected silhouettes of 3D
Figure 10: Example of a rib 3D reconstruction first estimate (a) and solution including manual adjustments (b). The four green control points of rib midline served to adjust the rib until a good matching was observed between the projected silhouettes of rib surface and