Supporting information
Toxicity and subcellular fractionation of yttrium in
three freshwater organisms: Daphnia magna,
Chironomus riparius and Oncorhynchus mykiss.
Authors: Pierre-Yves Cardon1, Gaëlle Triffault-Bouchet2, Antoine Caron1,Maikel Rosabal3, Claude Fortin4, and Marc Amyot1*
1 GRIL, Université de Montréal (UdeM), Département de sciences biologiques, Pavillon Marie-Victorin, 90 avenue Vincent-d’Indy, Montréal (Québec), Canada, H3C 3J7 2 Centre d’expertise en analyse environnementale du Québec (CEAEQ), Division de
l’écotoxicologie et de l’évaluation du risque, 2700 rue Einstein, Québec (Québec), Canada, G1P 3W8
3 GRIL, Université du Québec à Montréal (UQAM), Département des sciences
biologiques, 141 avenue du président-Kennedy, Montréal (Québec), Canada, H2X 1Y4 4 Institut National de la Recherche Scientifique, Centre Eau Terre Environnement (INRS-ETE), 490 rue de la Couronne, Québec (Québec), Canada, G1K 9A9
*Corresponding author: e-mail address: m.amyot@umontreal.ca; Phone 1-514-343-7496. Authors’ e-mail addresses: m.amyot@umontreal.ca -
gaelle.triffaultbouchet@mddelcc.gouv.qc.ca - antoine.caron@mddelcc.gouv.qc.ca - rosabal.maikel@uqam.ca - claude.fortin@ete.inrs.ca
Material and method
BioassaysDaphnia magna
A 7-day D. magna growth test was performed in semi-static conditions (water renewed daily) at a hardness of 130 mg L-1 of CaCO3. The reconstituted water and the adjustment of its hardness were made according to USEPA protocols1 (Table S1). D. magna neonates (<24 h) were exposed individually in reconstituted water at five nominal Y
concentrations: 0, 200, 400, 800, 1200 µg L-1 with 10 replicates per treatment (10 experimental units per treatment). Additional experiments at 66 and 90 mg CaCO3 L-1 were also performed.
Every day, each D. magna was transferred, with a polypropylene (PP) pipette, in a new PP beaker containing 24 mL of the contaminated water. Since the presence of algae can affect the Y bioavailability via complexation with cellular exudates, the addition of algae as food source (5.105 cells of Pseudokirchneriella subcapitata mL-1) was delayed for 6 hours after the daily transfer of D. magna. To assess Y exposure over the testing period, the concentration of dissolved Y was measured before the transfer of the organisms (t = 0 h), at 6 hours (before the addition of algae) and at 24 h every two days. Moreover, hardness, pH, temperature, and conductivity were measured daily. The size of each
D. magna, from the top of the head to the end of the tail spine, was measured under a
Chironomus riparius
A 10-day sediment growth test with a sediment collected from Lac Croche at the Station de biologie des Laurentides (QC, Canada), spiked with Y (52, 144 and 450 mg kg-1 dried weight, dw), was carried out with C. riparius as described elsewhere2. C. riparius were exposed by thirty with 3 replicates per treatment (3 experimental units per treatment). Details of the preparation of the Y spiked sediment and of the characteristics of the natural sediment are given in the section “exposure medium”.
The test was conducted in static conditions. Experimental chambers consisted of glass jars filled with 170 g of the sediment previously spiked with Y and 900 mL of
reconstituted water (Table S1). A one-month aging period for this experimental medium was set with a renewal of 80% of the water at the end. After this period, thirty organisms (<48 h old after hatching) were introduced in each jar. Organisms were fed all along the test with 1.5 mL of a fish flake suspension of Tetramin® (10 g L-1). Over the test temperature was set at 21.7 °C and water was aerated continuously.
The concentration of dissolved Y in the water was measured at days 1, 5, and 10. The total concentration of Y in the sediment was measured before the beginning of the test. At the end of the assay, C. riparius were transferred in PP jars filled with 500 mL of
reconstituted water free of Y for 24 hours to clean their gut content. Then, they were counted, measured, rinsed in 1 mM EDTA solution to remove Y adsorbed to their body surface, dried with Kimwipe sheets and pooled in 1.5 mL preweighed and acid washed PP microcentrifuge tube, weighed, and stored at -80°C.
Oncorhynchus mykiss
A 28-day growth test with five Y concentrations (0, 250, 500, 1000 and 2000 µg L-1) was conducted with O. mykiss according to the international standard ISO 102293 with some modifications. The ISO protocol was modified to limit the amount of water spiked with Y. Thus, experimental chamber size as well as initial fish weight were lower than those recommended by ISO. In addition, the renewal time for the exposure medium was extended, the test water being renewed every 48 hours (ISO recommendation: daily). At the beginning of the assay, all fish weighed more than 2.0 g and less than 3.1 g (ISO recommendation: ≥3.0 g). For each concentration tested, ten individuals of O. mykiss were exposed in 20 L of Y spiked reconstituted water (SI, Table S1), in semi-static conditions, 80% of the test water being renewed every 48 hours. The water hardness was set at 45 mg L-1 of CaCO3.
The experimental chambers consisted of a PP bag set in a glass aquarium. Trout were fed twice daily at a rate of 2% of body weight per day with a commercial feed (Skretting Nutra XP). To minimize the dissolved Y lost because of Y complexation to food and faeces, remaining food and faeces were removed with a 50-mL glass pipette one hour after the feeding period. Total organic carbon, as well as total and dissolved Y
concentrations were measured at t = 0 h (after the renewal of the water), at t = 24 h and at t = 48 h (before the renewal of the water); these measurements were repeated four times during the experiment. pH, temperatures and conductivity were measured daily.
At the beginning of the assay, fish were anesthetized with clove extract (Lotus Aroma), sized and weighed. The weight difference between each batch of ten fish was lower than 10% of the average weight of the five batches. After 14 days, fish were anesthetized,
sized, and weighed for a second time. This operation was repeated a last time at the end of the experiment. An average growth rate for the fish as a function of Y exposure was assessed with the size measured at day 0, 14, and 28. Finally, for each exposure level, fish livers were extracted with a surgical steel razor blade and pooled by three in 1.5 mL preweighed and acid-washed PP microcentrifuge tubes, weighed, and stored at -80 °C.
Exposure medium
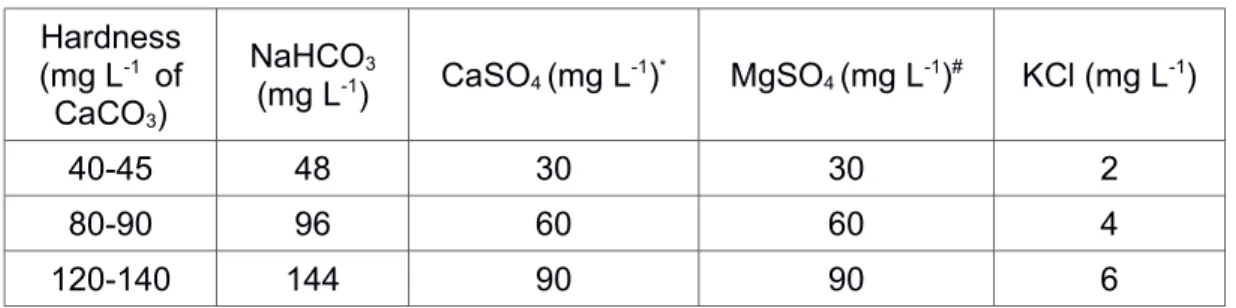
Recipe of the reconstituted water used in our bioassay is given in Table S1. This reconstituted water was made according to USEPA3 and is adapted for bioassay on our three organisms. Preparation of the Y spiked sediment used for C. riparius bioassay is described in this section.
Water medium Hardness (mg L-1 of CaCO3) NaHCO3 (mg L-1) CaSO4 (mg L-1)* MgSO4 (mg L-1)# KCl (mg L-1) 40-45 48 30 30 2 80-90 96 60 60 4 120-140 144 90 90 6
Table S1: Recipe for the making of the reconstituted water
Reconstituted water was aerated 24 h before the beginning of the assay. Then, 2 to 5 µg of selenium was added per liter. The pH was adjusted at 7.8-7.9 with HCl 10%.
* (CaSO
4. 2H2O) # (MgSO
Sediment exposure medium
Sediment and water were collected from Lac Croche at the Station de biologie des
Laurentides. Several parameters including, total organic carbon, NH3-N, Ntotal, Ptotal, Stotal, pH, water content, trace metal concentrations, main anions and cations and REE
concentrations were measured in the sediment and the water (Table S2). The sediments were then freeze-dried in PP bags. Then, 150 g dw-samples of the freeze-dried sediment, corresponding to the four tested exposure concentrations (0, 50, 100, and 450 mg Y kg-1 dw) were spiked with 850 mL of lake water previously mixed with an Y standard solution (10,000 µgY ml-1 Y in 3 % by wt HNO3, TraceCert®, FLUKA) at a given concentration. The volume of water added was measured to reach the initial humidity percentage of the sediment and the water pH was adjusted to 7.4 with NaOH 1 N or HCl 10 %. Spiked sediments were then mixed 5 minutes every day for 3 days before being stored at -20 °C. For each concentration, two sediment samples were collected before storage to measure their total yttrium concentrations. Sediments were thawed 2 days at ambient temperature before the beginning of the assays.
Sediment Water Nitrogen total 16900 mg N kg-1 0.18 mg N L-1 Organic carbon 28.4% P/P (total) 4.2 mg C L-1 (dissolved) Phosphor total < 200 mg P kg-1 < 0.002 mg L-1
Sulfur 6990 mg S kg-1 (total) 1.7 mg L-1 (sulphate)
Calcium 4820 mg kg-1 1.9 mg L-1
Potassium 59 mg kg -1 0.08 mg L-1
Magnesium 780 mg kg-1 0.30 mg L-1
Sodium 174 mg kg-1 0.70 mg L-1
Y 14.7 mg kg-1 0.19 µg L-1
Table S2: Chemical parameters of the Lac Croche’s sediment and water
Subcellular fractionation
Preparation of D. magna sample
At least 50 individuals of D. magna were needed to get an adequate sample weight for the subcellular fractionation procedure and chemical analyses. As a result, it was impossible to use the D. magna survivors (<10) at the end of their bioassay for
subcellular analysis, unlike C. riparius and O. mykiss. Therefore, following the D. magna growth test a new assay at the same range of Y exposure levels were started with 300 individuals and a PP bag filled with 15 L of Y spiked reconstituted water as experimental chamber. This new assay was conducted in the same conditions as described previously. At the end of the assay, D. magna were transferred, firstly for 4 hours in 15 L of
reconstituted water free of Y to clean their gut content, and secondly for 5 minutes in 2 L of a 1 mM EDTA4 solution to remove the adsorbed Y on their bodies. After being rinsed in MilliQ water, they were dried with Kimwipe sheets, pooled by 50 in 1.5 mL
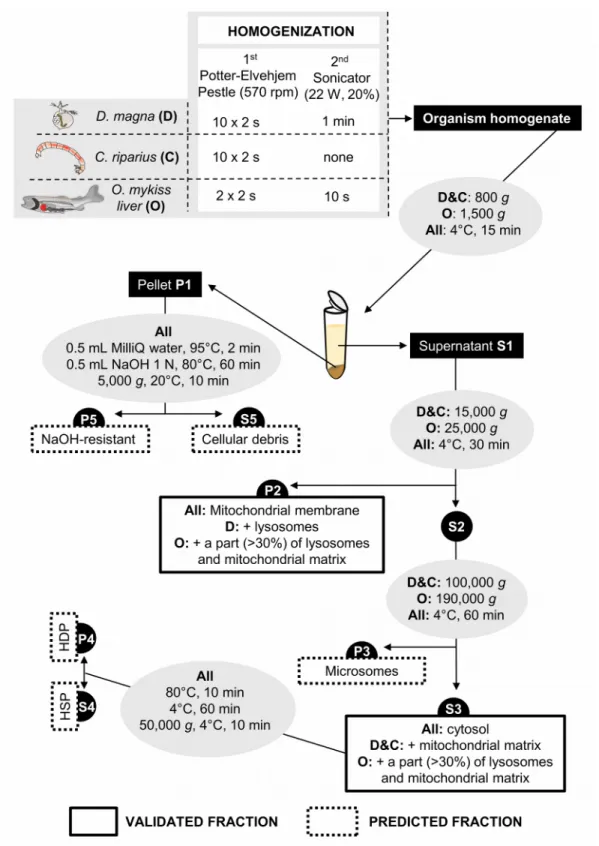
Subcellular fractionation protocol
Figure S1 - Subcellular fractionation protocol for each organism (D: D. magna;
were performed using an IEC Micromax centrifuge (Thermo IEC) whereas a WX
ULTRA 100 centrifuge (Sorval, Ultra Thermo Scientific) equipped with a F50L-24 X1.5 rotor (Fisher Scientific) was used for ultracentrifugation (≥ 25,000 g).
Results
Bioassay exposure monitoring
Several physico-chemical parameters were monitored during the bioassays on our three organisms, in particular the concentration of Y dissolved in the exposure medium. Results of these monitoring are presented in Tables S2, S3 and S4 respectively for
D. magna, C. riparius and O. mykiss. Plus, Y speciation at the beginning of each test is
presented in table S5.
For Daphnia, Y exposure levels remained steady between water renewals. Measured dissolved Y concentrations were close to the nominal ones, with a ratio ranging from 96 to 107% on average (Table S2).
For C. riparius, for the maximal exposure level, dissolved Y concentration in the water column raised from 14 ± 2 µg L-1 at the beginning of the bioassay to 42 ± 8 µg L-1 by the end (Table S3). This increase is presumably caused by a release of Y from the sediments, which contained 465 mg Y kg-1 dw.
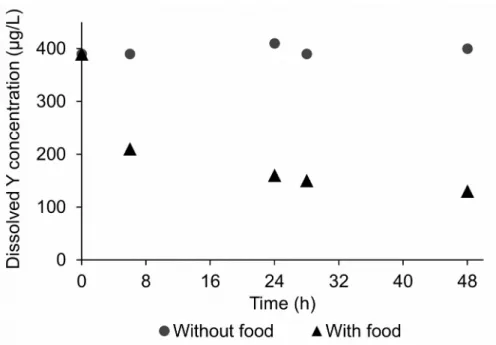
For O. mykiss, a sharp decline of measured dissolved Y concentration between water renewals was observed. Thus, our nominal exposure levels of 250 and 500 of µg L-1 yielded measured levels of only 8 ± 3 and 16 ± 9 µg L-1 of dissolved Y, 24 hours after the medium renewal (Table S4). Binding of Y with the organic matter from the food and
O. mykiss faeces likely explains this loss. Indeed, a preliminary experiment monitoring
dissolved Y depletion in a Y-spiked water in the presence or absence of food (Fig. S2) showed a decrease of 61% after 24 hours in water with food and no significant Y loss in the absence of food.
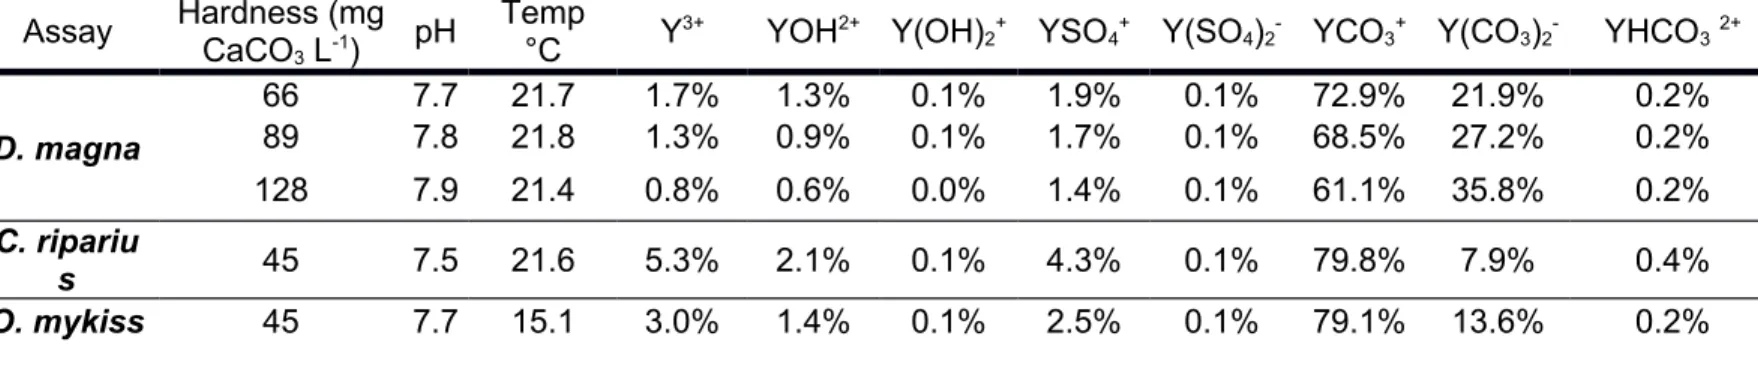
For every test, Y was mainly present in the form of YCO3 (61-80%) (Table S5). Bioassay # Hardness (mg L-1of CaCO3) pH Temp (°C) Nominal [Y] Measured [Y] after medium renewal Measured [Y] before medium renewal Average measured [Y] over 24 h 1 66 ± 1 7.7 ± 0.1 21.7 ± 0.2 0 - 0.14 ± 0.01 -50 45 ± 3 52 ± 2 49 ± 5 100 92 ± 1 105 ± 7 99 ± 9 200 178 ± 4 200 ± 17 191 ± 17 400 375 ± 9 400 ± 20 388 ± 19 2 89 ± 1 7.8 ± 0.1 21.8 ± 0.1 0 - 0.3 ± 0.1 -100 98 ± 6 118 ± 5 107 ± 12 300 - - -500 480 ± 19 508 ± 25 492 ± 25 700 686 ± 17 730 ± 29 706 ± 32 3 128 ± 3 7.9 ± 0.2 21.4 ± 0.1 0 - 0.2 ± 0.0 -200 190 ± 10 213 ± 15 202 ± 17 400 - - -800 790 ± 10 807 ± 6 798 ± 12 1200 1170 ± 60 1203 ± 6 1187 ± 43
Table S3 - Observed exposure conditions for D. magna. Yttrium concentrations are given
Nominal sediment [Y] (mg kg-1 dw)
pH Temp °C Hardness
(mg L-1of CaCO3)
Measured sediment [Y] (mg kg-1dw)
Measured dissolved [Y]
1st day 0 7.4 21.6 ± 0.2 43.8 15 ± 1 50 7.5 21.6 ± 0.1 42.5 53 ± 7 100 7.5 21.7 ±0.1 44.7 99 ± 30 450 7.6 21.6 ± 0.3 48.5 465 ± 6 5th day 0 7.5 21.7 ± 0.1 - -52 7.5 21.7 ± 0.1 - -100 7.5 21.8 ± 0.1 - -450 7.6 21.7 ± 0.2 - -10th day 0 7.5 21.9 46.7 -52 7.5 21.8 ± 0.1 44.2 -100 7.5 21.8 ± 0.1 44.5 -450 7.6 21.9 ± 0.3 50.1
-Table S4 - Observed exposure conditions for C. riparius Nominal [Y] (µg L-1) pH Hardness (mg L-1 of CaCO3) TOC (mg L -1of C) Temp (°C) Measured dissolved [Y] (µg L-1)
Ratio [Y]dissolved/ [Y]nominal 0 h (after the medium renewal) 0 - - -15.1 ± 0.1 0.12 ± 0.01 -250 - - - 123 ± 25 49% 500 - - - 280 ± 1 56% 1000 - - - 700 ± 57 70% 2000 - - - -* -24 h (between two medium renewal) 0 7.6 44 ± 1 -15.2 ± 0.1 0.13 ± 0.01 -250 7.8 ±0.1 45 ± 1 - 8 ± 3 3% 500 7.7 45 ± 1 - 16 ± 9 3% 1000 7.7 45 ± 1 - 433 ± 6 43% 2000 7.7 44 - 1300* 65% 48 h (before a medium renewal) 0 7.6 45 ± 2 1.40 ± 0.15 15.1 0.1 ± 0.1 -250 7.8 ± 0.1 46 1.80 ± 0.15 4 ± 2 2% 500 7.7 45 ± 1 2.00 ± 0.05 5 ± 2 1% 1000 7.8 43 2.90 ± 0.01 250 ± 85 25% 2000 - - - 920* 46%
Table S5 - Observed exposure conditions for O. mykiss. *all fish were dead after 2 days
of exposure for this Y concentration. As a result, only one measurement could be made at this concentration.
Table S6 - Yttrium speciation at the beginning of each test. Speciation analyses were
performed with WHAM software version 7.0.1.
Assay Hardness (mg
CaCO3 L-1) pH
Temp
°C Y3+ YOH2+ Y(OH)2+ YSO4+ Y(SO4)2- YCO3+ Y(CO3)2- YHCO32+
D. magna 66 7.7 21.7 1.7% 1.3% 0.1% 1.9% 0.1% 72.9% 21.9% 0.2% 89 7.8 21.8 1.3% 0.9% 0.1% 1.7% 0.1% 68.5% 27.2% 0.2% 128 7.9 21.4 0.8% 0.6% 0.0% 1.4% 0.1% 61.1% 35.8% 0.2% C. ripariu s 45 7.5 21.6 5.3% 2.1% 0.1% 4.3% 0.1% 79.8% 7.9% 0.4% O. mykiss 45 7.7 15.1 3.0% 1.4% 0.1% 2.5% 0.1% 79.1% 13.6% 0.2%
Figure S2 – Dissolved Y concentration in reconstituted water supplied with or without
food over a 48-hour period. Bioassay toxicity results
Toxicity results from the bioassays performed on D. magna, C. riparius and O. mykiss are presented in this section.
D. magna
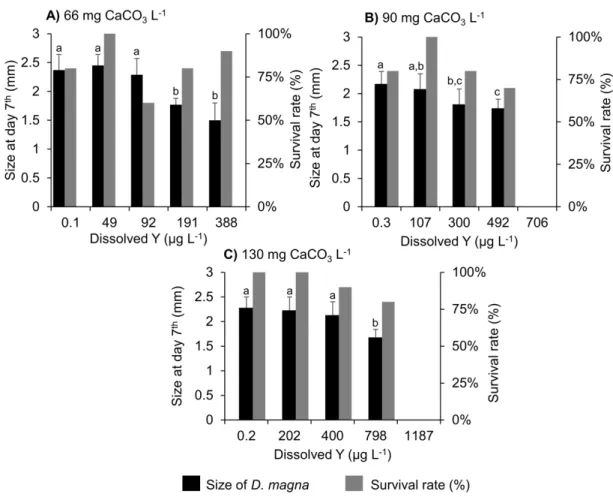
D. magna size after a seven-day exposure period to a Y exposure concentration range in
three water media of differing hardness is showed in Fig. S3.
Regardless of the water hardness, a decline of D. magna size at the end of the bioassay with increasing Y levels was assessed (Fig. S3). In addition, a covariance analysis
(ANCOVA) performed on the significant linear regression (p< 0.001) established at each hardness between Y exposure level and D. magna size, showed a significant difference between the linear regression evaluated at 130 mg L-1 of CaCO3 and those evaluated for the other two hardnesses. It suggests a significant impact of medium hardness on Y effect on D. magna size.
Figure S3 – Effect of Y on D. magna size (mean ± SD; n = 6-10) and survival after a
seven-day exposure period in three water mediums of differing hardness: A) 66 B) 90 C) 130 mg CaCO3 L-1. Error bars represent standard deviations. Different letters indicate significant difference of D. magna size at day 7 depending on the Y exposure level (ANOVA followed by Tukey pairwise comparison test, p < 0.05)
Chironomus riparius
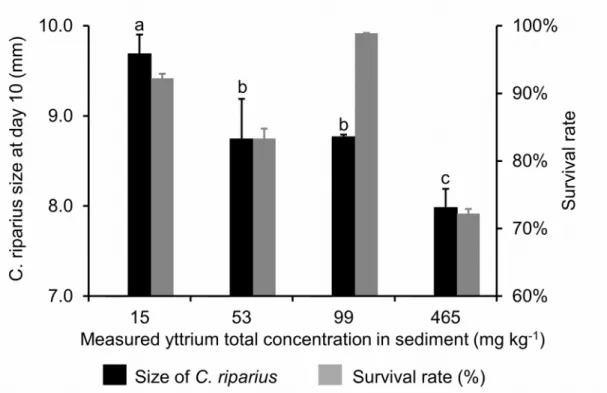
C. riparius size and survival rate at the end of the ten-day bioassays performed on this
organism is presented in Fig. S4.
A significant decline of C. riparius size was measured from an exposure of 53 mg kg-1 dw and was even more enhanced at 465 mg kg-1 dw (Fig. S4). Nonetheless, even if the lowest survival rate, 72 ± 1%, was measured at this latter exposure level, none significant shifting of survival rate was assessed depending on the Y exposure level.
Figure S4 – Effect of Y on C. riparius size and survival (n = 30) after a 10-day exposure
period (mean ± SD). Error bars represent standard deviations. Different letters indicate significant difference of C. riparius size or survival rate at day 10 depending on the Y exposure level (ANOVA followed by Tukey pairwise comparison test, p < 0.05)
Oncorhynchus mykiss
O. mykiss size and weight at the beginning, the middle and at the end of the 28-day
bioassay performed on this organism are presented in Fig. S5 (A) and (B) respectively.
A significant decrease of O. mykiss size and weight at 500 µg L-1 was observed from the 14th day on (Fig. S5). However, at the end of the bioassay this size decrease was no longer significantly different from the O. mykiss size measured for a Y exposure level of 250 µg L-1 (Fig. S5 A). Though, O. mykiss weight for the Y exposure level of 500 µg L-1 of Y at the end of the bioassay remained significantly different from the two other levels (Fig. S5 B). Indeed, at this last day of the 28-day bioassay, at the maximal exposure level,
O. mykiss weighed on average 3.9 ± 0.4 g against 4.8 ± 0.3 g for the two others Y
Figure S5: Effect of yttrium on O. mykiss size (A) and wet weight (B) over a 28-day
exposure period (mean ± SD; n = 9). Yttrium exposure concentrations are presented as nominal for simplicity. Error bars represent standard deviations. Different letters indicate significant difference of O. mykiss size or weight at day 0, 14 and 28 depending on the yttrium exposure levels (ANOVA followed by Tukey pairwise comparison test, p < 0.05)
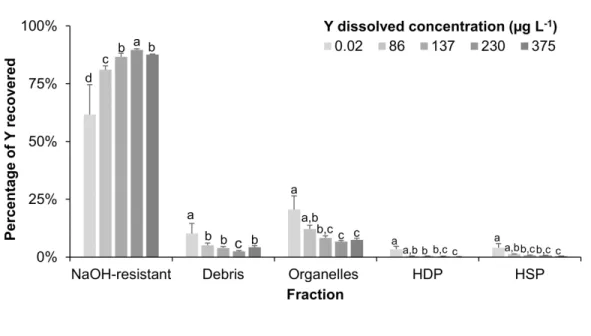
Yttrium subcellular fractionation in D. magna after a 24 h exposure period A complementary experiment involving an exposure of D. magna to Y over 24 h was performed in addition to the 7 days exposure growth test. Percentage of Y collected in each subcellular fraction of D. magna after this 24 h exposure period is given in Figure S6.
A significant decline in the proportion of Y in organelles (mitochondrial membranes, lysosomes and microsomes), from 21 ± 6% to 7 ± 1%, with a concomitant increase in the NaOH-resistant fraction, from 62 ± 13% to 88.1 ± 0.1%, along the exposure range, was observed (Fig. S6).
Figure S6 - Percentage of Y recovered in each fraction of D. magna (mean ± SD; n = 5)
following the exposure level after a 24-h exposure period. Different letters indicate a significant difference of percentage of Y recovered among fractions for a given Y exposure level (ANOVA, followed by Tukey pairwise comparison test, p < 0.05).
Yttrium concentration by subcellular fractions
Concentrations of Y in each fraction expressed as amount of Y by dried weight of fraction are presented in Table S7. For D. magna, Y concentration in NaOH-resistant fraction were at least three times higher than others. Plus, Y concentration in D. magna fraction appeared constant over our exposure range (Table S7). In contrast, Y
concentration in C. riparius and O. mykiss liver fractions increased along the exposure range. In C. riparius, mitochondrial membranes and NaOH-resistant fraction showed the highest Y concentrations, on average 12 mg kg-1 dw at the maximal exposure level. Finally, in O. mykiss liver Y concentrations in every fraction were very close for an exposure of 250 µg Y L-1. However, at 500 µg Y L-1, Y concentration in microsome was on average 1.75 times superior than other fractions (Table S7).
D. magna C. riparius
Y exposure level 198 396 795 15 52 93 465
Unity µg Y L-1 (dissolved) mg Y kg-1 sediment dw (total)
NaOH-resistant 204 4 ± 711 512 ± 101 206 2 ± 1342 0.6 ± 0.1 2 ± 0.4 4 ± 1 12 ± 4 Mitochondrial membranes 163 ± 80 165 ± 121 147 ± 11 0.4 ± 0.1 2 ± 0.4 4 ± 2 12 ± 3 Microsomes 8 ± 4 7 ± 3 13 ± 6 0.2 ± 0.0 0.6 ± 0.2 2 ± 0.3 5 ± 1 HDP 3 ± 2 10 ± 2 8 ± 4 0.1 ± 0.0 0.4 ± 0.1 0.9 ± 0.2 2 ± 0.6 MSF 166 ± 81 175 ± 123 155 ± 15 0.5 ± 0.1 2 ± 0.5 5 ± 2 14 ± 3
Table S7 - Concentrations of Y (mean ± SD; n = 3; mg Y kg -1 dw) in each fraction. Concentrations are expressed as amount of Y by dried weight of fraction. Cellular debris and HSP fractions were not freeze dried because of the NaOH and Tris/Sucrose buffer
they contained respectively at the end of their fractionation. Therefore, concentrations were not measurable for these two fractions

pHHardness(mg L-1 ofCaCO3)TOC (mg L-1of C) Temp (°C ) Measureddissolved[Y] (µg L-1 )](https://thumb-eu.123doks.com/thumbv2/123doknet/12505021.340613/13.918.24.899.180.688/table-observed-exposure-conditions-riparius-nominal-phhardness-measureddissolved.webp)