J’estime qu’entre 1936 et 1937 je mangeai sans payer au comptoir de
Capoulade entre mille et mille cinq cents croissants. J’interprétais cela
comme une sorte de bourse d’études que l’établissement me consentait.
J’ai conservé une très grande tendresse pour les croissants. Je trouve que leur
forme, leur croustillance, leur bonne chaleur, ont quelque chose de
sympatique et d’amical. Je ne les digère plus aussi bien qu’autrefois et nos
rapports sont devenus plus ou moins platoniques. Mais j’aime les savoir là,
dans leur corbeille, sur le comptoir. Ils ont fait plus pour la jeunesse
estudiantine que la troisième République.
Romain Gary - La promesse de l’aube.
Ma thèse est terminée, relue, corrigée, relue, corrigée. Dans deux mois aura
lieu la soutenance. Une nouvelle fois, ma vie commence et tout reste à faire.
Samuel Page - L’apiculture selon Samuel Beckett.
v
A
CKNOWLEDGMENTS
First of all, I would like to thank Timo Götzelmann and Brygg Ullmer for reviewing this thesis, as well as Emmanuel Dubois, Julie Lemarié and Valérie Maquil for accepting to be part of the jury. I am very honored and looking forward to discussing my work with them.
There have been a lot of ups and downs during these last three years and I am indebted to many people for making the “ups” very intense and the “downs” not too bad, or at least bearable. Obviously, I must first thank Bernard, Christophe and Marc, my official and unofficial supervisors. Since my very first day at the laboratory, more than five years ago, and despite the fact that I was very new to the field of computer science, they have trusted me and accompanied me in every step on my path towards becoming a researcher. I especially want to thank Bernard and Marc who, because they were in Toulouse and not in Singapore, had no choice but to attend every single meeting and rehearsal, answer every single question I had and test every single version of my experiments. Without their availability, kindness, support, humour and good mood, these years would certainly have had a very different flavor. And a special thanks to Marc for devoting so much time in the Tangible Box; your help and continuous support are very much appreciated!
Within the professional sphere, I am also thankful to the Elipse team, and in particular to its PhD students. I was lucky enough to be welcomed by the previous generation of PhD students, namely Anke, Damien A., Laurent, Lilian, Loupi and Victor, who made me feel at home at IRIT, while giving me lots of pieces of advice and tips on how to survive a thesis. I particularly want to thank Damien A. for offering me a beautiful plant as well as Anke: she has always been keen to give me pieces of advice and to answer my questions, she also helped me throughout the process of applying for the EMEA Anita Borg Google Scholarship and it was a great pleasure to collaborate with her on a book chapter. As for the new PhD students, although setting up a “student lunch” with them is slightly more difficult than it used to be, it is always a pleasure to spend time with them, be it at the lab or at the pub. So thank you Agniezska, Gary, Houssem, Matthieu and Sandra for the discussions and laughs we had together and good luck with your thesis! I am also thankful to Ludovic, Nicolas and Paul, three previous interns: they made my role of “supervisor” very pleasant and easy to perform and their work has opened up very interesting perspectives.
My supervisors and colleagues support would not have been as helpful and essential if I had not been able to conduct experiments. For this, I am very sincerely and immensely grateful to all the people who took part in my studies. Not only did they accept to give their time, but they did it with a lot of kindness and good will. I also want to thank Claude Griet, who has been responsible for contacting the participants and organizing their venue and without whom conducting experiments would have been much more difficult. Finally, I want to thank Laurence Boulade, Nathalie Bedouin and Abdelghani Benabdallah, from the Institut des Jeunes Aveugles, for sharing their expertise and giving insightful feedback on our work.
Acknowledgments
vi
During the last three years, I have not been particularly sociable and I may have not been a very good friend and yet none of my friends resented me for that. I am extremely grateful for their comprehension and above all, the good times I spent with them. I especially want to thank my very dear friends from Bordeaux - Adrien, Anne, Elina and Tibo. I have enjoyed every moment spent with you, whether in Bordeaux, Toulouse or Amsterdam, and they have proved essential to letting off steam. I also want to thank Alice and Mélou for the all too rare but very good moments that we spent together, and I hope we will have more opportunity to see each other once I will no longer be a student. Last but not least, I want to thank some people I met during my studies, namely Colas, Guillaume, Hélène, Kevin and Sophien: it has always been a pleasure to see you and your support and encouragement have always been very much welcomed. I owe each of you a pint of beer, or gin and tonic.
Speaking of “good times”, I am immensely indebted to my lovely family. First, I want to thank my parents who have always let me study (and made it possible for me to study) whatever I wanted, be it Modern Literature or Human-Computer Interaction, without expressing any judgement or anxiety as regards to my professional choices. Looking at my siblings, “uncertainty” is probably the word that best qualifies our professional paths and my parents’ openness, or rather acceptance is admirable! Obviously, I must also thank my sisters and brother Sandra, Guillaume and Solène for laughing out loud at the very idea of me holding a PhD in Computer Science, for their constructive criticisms on the very concept of research and for their (desperate) attempts to make me a “fighter”. I hope that with my new title, I will at last gain some respect. More seriously, I am very grateful to them as well as to Francisco and to my lovely niece and nephew Anna and Tomas because no matter how exhausting being a member of the Ducasse family can be, I have always been looking forward to spending time with them during the week-ends and holidays as well as to receiving their phone calls, and especially the ones from my chewie. I could not end this Acknowledgement section without mentioning the (funny peculiar) one that put up with me throughout these years, with such kindness and comprehension that I could not have wished for better. I must thank him as much as I must apologize for all the evenings and week-ends during which I was working. His presence has been enough to make all the bad moments not that bad, and I am indebted to him for every single thing he did for me (or us?), including gardening, making me laugh, cooking, arranging trips, proofreading, making coffee, listening to my complaints, making puns, picking good songs, movies, books, cheese and wines, telling stories, and because the entire list would require as many pages as a book from Joyce, Gary, Cohen or Perec, I will end up here by once again saying merci to the désinvolte Michael C. Fry.
vii
R
ÉSUMÉ
(Un résumé plus détaillé de la thèse est présenté à la fin de ce manuscrit, Appendix F.)
En dépit de leur omniprésence et de leur rôle essentiel dans nos vies professionnelles et personnelles, les représentations graphiques, qu’elles soient numériques ou sur papier, ne sont pas accessibles aux personnes déficientes visuelles car elles ne fournissent pas d’informations tactiles. Par ailleurs, les inégalités d’accès à ces représentations ne cessent de s’accroître ; grâce au développement de représentations graphiques dynamiques et disponibles en ligne, les personnes voyantes peuvent non seulement accéder à de grandes quantités de données, mais aussi interagir avec ces données par le biais de fonctionnalités avancées (changement d’échelle, sélection des données à afficher, etc.). En revanche, pour les personnes déficientes visuelles, les techniques actuellement utilisées pour rendre accessibles les cartes et les diagrammes nécessitent l’intervention de spécialistes et ne permettent pas la création de représentations interactives. Cependant, les récentes avancées dans le domaine de l’adaptation automatique de contenus laissent entrevoir, dans les prochaines années, une augmentation de la quantité de contenus adaptés. Cette augmentation doit aller de pair avec le développement de dispositifs utilisables et abordables en mesure de supporter l’affichage de représentations interactives et rapidement modifiables, tout en étant accessibles aux personnes déficientes visuelles. Certains prototypes de recherche s’appuient sur une représentation numérique seulement : ils peuvent être instantanément modifiés mais ne fournissent que très peu de retour tactile, ce qui rend leur exploration complexe d’un point de vue cognitif et impose de fortes contraintes sur le contenu. D’autres prototypes s’appuient sur une représentation numérique et physique : bien qu’ils puissent être explorés tactilement, ce qui est un réel avantage, ils nécessitent un support tactile qui empêche toute modification rapide. Quant aux dispositifs similaires à des tablettes Braille, mais avec des milliers de picots, leur coût est prohibitif.
L’objectif de cette thèse est de pallier les limitations de ces approches en étudiant comment développer des cartes et diagrammes interactifs physiques, modifiables et abordables. Pour cela, nous nous appuyons sur un type d’interface qui a rarement été étudié pour des utilisateurs déficients visuels : les interfaces tangibles, et plus particulièrement les interfaces tangibles sur table. Dans ces interfaces, des objets physiques représentent des informations numériques et peuvent être manipulés par l’utilisateur pour interagir avec le système, ou par le système lui-même pour refléter un changement du modèle numérique – on parle alors d’interfaces tangibles sur tables animées, ou actuated. Grâce à la conception, au développement et à l’évaluation de trois interfaces tangibles sur table (les Tangible Reels, la Tangible Box et BotMap), nous proposons un ensemble de solutions techniques répondant aux spécificités des interfaces tangibles pour des personnes déficientes visuelles, ainsi que de nouvelles techniques d’interaction non-visuelles, notamment pour la reconstruction d’une carte ou d’un diagramme et l’exploration de cartes de type « Pan & Zoom ». D’un point de vue théorique, nous proposons aussi une nouvelle classification pour les dispositifs interactifs accessibles.
ix
A
BSTRACT
Despite their omnipresence and essential role in our everyday lives, online and printed graphical representations are inaccessible to visually impaired people because they cannot be explored using the sense of touch. The gap between sighted and visually impaired people’s access to graphical representations is constantly growing due to the increasing development and availability of online and dynamic representations that not only give sighted people the opportunity to access large amounts of data, but also to interact with them using advanced functionalities such as panning, zooming and filtering. In contrast, the techniques currently used to make maps and diagrams accessible to visually impaired people require the intervention of tactile graphics specialists and result in non-interactive tactile representations.
However, based on recent advances in the automatic production of content, we can expect in the coming years a growth in the availability of adapted content, which must go hand-in-hand with the development of affordable and usable devices. In particular, these devices should make full use of visually impaired users’ perceptual capacities and support the display of interactive and updatable representations. A number of research prototypes have already been developed. Some rely on digital representation only, and although they have the great advantage of being instantly updatable, they provide very limited tactile feedback, which makes their exploration cognitively demanding and imposes heavy restrictions on content. On the other hand, most prototypes that rely on digital and physical representations allow for a two-handed exploration that is both natural and efficient at retrieving and encoding spatial information, but they are physically limited by the use of a tactile overlay, making them impossible to update. Other alternatives are either extremely expensive (e.g. braille tablets) or offer a slow and limited way to update the representation (e.g. maps that are 3D-printed based on users’ inputs).
In this thesis, we propose to bridge the gap between these two approaches by investigating how to develop physical interactive maps and diagrams that support two-handed exploration, while at the same time being updatable and affordable. To do so, we build on previous research on Tangible User Interfaces (TUI) and particularly on (actuated) tabletop TUIs, two fields of research that have surprisingly received very little interest concerning visually impaired users. Based on the design, implementation and evaluation of three tabletop TUIs (the Tangible Reels, the Tangible Box and BotMap), we propose innovative non-visual interaction techniques and technical solutions that will hopefully serve as a basis for the design of future TUIs for visually impaired users, and encourage their development and use. We investigate how tangible maps and diagrams can support various tasks, ranging from the (re)construction of diagrams to the exploration of maps by panning and zooming. From a theoretical perspective we contribute to the research on accessible graphical representations by highlighting how research on maps can feed research on diagrams and vice-versa. We also propose a classification and comparison of existing prototypes to deliver a structured overview of current research.
xi
C
ONTENTS
Acknowledgments ... v Résumé ... vii Abstract ... ix Contents ... xiList of tables ... xiv
List of figures... xv
Glossary ... xix
CHAPTER 1 Introduction ... 23
1 Context: visual impairment and blindness ... 24
2 Why study tangible maps and diagrams for visually impaired users? ... 25
3 Thesis statement ... 30
4 Research questions ... 31
5 Contributions ... 32
6 Thesis structure ... 33
7 Remarks ... 34
CHAPTER 2 Related work ... 37
Introduction to Chapter 2 ... 38
PART A Nature and use of maps and diagrams ... 39
1 Introduction ... 39
2 Graphical representations ... 39
3 Maps ... 42
4 Diagrams ... 49
5 Conclusion of Part A ... 51
PART B Production and characteristics of tactile maps and diagrams ... 53
1 Introduction ... 53
2 A brief history of tactile graphics ... 53
3 Current practices ... 55
4 Perspectives for improving tactile maps and diagrams ... 61
5 Exploring tactile graphics ... 64
6 Conclusion of Part B ... 69
Contents
xii
1 Introduction ... 71
2 Classification of interactive maps and diagrams ... 71
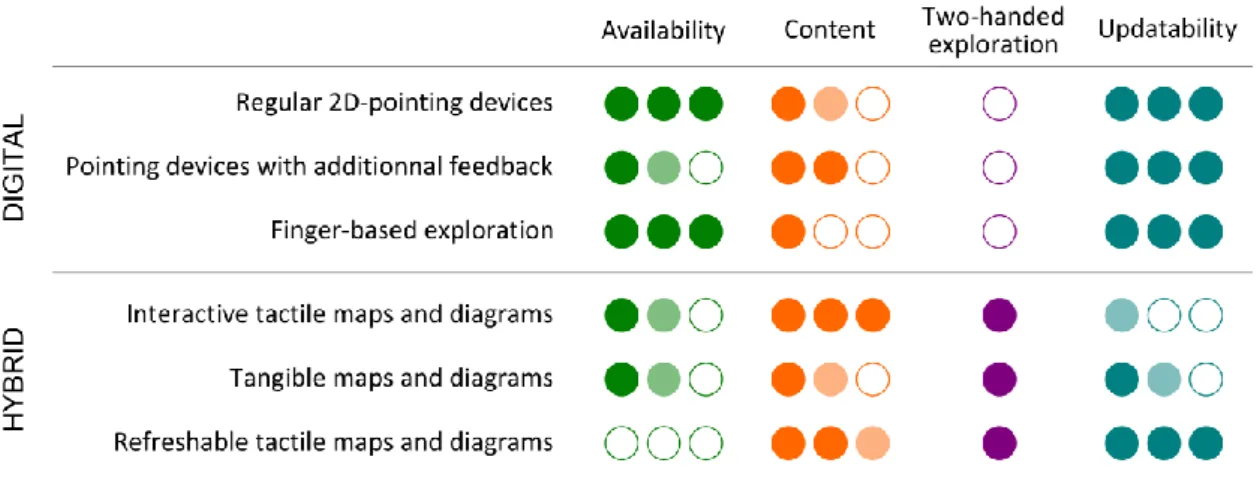
3 Digital maps and diagrams ... 73
4 Hybrid maps and diagrams ... 84
5 Summary ... 91
6 Conclusion of Part C ... 93
PART D Tangible User Interfaces ... 95
1 Introduction ... 95
2 Tangible User Interfaces: Definition and Properties ... 95
3 Technologies for tabletop TUIs ... 105
4 Actuated tabletop TUIs ... 111
5 Conclusion of Part D ... 114
PART E Designing tabletop tangible maps and diagrams for visually impaired users ... 115
1 Introduction ... 115
2 Specificities of non-visual tabletop TUIs ... 115
3 Description of existing prototypes ... 117
4 Analysis of existing prototypes... 122
5 Design considerations and research gaps ... 128
6 Conclusion of Part E ... 129
Conclusion of Chapter 2 ... 130
CHAPTER 3 Tangible Reels: construction and exploration of tangible maps and diagrams ... 131
1 Introduction ... 132
2 Design of the Tangible Reels ... 134
3 Pre-study: usability of the Tangible Reels ... 137
4 Interaction techniques and feedback ... 144
5 Implementation ... 149
6 Main study: usability of the interaction techniques ... 150
7 Educational workshop ... 159
8 General discussion and perspectives ... 163
9 Conclusion of Chapter 2 ... 170
CHAPTER 4 The Tangible Box: tangible and tactile graphics for learning activities .... 171
1 Introduction ... 172
xiii
3 Implementation ... 179
4 Designing applications for the Tangible Box ... 181
5 Examples of Tangible Box applications ... 187
6 Discussion and perspectives ... 190
7 Conclusion of Chapter 4 ... 193
CHAPTER 5 BotMap: panning and zooming with an actuated TUI ... 195
1 Introduction ... 196
2 System overview and interfaces ... 199
3 Implementation ... 204
4 Study 1: Usability of the two interfaces ... 205
5 Study 2: Usability and mental representations ... 211
6 Study 3: Realistic task and independently moving robots ... 226
7 General discussion and perspectives ... 229
8 Conclusion of Chapter 5 ... 233
CHAPTER 6 Discussion and perspectives ... 235
1 Thesis summary and contributions ... 236
2 Going beyond the scope of the thesis ... 243
3 Relation with other fields of research ... 246
4 Perspectives ... 255
CHAPTER 7 Conclusion ... 265
1 Pros and cons of tangible maps and diagrams for visually impaired users ... 266
2 How “tangible” are the interfaces that we developed? ... 268
3 A far-reaching agenda for further research ... 270
Appendix ... 273
Appendix A Tangible Reels: supplementary material ... 275
Appendix B The Tangible Box: supplementary material ... 277
Appendix C BotMap: supplementary material ... 281
Appendix D Work in progress: designing small and stable objects ... 289
Appendix E Scenarios for the Cellulo project ... 291
Appendix F Résumé détaillé (français) ... 293
List of tables
xiv
L
IST OF TABLES
Table 2.1. Uni-dimensional tests to assess spatial knowledge of visually impaired users, after
Kitchin et al. [138]. ... 46
Table 2.2. Two-dimensional tests to assess spatial knowledge of visually impaired users, after Kitchin et al. [138]. ... 46
Table 2.3. Summary of the main characteristics of existing prototypes of tangible maps and diagrams in terms of content; tangible objects; interaction; availability. ... 127
Table 3.1. Participants' main characteristics: age, gender, degree of visual impairment and age at onset of blindness. ... 139
Table 3.2. Percentage of subjects who answered a 5, 6 or 7 for each item and Object Design after the exploration and the construction tasks. ... 142
Table 3.3. Participants’ main characteristics ... 151
Table 3.4. Mean number of elements selected per question, per map (N = 8). ... 157
Table 5.1. Procedure for each session of Study 1. There was one session for each interface. ... 207
Table 5.2. Participants’ main characteristics. ... 212
Table 5.3. Examples of multiple choice questions asked after each trial. ... 214
Table 5.4. Description of the procedure for the first session (training)... 216
Table 5.5. Description of the procedure for the second session (evaluation). ... 216
Table 5.6. Percentage of successful trials for each type of trial and interface. ... 217
xv
L
IST OF FIGURES
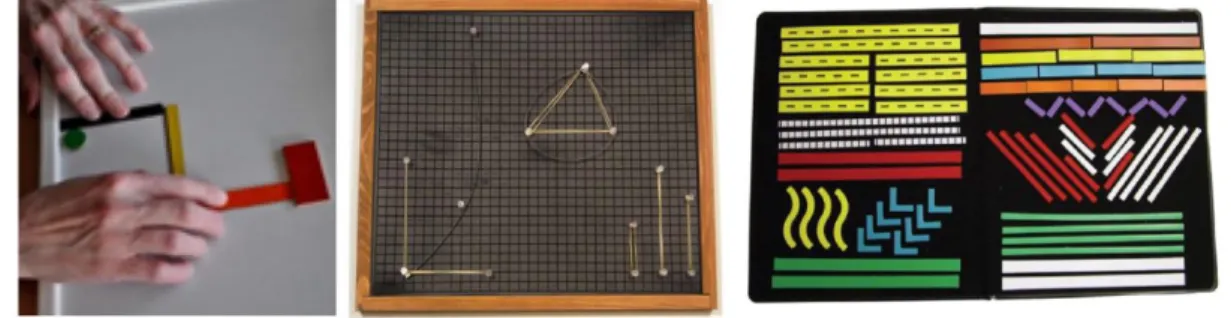
Figure 1.1. Different types of displays that can be used to make graphical representations accessible to sighted or visually impaired users, according to their degree of availability and
updatability. ... 29
Figure 2.1. A visually impaired user is exploring a tactile map and its corresponding Braille key. . 39
Figure 2.2. An adaptation of the six retinal variables originally proposed by Bertin [15] into six tactile variables [318]. ... 41
Figure 2.3. The map use cube proposed by MacEachren and Kraak [179], with the four map use goals. ... 43
Figure 2.4. Three main developments for tactile maps and diagrams. ... 54
Figure 2.5. Left: a hand-crafted master used for thermoforming. Middle: a map of France made with thermoforming. Right: a raised-line line graph and a raised-line map of France, made with swell paper. ... 55
Figure 2.6. A 3D-printed map of the IJA with elements of various heights. ... 56
Figure 2.7. A "bi-graphic" raised-line map with several visual elements used at the IJA. ... 57
Figure 2.8. Left: magnetic board. Middle: cork board mounted with a rubber mat embossed with a grid. Right: a felt-covered board with a set of pieces equipped with VELCRO®. ... 59
Figure 2.9. Two small-scale and reconfigurable 3D-printed models, used at the IJA. ... 60
Figure 2.10. The prototype of Brittell et al. [22]. ... 74
Figure 2.11. Three force-feedback input devices. ... 76
Figure 2.12. The "GRAB" interface was composed of two handles. After [110]. ... 77
Figure 2.13. The VTPlayer Mouse. ... 78
Figure 2.14. The STRESS latero tactile display was composed of an array of 64 actuators. ... 79
Figure 2.15. Two prototypes of digital maps with finger-based exploration. ... 79
Figure 2.16. The GraVVITAS prototype [83]. ... 81
Figure 2.17. In the prototype of Bardot et al. [5], a smartwatch vibrated and emitted sounds to enable visually impaired users to explore virtual maps. ... 82
Figure 2.18. The set-up used by Brock et al. [24] for their evaluation. ... 85
Figure 2.19. Two prototypes of interactive tactile maps with camera-based finger tracking... 87
Figure 2.20. Linespace [292]. ... 88
Figure 2.21. The BrailleDis 9000 tablet, composed of 7200 pins, was used in [348] to give visually impaired users access to dynamic maps. Retrieved from [348]. ... 89
Figure 2.22. Summary of the main characteristics of digital maps and diagrams (above) and hybrid maps and diagrams (below). ... 92
Figure 2.23. Illustrations of three main types of TUIs. ... 96
Figure 2.24. Left: the Model-Control-Representation (intangible and tangible) or MCRit model of TUIs [305]. Right: TUIs provide at least two feedback loops. ... 97
Figure 2.25. Two TUIs that enable urban planners to interact with a map by simulating wind flow, sunlight, pedestrians, etc. ... 101
Figure 2.26. The prototype used by Schneider et al. [271] to investigate the benefits of TUIs for collaborative learning. Retrieved from [271]. ... 103
List of figures
xvi
Figure 2.28. Two examples of systems based on electromagnetic sensing. ... 107
Figure 2.29. Finger-tracking with camera based systems. ... 109
Figure 2.30. The third feedback loop in the MCRit model of TUIs [305]. ... 111
Figure 2.31. Two examples of electromagnetic surfaces. ... 112
Figure 2.32. Three examples of actuated tabletop TUIs with mobile tangible objects: Cellulos [223], Tangible Bots [232] and Zooids [81]. ... 113
Figure 2.33. Construction of a line graph with the Trackable Interactive Multimodal Manipulatives (retrieved from [182]). ... 118
Figure 2.34. The Invisible Tangible Geometry prototype. Each object is composed of a node and two edges (one narrow rod and one wide rod). Retrieved from [261]. ... 119
Figure 2.35. Jafri et al.’s prototype, referred to as Tangible Shapes. Retrieved from [119]... 120
Figure 2.36. Left: the Digitizer Auditory Graph. Right: the Interactive Auditory Scatter plot. .... 121
Figure 2.37. The Tangible Graph Builder allowed the exploration of line graphs and bar charts. ... 121
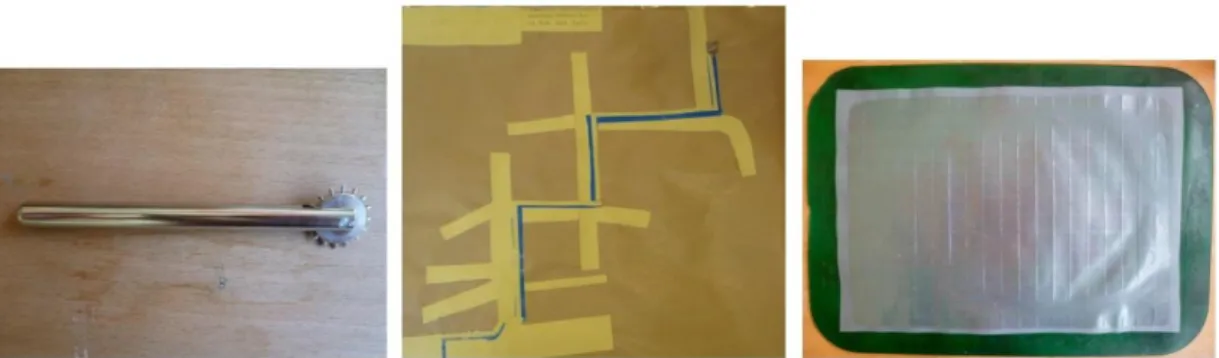
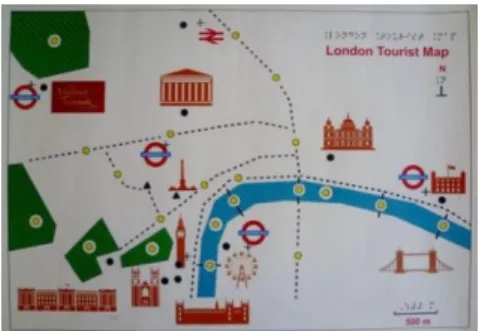
Figure 3.1. To make digital lines tangible, retractable badge reels were used. ... 135
Figure 3.2. Final design of the two types of Tangible Reels. ... 137
Figure 3.3. By attaching one Tangible Reel’s retractable string to a Tangible Reel’s metallic bracelet, a physical line can be built between two Tangible Reels. ... 137
Figure 3.4. Left: Example of an Overview map used at the IJA. Right: an Overview map for the pre-study. ... 139
Figure 3.5. Maps used for the exploration task. ... 139
Figure 3.6. Maps used for the construction task. ... 140
Figure 3.7. Summary of the procedure for one Tangible Reel design. ... 141
Figure 3.8. Exploration of a map built with Tangible Reel by a visually impaired participant. ... 142
Figure 3.9. Examples of Metro maps drawings made by the participants, alongside their average mark. ... 143
Figure 3.10. Examples of Overview maps drawings made by the participants, alongside their average mark. ... 143
Figure 3.11. Example of a map and its corresponding description file (simplified version). ... 145
Figure 3.12. Procedure for connecting two Tangible Reels in order to build a line. ... 146
Figure 3.13. The system is composed of a transparent tabletop upon which an infrared frame (highlighted in blue, left) is placed to detect whenever the user performs a “tap and hold” gesture (right). ... 149
Figure 3.14. The four maps used for the evaluation. ... 152
Figure 3.15. Procedure for the evaluation. ... 154
Figure 3.16. Left: Mean completion times to construct each map, in minutes (N = 8). ... 155
Figure 3.17. Mean times for the three steps required to correctly place a Tangible Reel, in seconds (N = 8): ... 155
Figure 3.18. Mean ratios of completion times (right map / left map, N = 8). ... 156
Figure 3.19. Left: mean completion times to answer one question per map, in seconds (N = 8). Right: mean ratios between completion times (right map / left map, N = 8). Values superior to one indicate the participants spent more time answering the question with the right map than with the left map ... 156
xvii
Figure 3.20. Left: For each map, number of participants who found the task easy (green), average (blue), or difficult (red). Right: Mean scores for each dimension of the NASA-RTLX
questionnaire (N = 8). ... 157
Figure 3.21. One pupil interacting with the map of France built with six Tangible Reels. ... 161
Figure 3.22. Three possible improvements for Tangible Reels. ... 166
Figure 3.23. Examples of diagrams that could be constructed with Tangible Reels. ... 166
Figure 3.24. Examples of geostatistical maps. ... 167
Figure 3.25. A height-adjustable part could be added to the Tangible Reels to convey quantitative information. ... 169
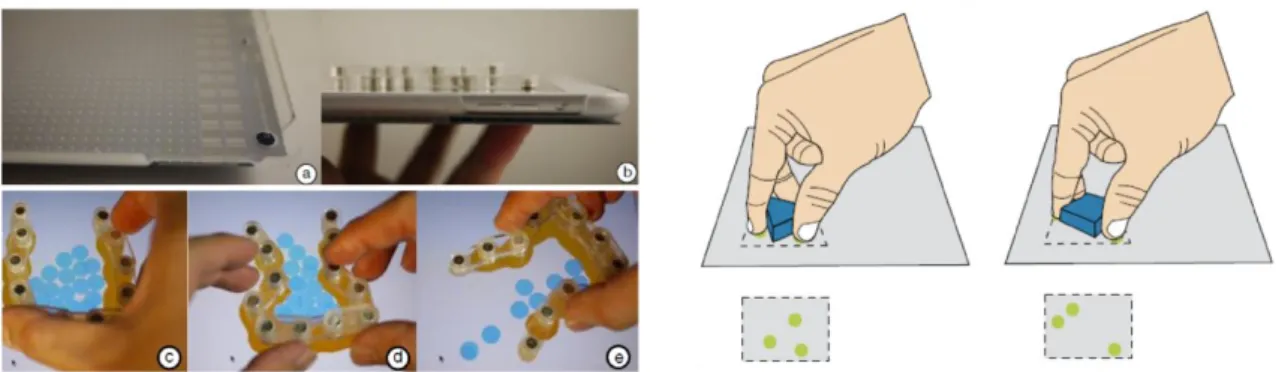
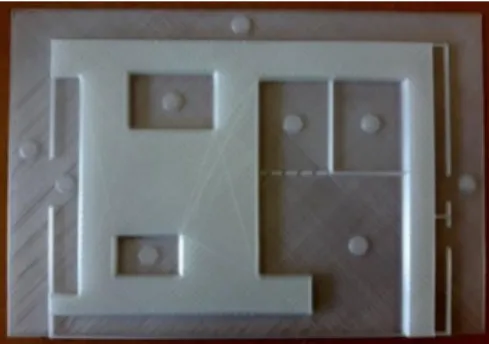
Figure 4.1. Overview of the Tangible Box. ... 175
Figure 4.2. Each tangible object is composed of two parts, magnetically attached together. ... 176
Figure 4.3. Fastening system, to adapt to a large range of support thicknesses. ... 180
Figure 4.4. Inside the Tangible Box. ... 180
Figure 4.5. Tangible-based interactions. ... 186
Figure 4.6. A summary of the design framework for Tangible Box applications, composed of four themes: overall characteristics, material, activities and interactivity. ... 187
Figure 4.7. The trigonometric ratios application. ... 189
Figure 5.1. Overview of BotMap. ... 199
Figure 5.2. Before panning and zooming, users must activate the corresponding mode. ... 201
Figure 5.3. Description of the Keyboard interface. ... 202
Figure 5.4. Description of the Sliders interface. ... 203
Figure 5.5. Left: Mean completion times per condition, in seconds (N = 8). Right: Mean ratios of completion times (Sliders / Keyboard, N = 8). ... 208
Figure 5.6. Left: mean distance panned (in kilometers) per condition (N = 8). Right: mean ratio of distances panned (Sliders / Keyboard, N = 8). ... 209
Figure 5.7. One of the two maps used for the test. ... 213
Figure 5.8. Summary of a trial... 213
Figure 5.9. Left: mean completion times (in seconds) for each type of trial (N = 8). Right: mean ratios of completion times (Sliders / Keyboard, N = 8). ... 217
Figure 5.10. Three examples of maps interpolation, based on the bidimensional regression analysis. ... 218
Figure 5.11. Histogram of regression coefficients computed from a bidimensional regression analysis, for the 16 maps reconstructed by the participants... 219
Figure 5.12. Left: percentage of correct answers for each type of questions, per interface (N = 8). Right: mean differences of percentage of correct answers between interfaces (Sliders minus Keyboard, N = 8). ... 220
Figure 5.13. Left: Mean workload (max: 100) for each dimension of the NASA-TLX questionnaire (N = 8). Right: For each dimension, mean differences between the interfaces (Sliders minus Keyboard, N = 8). ... 221
Figure 5.14. A sketch of a tangible viewport (in green) that could be moved over a raised-line map and whose size could be adjusted (in blue) to reflect changes of scale. ... 233
Figure 6.1. Four design themes for constructive assemblies [162]. ... 248
Figure 6.2. The Tangible Reels interface analyzed with the framework proposed in [162]. ... 249
List of figures
xviii
Figure 6.4. Possible raised-line token+constraint modules for the Tangible Box. ... 250
Figure 6.5. Left: design space of Swarm User Interfaces, and particularly of Zooids [81]. Right: in green, the aspects that we explored with BotMap; in orange, the aspects that would be worth considering to enhance BotMap... 252
Figure 6.6. Updated version of the figure used in the introduction. ... 255
Figure 6.7. The Ultrahaptics system [33]... 257
Figure 6.8. Prototype of a collaborative board game, based on the Tangible Box. ... 261
Figure 6.9. Prototype of an actuated bar chart. ... 263
Figure 6.10. Example of a “geophysicalization” based on BotMap and the actuated bar charts. . 264
Figure 7.1. Pros and cons of our interfaces compared to existing hybrid prototypes. ... 268
xix
G
LOSSARY
(Definitions given for terms marked with an asterisk are specific to this thesis; definitions given for other terms are commonly found in the literature. In a definition, terms in italics refer to another term defined in the glossary.)
Actuated tangible user interface: tangible user interfaces “in which physical components move in a
way that can be detected by the user” [242].
Affordance: the design aspect of an object which suggests how the object should be used (see
[216]).
Auditory icons: “caricatures of naturally occurring sounds” [75], e.g. a bird sound.
Awareness: in a collaborative context, the understanding of who is changing which parts of the
system.
Bi-graphism*: term used by specialized teachers; refers to the concept of designing accessible
graphical representations that are not solely intended to be tactile, but also visual. Bi-graphic representations rely on tactile elements and visual elements (and notably strong contrasts between colors); they are intended to be used by low-vision users or collaboratively between visually impaired and sighted users.
Complexity*: refers to the amount of data that a graphical representation conveys. The complexity
of a graphical representation depends on the number of elements being displayed and/or on the possibility for the user to interact with them through panning and zooming.
Constructive assemblies: tangible user interfaces “that involve the interconnection of modular
physical, interactive units to formulate larger constructions that are automatically or manually put-together” [162].
Container: one of three types of tangible object defined by Holmquist et al. [102]: “containers are
generic objects used to move information between different devices or platforms”. See token and tool.
Data physicalization: see Physicalization.
Diagram*: a graphical representation that is not a table, an icon, a sign, an image or a map. Broadly
speaking, diagrams are “illustrations that express conceptual relationships spatially” [343].
Digital*: quality of a representation that cannot be explored tactilely (i.e. using both hands), that
is virtual.
Digital maps and diagrams*: interactive maps and diagrams that do not rely on a physical
Glossary
xx
Dynamic*: quality of a representation or display that can be instantly updated. We consider that
there is a continuum between representations that cannot be updated at all (static) and graphical representations that can be fully and instantly updated by a system (dynamic).
Earcon: “abstract, synthetic and mostly musical tones or sound patterns that can be used in
structured combinations” [47].
Editable*: quality of a graphical representation that is digital and that can be directly modified by the
user.
Expressiveness*: refers to the nature of the data that a graphical representation conveys and notably
to the different implantations and marks used: points (squares, triangles, arrows, etc.), lines (dotted, plain, of various thicknesses), areas (filled, half-filled, etc.). The larger the range of marks used, the more expressive the graphical representation.
Fiducial marker: in the context of this thesis, tags that are attached to tangible objects that allow the
application to track the objects and to retrieve their position (x-, y- and possibly z- coordinates), as well as their orientation. Fiducial markers are often printed on a piece of paper but can also be directly embedded/engraved in the tangible objects.
German film / paper: a transparent plastic sheet that must be placed on a rubber mat before
being drawn on using a stylus or a pen. When drawing, a raised image is created that visually impaired users can immediately detect (see Figure 2.4, right).
Graphical primitives: see implantation.
Graphical representation: a document (digital or physical) that is composed of a set of marks
[243] and that is not solely based on textual information. Includes maps, diagrams, icons, signs, images and tables. In the context of this thesis, we used the expressions “graphical representations”, “representations” and “maps and diagrams” interchangeably, to avoid repetition.
Hybrid maps and diagrams*: interactive maps or diagrams that rely on a digital and physical
representations and therefore provide multiple points of contact and support multiple hand/finger exploration.
Implantations: graphical representations are composed of marks, which can be categorized into
three types of implantation [15]: points, lines and areas. These implantations constitute the elementary units or graphical primitives of any graphical representation.
Interactive maps and diagrams*: any type of prototype that allows visually impaired users to
access maps or diagrams in an interactive manner.
Manipulable*: quality of a representation that is composed of several (tangible) objects that the
user can physically grasp and move. The easier it is to move the objects, the more “manipulable” the representation is.
xxi
Maps: “geographic representations that facilitate a spatial understanding of things, concepts,
conditions, processes or events in the human world” [344].
Orientation & Mobility: a profession which focuses on educating individuals who are blind or
visually impaired on safe and effective travel in their environment.
Orientation & Mobility maps: maps intended to be used to help a person navigate.
Point of contact: an element of the representation that is currently being explored, either
indirectly, by means of a pointing device, or directly, by the user’s hands or fingertips. See digital vs hybrid maps and diagrams.
Physical*: quality of a representation that provides multiple points of contact; that can be explored
tactilely (i.e. with both hands). Antonym: digital.
Physicalization: the term refers to both “a physical artifact whose geometry or material
properties encode data” [121], and emergent research that “examines how computer-supported, physical representations of data (i.e., physicalizations), can support cognition, communication, learning, problem solving and decision making” [121].
Raised-line graphic: a graphical representation printed on a special heat-sensitive paper (called swell
or microcapsule paper) containing microcapsules of polystyrene, using a normal printer. When the sheet passes through a heater, printed areas in black are heated at a higher temperature than non-printed areas, causing the microcapsules under the ink to swell. This creates a relief that the user is able to detect.
Raised-pin displays: devices composed of a matrix of pins that can be dynamically raised or
lowered and that are used to display graphical information. Raised-pin displays could be referred to as “Braille tablets”.
Reconfigurable*: quality of a representation that is composed of several tangible objects that can
be physically moved by the system (see dynamic) and/or the user (see manipulable). In addition, a key property of TUIs.
Refreshable*: synonym of dynamic.
Scalability: ability for a system to adapt to complex problems or data sets [276].
Spearcons: “spoken phrases sped up until they may no longer be recognized as speech” [47]. Static*: quality of a representation that cannot be updated. Antonym: dynamic.
Swarm User Interfaces: “human-computer interfaces made of independent self-propelled
elements that move collectively and react to user input » [81].
Tactile graphics: graphical representations intended to be read principally by touch rather than
vision [1].
Glossary
xxii
Tangible user interaction: “a genre of human-computer interaction that uses spatially
reconfigurable physical objects as representations and controls for digital information” [306].
Tangible User Interfaces (TUIs): interfaces that use spatially reconfigurable physical objects as
representations and controls for digital information.
Token: one of three types of tangible object defined by Holmquist et al. [102]: “tokens are used
to access stored information, the nature of which is physically reflected in the token in some way”. See container and tool.
Token+constraint interfaces: a sub-type of TUIs that rely on “two kinds of physical/digital
artifacts: tokens are discrete, spatially reconfigurable physical artifacts that each describe or represent an element or aggregate of digital information. Constraints are structures that physically channel how tokens can be manipulated, often limiting their movement to a single physical dimension” [306].
Tools: one of three types of tangible object defined by Holmquist et al. [102]: “tools are used to
manipulate digital information”. See container and token.
Updatable*: quality of a representation (digital or physical) that can be modified, either by the
system or by the user.
23
CHAPTER 1
I
NTRODUCTION
Ça a duré ce que ça a duré, mais l’Institut des Aveugles me fut d’un grand
secours. Tous les soirs, après le travail, je m’y rendais, et je me postais à
l’entrée. Vers sept heures, les aveugles commencent à sortir. Avec un peu de
chance, je réussissais à m’emparer de six ou sept et à les aider à traverser la
rue. On m’objectera qu’aider un aveugle à traverser la rue, ce n’est pas
grand-chose, mais c’est toujours ça de pris. En général, les aveugles sont très
gentils et très aimables, à cause de tout ce qu’ils n’ont pas vu dans la vie.
[…] Et puis un jour je suis tombé sur un aveugle qui n’était pas diminué
du tout. […]. Je ne sais pas comment il a su que c’était moi, mais il m’a
reconnu tout de suite. – Foutez-moi la paix, gueula-t-il. Allez faire vos
besoins ailleurs ! Et puis il a levé sa canne et il a traversé tout seul.
Romain Gary (Emile Ajar). Gros-Câlin.
Chapter structure
1. Context: visual impairment and blindness2. Why study tangible maps and diagrams for visually impaired users? 3. Thesis statement
4. Research questions 5. Contributions 6. Thesis structure 7. Remarks
Chapter 1 – Introduction
24
1
C
ONTEXT
:
VISUAL IMPAIRMENT AND BLINDNESS
This thesis concerns the development of accessible maps and diagrams for visually impaired people. Before considering the motivations of this work, it is important to define to which part of the population the term “visually impaired people” refers. Two measures are mainly used to distinguish between the various degrees of visual impairment: visual acuity and visual field [337]. Visual acuity measures the clarity or sharpness of vision and is expressed as a ratio of two numbers: the numerator is the distance at which a person can discriminate between two objects; the denominator is the distance at which a person with no visual deficit can discriminate between these two objects. The visual field is expressed in degrees and indicates the area in which an object can be detected in the peripheral vision while the eye is focused on a central point. Based on these measures, the latest International Classification of Diseases (ICD) [338] defines blindness as a visual acuity worse than 3/60 or a visual field of the better eye no greater than 10°. Blindness may include light perception, provided that the visual acuity is less than 3/60. Moderate or severe visual impairment, also referred to as low-vision, is defined by a visual acuity worse than 6/18 (moderate) or worse than 6/60 (severe), but equal to or better than 3/60. In this thesis, we use the term “visual impairment” to refer to moderate and severe visual impairment as well as blindness, as is the case in the ICD. Even though the interaction techniques and prototypes that we proposed were specifically designed for blind people, i.e. they did not rely on visual feedback, we use the term “visually impaired users” to emphasize the fact that our work could benefit people affected by blindness as well as people having low-vision.
Most recent estimates of blindness and visual impairment were provided by the World Health Organization (WHO) [337]. In 2010, the estimated number of visually impaired people was 285 million, including 39 million individuals affected by blindness and 246 million individuals affected by low-vision. In Europe, the estimated numbers were 31.7 million visually impaired people, 28.7 having low-vision and 3 million being blind. These estimates should be considered cautiously, due to missing or outdated data (the margin of error is approximatively 20%). Around the world, the main causes of visual impairment, including blindness, are uncorrected refracted errors (43%), cataracts1 (33%) and glaucoma2 (2%).
One of the main consequences of visual impairment, from a societal perspective, is high unemployment rates. For example, in the United States, a 2015 report indicates that only 42% of working-age people with visual impairment are employed, in comparison to 78% for people without any disability [58]. This unemployment rate is also correlated with low income: the same report states that in the United States, 29% of visually impaired people live below the poverty line. Issues related to employment can be explained by the fact that visually impaired people often experience difficulties in navigating independently (due to the inaccessibility of maps and the lack of accessible and reliable navigation systems), but also because they have a limited access to digital or printed information, and especially to graphical information. In fact, Beck-Winchatz and Riccobono [10] commented upon how the inaccessibility of curriculum materials might explain why visually impaired people do not pursue careers in a number of disciplines, and especially in
1 A cataract is a cloudiness or opacity in the normally transparent crystalline lens of the eye. 2 Glaucoma is a group of diseases that damage the eye’s optic nerve.
25
Science, Technology, Engineering and Mathematics. Regardless of employment considerations, the fact that visually impaired users are not guaranteed an equal access to (digital) information raises social issues, notably in terms of inclusion.
Some assistive technologies have contributed to a greater access to digital information, the most notable being screen-reader technology3. A screen-reader is a piece of software that extracts the
text being displayed on a screen and outputs it using a speech synthesizer or a braille display. Combined with a keyboard or a set of multitouch gestures, screen-readers allow visually impaired users to interact with a computer or a mobile device and are the most common technology used by visually impaired people to access digital content. However, because they mainly rely on a sequential access to digital information, screen-readers are not adapted to convey graphical representations. In fact, and as we will more thoroughly describe in the next section, to date there is no mainstream assistive technologies with which visually impaired people can independently access graphical representations, which strongly affect their access to education and employment as well as their independence, quality of life and social inclusion.
2
W
HY STUDY TANGIBLE MAPS AND DIAGRAMS FOR
VISUALLY IMPAIRED USERS
?
2.1
I
MPORTANCE OF GRAPHICAL REPRESENTATIONSGraphical representations are part of our societies and cultures. Even during the prehistoric era, map-like representations were produced by “primitive people” using a variety of materials such as shells, stones and sticks to communicate about spatial relationships [286]. For millennia, the diversity of these materials evolved alongside the goals, techniques and users of graphical representations. For long reserved to a small minority of people such as “priests, scholars or bureaucrats”, graphical representations, through technological advances, have progressively become more and more commonplace [345]. The invention of the printing press by Gutenberg in the middle of the fifteenth century is, for example, considered as a key technological progress. But certainly one of the most important milestones was the development of the web, which allowed for easy and cheap dissemination of graphical representations to a large audience. In particular, from the mid-nineties, online mapping services such as MapQuest (1996), Open Street Map (2004) and Google Maps (2005) started to emerge, soon becoming mainstream services. In parallel, disciplines such as Information Visualization and Geographic Visualization emerged and participated in the expansion of interactive and most often dynamic digital graphical representations. Nowadays, maps and diagrams–a subset of graphical representations that we define in Chapter 2, Part A–play a crucial role in our lives, be it as educational tools, navigational aids or means of communication for online and printed content.
2.2
V
ISUALLY IMPAIRED PEOPLE AND ACCESS TO GRAPHICAL REPRESENTATIONSDespite the fact that their availability is often taken for granted in developed countries, visually impaired people have not benefited from the growing development of interactive graphical
Chapter 1 – Introduction
26
representations. Due to their lack of tactile feedback, digital or printed graphical representations remain inaccessible to visually impaired people who cannot explore them using the sense of touch. Consequently, while the amount of data, technologies and interaction techniques available to sighted people is continuously increasing, visually impaired people have an extremely limited access to graphical representations and, needless to say, to interactive and dynamic graphical representations. This lack of availability can be partially explained by societal, technological and perceptual considerations – the last two being intrinsically connected.
From a societal perspective, the cognitive abilities of visually impaired people have long been debated and discussed [313]. Three theories have been proposed to discuss whether visually impaired people could understand spatial concepts such as understanding a map or being able to distinguish between various geometric shapes [66]: the “deficiency” theory stipulates that visual experience is essential to develop and understand spatial concepts; the “inefficiency” theory considers that visual experience is not essential but that the lack of visual experience necessarily leads to inefficient or at least less efficient spatial abilities; the “difference” theory states that visual experience is not necessary and that other senses can be used to develop spatial abilities that may be of a different nature but can be as functional as those developed by sighted users. The first theory is now invalidated, as a number of empirical studies demonstrated that visually impaired users are able to understand spatial concepts and that they can acquire spatial knowledge with direct (e.g. while navigating an unknown environment) or indirect (e.g. by reading a tactile map) experience. Although the two other theories have coexisted for several decades the latter is now the most widely considered. In particular, it is now well acknowledged that visually impaired people’s spatial abilities may be correlated with (a lack of) familiarity with specific tasks and the development of effective strategies to encode and understand information, rather than to the characteristics of the haptic system per se.
However, the “inefficient” theory and similar positions have been prevalent for a long period of time and up to the fifties research activities more commonly addressed the understanding and benefits of graphical representations (and particularly of maps) for visually impaired users from a cognitive perspective, and little research focused on how to make them more widely available by building upon technological advances. In fact, as observed by Brock [23], the number of research projects concerning the development of interactive map prototypes only began to increase considerably around the year 2000, i.e. at a time at which interactive graphical representations had already started to become mainstream for sighted people. Since then, research on non-visual graphical representations is a long way from having caught up with research and development of visual representations, and the gap between sighted and visually impaired people’s access to graphical representations is constantly growing. While there is an increasing development of online, interactive and dynamic representations for sighted people, visually impaired users barely have access to any graphical representation outside of schools. In addition, the graphical representations they have access to, referred to as tactile graphics, suffer from several limitations. They must be produced by tactile graphics specialists using particular techniques that require dedicated material, and time; they are non-interactive; they cannot be updated once printed. As for prototypes of interactive maps and diagrams, they are mostly confined to research laboratories and only a few of them are close to being regularly used within specialized education centers (e.g.
27
[28]). Therefore, as stated by O’Modhrain et al. [219], “there is an immediate need for research and development of new technologies to provide non-visual access to graphical material”.
However, the same authors also pointed out that “while the importance of this access is obvious in many educational, vocational, and social contexts for visually impaired people, the diversity of the user group, range of available technologies, and breadth of tasks to be supported complicate the research and development process” [219]. In fact, the development of (interactive) graphical representations for visually impaired users raises several challenges, mainly because of the inherent properties of tactile perception. As we will more thoroughly discuss in the first chapter of this thesis (Chapter 2, Part B, 5), the tactile exploration of a graphic is more sequential than its visual exploration because the cutaneous system only acquires information when the users’ fingertips and/or palms are in contact with the surface of the tactile graphic. In addition, the spatial resolution of touch is limited compared to that of vision, meaning that it is not possible to display the same amount of information on a visual graphic as on a tactile graphic of the same size. From this, two considerations follow. Firstly, visual graphical representations must be adapted to tactile graphical representations, and this adaptation process needs to be performed by tactile graphics specialists. Secondly, displays must take into account the properties of tactile perception and notably the fact that tactile exploration is cognitively demanding as users must integrate several pieces of information over space and time [159]; therefore displays should be carefully designed, so as to reduce cognitive workload.
The question of the adaptation of content is crucial when discussing the availability of graphical representations. The fact that the production of tactile graphics is a time-consuming and costly process partly explains why non-interactive tactile graphics are still inaccessible to visually impaired users outside of schools. However, the development of Open Data initiatives as well as efficient algorithms to process them opens new avenues for the (semi) automatic adaptation of content. It is now possible to envisage that in a few years it will be possible to automatically adapt simple online visual representations. Most complex representations will probably still require manual intervention but the cost and time of production will undoubtedly be drastically reduced.
2.3
I
NTERACTIVE GRAPHICAL REPRESENTATIONS FOR VISUALLY IMPAIRED USERSThe growth of available content must go hand in hand with the development of affordable and usable devices. In particular, these devices should provide users with an independent access to interactive and updatable graphical representations. The main advantage of interactivity is that it makes the use of braille labels unnecessary, which frees space for additional content (braille labels takes a lot of space) and makes graphical representations accessible to a larger audience (the number of braille readers is continuously decreasing). Updatable graphical representations are necessary to support advanced functionalities such as filtering, highlighting, panning and zooming that will guarantee a functional equivalence between visual and tactile graphical representations, but they also open new possibilities in terms of supported tasks, such as annotating or editing a map or a diagram.
Different approaches have already been considered to develop interactive maps and diagrams for visually impaired users and can be classified into two broad categories. On the one hand, a
Chapter 1 – Introduction
28
number of prototypes rely on digital representations that are displayed on a screen or projected over a surface: users can explore them using one finger or an input device such as a keyboard, a stylus, a joystick, etc. Audio feedback (and possibly force or cutaneous feedback) is provided according to what is under the finger or the cursor. These prototypes have the great advantage of being instantly updatable, but they provide very limited tactile feedback, which makes their exploration cognitively demanding and imposes heavy restrictions on content.
On the other hand, a number of prototypes rely on digital and physical representations. The most common approach, which we referred to as interactive tactile displays, is to place a tactile overlay (the physical representation) above a tablet: via the materiality of the tactile graphic, users can explore the representation using both hands; and via the tablet, they can also interact with it using multitouch gestures. These prototypes allow for a two-handed exploration that is both natural and efficient for retrieving and encoding spatial information, but they are physically limited by the use of a tactile overlay, making them impossible to update. Other types of prototypes that rely on digital and physical representations exist, but they are extremely expensive (e.g. braille displays, also referred to as raised-pin displays) or offer a slow and limited way to update the representation (e.g. maps that are 3D-printed based on users’ inputs [292]). As for Tangible User Interfaces (TUIs), which we describe in the following section, up to now, they have rarely been investigated for visually impaired users.
2.4
F
ROMT
ANGIBLEU
SERI
NTERFACES TOWARDSP
ROGRAMMABLEM
ATTERAs online graphical representations began to become commonplace, notably as a result of advances in the broad field of Visualization (including Information, Scientific and Geographic Visualization), a group of researchers from the MIT started to investigate how to bridge the gap between the physical and digital worlds. Graspable User Interfaces were first introduced by Fitzmaurice et al. [64] and were composed of several physical handles that the users could manipulate in order to directly interact with digital information. This new type of interface offered several advantages, among which the fact that it “encourages two handed interaction” and “facilitates interactions by making interface elements more ‘direct’ and more ‘manipulable’ by using physical artifacts” [64]. In a nutshell, this type of interface allows users to interact with physical and updatable representations. These interfaces were later designated as Tangible User Interfaces (TUI) [113] and soon become a fully-fledged research area whose community is still very active. The main idea underlying the design of TUIs is to combine digital representations with tangible (i.e. composed of physical objects) and intangible (i.e. audio and video projections) representations.
TUIs have paved the way for innovative types of interfaces calling for a greater updatability and physicality. Indeed, one limitation of TUIs is that they cannot be as easily updated as purely digital representations because they rely on real physical objects. To address this issue, alternatives have been proposed that rely on the use of tangible objects that can be moved by the system or that can move independently (e.g. small robots). This type of interface, referred to as actuated tabletop TUIs, allows for a greater updatability and, although more expensive than traditional tabletop TUIs, remains affordable. The promising development of actuated tabletop TUIs makes it
29
possible to envisage Swarm User Interfaces (SUIs) composed of a high number of small mobile tangible objects that could act as physical pixels and whose spatial layout could be used to display highly dynamic and yet physical graphical representations.
Another alternative lies in the development of shape displays, which do not rely on a set of distinct objects but on a single surface whose geometry can be controlled by a computer, similar to “digital clay”. These last two fields are strongly associated with the emerging field of data physicalization, which, although not limited to interactive or dynamic representations, “uses physical data representations to help people explore and communicate data” [121]. Illustrative examples of physicalizations include 3D-printed bar charts or arrays of motorized bars (see InForm [68] for example). All these novel types of interfaces can be considered to be part of a vision of highly updatable and physical interfaces driven by researchers from the MIT Media Lab4, the pioneer lab of TUIs. This vision, referred to as Radical Atoms, is represented by the
idea of Programmable Matter: “Radical Atoms is our vision for human interactions with dynamic physical materials that are computationally transformable and reconfigurable. Radical Atoms is based on a hypothetical, extremely malleable, and dynamic physical material that is bidirectionally coupled with an underlying digital model (bits) so that dynamic changes of the physical form can be reflected in the digital states in real time, and vice-versa” [112].
2.5
B
RIDGING THE GAP BETWEEN NON-
VISUAL PHYSICAL AND DIGITAL WORLDSFigure 1.1. Different types of displays that can be used to make graphical representations accessible to sighted or visually impaired users, according to their degree of availability and
updatability. Displays for visually impaired users that are commonly used or studied are written in italics. Devices that are not physical (i.e. that do not support multiple hand/finger
exploration) are written in blue.
Chapter 1 – Introduction
30
Figure 1.1 is an attempt to summarize the various types of technologies that have been used to make graphical representations accessible to visually impaired and sighted users, according to their degree of updatability and availability. The figure illustrates that research on physical graphical representations (in green) ranges from non-updatable representations (such as 3D-printed bar charts or 3D-printed maps) to fully updatable representations instanced by the idea of Programmable Matter. In between, a number of interfaces have and are being designed, including standard TUIs, actuated tabletop TUIs and shape displays.
The very concept of Programmable Matter is still a pure theoretical concept and has not been implemented yet. As for shape displays, despite the fact that they are being studied more and more, they are still in their infancy and are complex and/or expensive to build. Therefore, in the near future, non-actuated and actuated tabletop TUIs appear to be the most promising technologies to support the display of physical and updatable graphical representations. In fact, a number of TUIs are already used outside of research laboratories, in schools or museums, and the development of recent actuated tabletop TUIs (e.g. [81] and [223]) suggests that such interfaces could become more and more common in a couple of years.
However, research on graphical representations for visually impaired users has mainly focused on physical but non-updatable representations (such as tactile graphics, models or interactive tactile displays) or on updatable but non-physical representations (in blue). Very few prototypes of (actuated) TUIs for visually impaired users have been proposed, despite their advantages in terms of exploration and updatability. Besides, existing TUIs for visually impaired users have not been implemented or formally evaluated, which makes it very unclear to what extent the proposed interaction techniques and technical solutions are feasible and usable. One notable exception is the work of McGookin et al. [196], who implemented and evaluated a tabletop TUI that enables visually impaired users to access bar charts and line graphs, and who were the first to propose guidelines for the design of non-visual TUIs. Their work opened up new avenues for the design of interactive, physical and updatable maps and diagrams for visually impaired users and suggests that research on TUIs should not be restricted to sighted users and could be highly beneficial for visually impaired users as well. Building on this promising work and on research on visual graphical representations, we therefore aim to bridge the gap between the non-visual digital/updatable and physical/static worlds.
3
T
HESIS STATEMENT
There is a lack of research concerning the development of affordable, interactive, physical and updatable graphical representations for visually impaired users. Physicality is important to support strategies of multiple hand/finger exploration; updatability is important to support advanced functionalities (e.g. panning and zooming) and tasks (e.g. edition and reconstruction). In this thesis, we suggest that actuated and non-actuated tabletop Tangible User Interfaces could
fill this gap, by providing visually impaired users with an independent access to physical and yet updatable maps and diagrams.
31
4
R
ESEARCH QUESTIONS
The central research question of this thesis is to investigate to what extent tangible interaction
can be used to make updatable maps and diagrams accessible to visually impaired users.
As we briefly discussed in the previous sections, TUIs are limited by the use of tangible objects: their size, number and “expressivity” (i.e. what type of information they are able to represent) limit how complex the tangible representation can be. In particular, in the absence of vision, it is not possible to rely on visual feedback to enhance the tangible representation. Other constraints must be taken into account when designing TUIs for visually impaired users, such as providing audio feedback to compensate for the absence of visual feedback, and ensuring that the tangible objects remain stable during exploration. Given these considerations, our thesis was driven by the following research questions:
Research Question 1: What are the benefits and limitations of tangible maps and diagrams compared to current practices and existing research prototypes?
a. What are the current practices and what are their benefits and limitations?
b. Which approaches have been considered by researchers and what are their benefits and limitations?
c. What are the known benefits of TUIs and to what extent these benefits may be relevant to visually impaired users?
d. What are the inherent limitations of TUIs and are there further limitations specific to TUIs for visually impaired users?
Research Question 2: How to design tangible maps and diagrams for visually impaired users?
a. What are the design challenges specific to TUIs for visually impaired users?
b. Have these design challenges been addressed in the literature, and if so, were the proposed solutions satisfying?
c. How to address design challenges for which no suitable solutions have yet been proposed?
Research Question 3: Given the limitations inherent to TUIs and specific to TUIs for visually impaired users, what is the design space of tasks and graphical representations supported by TUIs for visually impaired users?
a. Which tasks can be supported by (or particularly adapted to) tabletop tangible maps and diagrams for visually impaired users?
b. What type of graphical representation can be made accessible with TUIs? How complex and expressive5 tangible maps and diagrams can be?
5 In this thesis, we consider that the complexity of a graphical representation is related to the
amount of data that it conveys, while the expressivity of a graphical representation is related to the nature of data that it conveys. For example, visual maps can be used to convey information about landmarks, streets, railways, parks, etc. and are often very expressive; their complexity depends on the number of elements being displayed and/or on the possibility for the user to interact with them through panning and zooming. See Glossary.
![Figure 2.16. The GraVVITAS prototype [83]. The prototype enabled visually impaired users to explore various graphical representations (right) and provided two points of contact (the](https://thumb-eu.123doks.com/thumbv2/123doknet/2227280.15642/81.892.170.739.134.338/gravvitas-prototype-prototype-visually-impaired-graphical-representations-provided.webp)
![Figure 2.21. The BrailleDis 9000 tablet, composed of 7200 pins, was used in [348] to give visually impaired users access to dynamic maps](https://thumb-eu.123doks.com/thumbv2/123doknet/2227280.15642/89.892.174.712.535.721/figure-brailledis-tablet-composed-visually-impaired-access-dynamic.webp)
![Figure 2.24. Left: the Model-Control-Representation (intangible and tangible) or MCRit model of TUIs [305]](https://thumb-eu.123doks.com/thumbv2/123doknet/2227280.15642/97.892.174.714.818.1006/figure-left-model-control-representation-intangible-tangible-mcrit.webp)