S TAT I S T I C A L
Ageing Europe
LOOKING AT THE LIVES
Ageing Europe
LOOKING AT THE LIVES
Foreword
Foreword
Ageing Europe — looking at the lives of older people in the EU provides a broad range of statistics that describe the everyday lives of the European Union’s (EU) older generations.
Figures covering the total population do not always reveal the full and sometimes complex picture of what is happening at a more detailed level within society. Looking at various socioeconomic statistics by age promotes a better understanding of inter-generational differences and also allows us to draw a detailed picture of the daily lives of older people across the EU.
Population ageing is a phenomenon that affects almost every developed country in the world, with both the number and proportion of older people growing across the globe. This transformation is likely to have a considerable impact on most aspects of society and the economy, including housing, healthcare and social protection, labour markets, the demand for goods and services, macroeconomic and fiscal sustainability, family structures and intergenerational ties.
As Europeans expect to live increasingly long lives, their attention turns to how they can make the most of their retirement. Growing numbers of older people engage in some kind of meaningful activity or employment: some take-up new pastimes/sports or learn new skills, others decide to volunteer or travel, while some may work on a part-time basis. Studies confirm that older people are more likely to maintain their physical and mental health by remaining active and preserving their social contacts; this may also improve their chances of a happier retirement with higher levels of life satisfaction.
Mariana Kotzeva Director-General, Eurostat
Abstract
Abstract
Statistical information is an important tool for understanding and quantifying the impact of political decisions on different age groups within society. Ageing Europe — looking at the lives of older people in the EU provides a detailed picture of the daily lives of older people in the EU with data for individual EU Member States and EFTA countries.
Each chapter presents statistical information in tables, figures and maps, accompanied by a descriptive analysis highlighting the main findings. Statistical indicators are presented for the following six subjects: population developments; housing and living conditions; health and disability; working and moving into retirement; pensions, income and expenditure; social life and opinions.
Editorial team
Helene Strandell and Pascal Wolff
Eurostat, Unit B4 — Dissemination and user support
Contact details
Eurostat
Bâtiment Joseph Bech 5, rue Alphonse Weicker 2721 Luxembourg
E-mail: estat-user-support@ec.europa.eu
Production
Informa s.à r.l. — Giovanni Albertone, Simon Allen and Andrew Redpath
For more information please consult
Eurostat website: https://ec.europa.eu/eurostat
Statistics Explained: https://ec.europa.eu/eurostat/statistics-explained
Acknowledgements
The editors of the publication would like to thank their Eurostat colleagues who were involved in its preparation: Timothy Allen, Philippe Bautier, Louise Corselli-Nordblad, Susanne Taillemite (Eurostat Unit B4 — Dissemination and user support); Jørgen Rasmussen, Daniela Scirankova (Eurostat Unit E4 — Regional statistics and geographical information); Marta Beck-Domżalska, Jean-Louis Mercy (Eurostat Unit F1 — Social indicators: methodology and development; relations with users); Silvia Andueza Robustillo, Veronica Corsini, Diana Ivan, Giampaolo Lanzieri, Monica Marcu, Gabriela Senchea-Badea (Eurostat Unit F2 — Population and migration); Mélina Antuoformo, Fabienne Montaigne (Eurostat Unit F3 — Labour market and lifelong learning); Lucian Agafitei, Emilio Di Meglio, Gerard Hanney, Barbara Moench, Erika Taidre (Eurostat Unit F4 — Income and living conditions; quality of life); Ilze Burkevica, Silvia Crintea, Gilberto Gambini, Emmanuel Kailis, Ángeles Hermosa López, Christopher Jung, Valentina Rusconi (Eurostat Unit F5 — Education, health and social protection); Christophe Demunter, Krista Dimitrakopoulou (Eurostat Unit G2 — European businesses); Michaela Grell, Bettina Obringer, Jadwiga Tudek (Eurostat Unit G4 — Innovation and digitalisation).
Contents
Contents
Foreword 3
Introduction 7
1. Population developments 13
2. Housing and living conditions 31
3. Health and disability 47
4. Working and moving into retirement 73
5. Pensions, income and expenditure 95
Introduction
Why does population ageing
matter?
There were 101.1 million older people — defined here as those aged 65 years or more — living in the EU-28 at the start of 2018; this equated to almost one fifth (19.7 %) of the total population. During the next three decades, the number of older people in the
European Union (EU) is projected to follow an upward path, peaking at 149.2 million inhabitants in 2050; their relative share of the total population will also gradually increase and is projected to reach 28.5 % in 2050. Population ageing has resulted primarily from a long-term fall in fertility rates and increased life expectancy (longevity), the latter reflecting a number of different factors, including:
• reductions in child mortality;
• advances in public health and medical technologies;
• increased awareness of the benefits linked to a healthy lifestyle;
• a move away from heavy labour towards tertiary occupations;
• improved living conditions. These changes have led to a growing number and share of older people and this process of demographic ageing can, in many ways, be considered a success story. For a large number of people there is much to look forward to in later life — especially if these extra years are in relatively good health. Older people are quite often more satisfied with life and many feel a stronger connection to their families, friends and local communities.
The growing number and share of older people within society poses a range of economic challenges. Some analysts suggest that population ageing will likely exert downward pressure on economic growth, reduce labour supply, lead to higher (age-related) social costs and impact on the sustainability of government finances. These arguments are centred on the assumption
that the old-age dependency ratio — in other words, the number of older people relative to the size of the working-age population — will continue to rise. As this ratio increases, there is a decline in the size of the workforce that is potentially available to take care of the older generations and this has already led to an increased burden on government finances, changes to the statutory retirement age and lower levels of pension provision.
Other observers argue that population ageing need not impede economic growth and that it may instead provide a stimulus for developing new goods and services, for example, housing or transport adapted to the needs of an ageing population, or a range of new social care services. Furthermore, it is increasingly common to find a growing share of older people facing fewer risks (than younger generations) from poverty or social exclusion; this pattern has become all the more apparent in the aftermath of the global financial and economic crisis, with real wages stagnating or falling for much of the working population. In some EU Member States, this had led to a growing proportion of older people being relatively well off, which could result in a ‘demographic dividend’, insofar as ageing populations may choose to spend more.
Defining older people
There are different ways of defining older people, while public perception as to what constitutes being old can differ widely. Statistics on ageing generally categorise older people as being above a certain age threshold. Indeed, the United Nations (UN)
defined older people as those aged 60 years or more in World Population Ageing 2013, while the World Health Organisation (WHO)
states that older people in developed world economies are commonly defined as those aged 65 years or more. The WHO also uses an alternative definition, whereby an older person is defined as someone who has passed the median life expectancy at birth.
Introduction A practical approach has been taken within
Ageing Europe — looking at the lives of older people in the EU. The following terminology is employed:
• older people — those aged 65 years or more;
• very old people — those aged 85 years or more.
The principal focus of this publication concentrates on older people (aged 65 years or more). Nevertheless, some sections — for example, the transition from work into retirement — present data covering people aged 55 years or more. Furthermore, the constraints of official statistics in general — and more specifically the various surveys that have been employed as sources of information — have a practical impact on the information presented. Survey-specific requirements for each of the main sources determine the availability and choice of age groups available; this explains why some sections refer simply to a broad age range covering older people aged 65 years or more, whereas other sections might present data for 10-year age groups covering people aged 55-64 years, 65-74 years, 75-84 years and 85 years or more.
EU policy
With populations ageing across Europe, pensions, healthcare and long-term care systems risk becoming financially unsustainable, as a shrinking labour force may no longer be able to provide for a growing number of older people. Active ageing is the European Commission’s
policy directed towards ‘helping people stay in charge of their own lives for as long as possible as they age and, where possible, to contribute to the economy and society’. Policymakers hope to address these challenges by turning them into opportunities, with a focus on extending
working lives and providing older people access to adequate social protection and, where necessary, supplementary pensions. Living longer does not necessarily mean living a healthier, more active and independent life — this is all the more important given the growing number of older and very old people in the EU. The
European innovation partnership on active and healthy ageing was created in 2011 and aims to foster innovation that will promote active ageing and raise healthy life expectancy.
Furthermore, as an increasing number of older people reach an age where declining physical and mental health makes them dependent on help from others, there are considerable implications for long-term care expenditure. The European pillar of social rights stresses the right to affordable long-term care services of good quality, in particular home-based care and community-based services. It also underlines that everyone in old age should have a pension that is commensurate with their contributions and the right to resources that ensure living in dignity.
The Social Protection Committee has looked at ways of providing adequate and sustainable long-term care in ageing societies, through investing in preventative care, rehabilitation, age-friendly environments, and more ways of delivering care that are better adjusted to people’s needs and existing abilities; these developments could potentially create many more jobs in the long-term care sector and much greater demand for a wide range of age-related goods and services, including assistive technology.
Every three years, the European Commission analyses ageing from a monetary
perspective through a report on economic and budgetary projections — the latest of
Introduction
these was released in 2018. The publication provides information on age-related expenditure projections, based on Eurostat population projections; it highlights the budgetary impact of ageing on the sustainability of EU public finances.
Structure of this publication
Ageing Europe — looking at the lives of older people in the EU focuses on the most recent data available, usually for 2017 or 2018. It also provides analyses of changes over time: a majority of these go back in time to look at recent developments, although they are supplemented by a set of population projections shown through to 2050. The findings are supported by a range of tables, figures and maps which are designed to highlight inter-generational variations. Chapter 1 looks at population
developments: all of the EU Member States will experience population ageing in the coming decades, however, the size of this demographic challenge will vary considerably as will the drivers of population ageing: is the ageing process driven by low fertility rates and/or increases in life expectancy and will it be further amplified by net migration (more people emigrating than people immigrating)?
Chapter 2 provides information on housing and living conditions for older people. A relatively high share of older people in the EU lives in rural areas; this distribution may have an important bearing on policymakers when assessing access to various services for older people. The type of household
in which older people live also plays an important role in determining their quality of life, risk of poverty, or the services that they require, with concerns over the growing number of older people living alone. Chapter 3 looks at issues related to health and disability. Health is an important measure of well-being: this is particularly true
for older people in relation to their personal independence and participation in local communities. As older people have different
healthcare requirements, health systems will need to adapt and it is likely that there will be a considerable surge in demand for long-term care (in residential facilities) and services covering diseases that typically affect older people (for example, arthritis, mental health/ dementia, sensory impairment).
Chapter 4 presents information on the transition from work into retirement. Economic activity rates for older people in the EU have gradually increased during the last three decades. Work-life balance is a concept that becomes particularly relevant to older workers as they plan their exit from the labour force: a growing number benefit from flexible working patterns that allow them to remain in work until a later age, increasing their income and reducing their reliance on government support.
Chapter 5 provides information on
pensions, income, and expenditure. As people age their spending patterns are transformed: for example, older people tend to devote a higher proportion of their expenditure to health, food or the home in which they live, and a lower proportion to transport, clothing and footwear. Older people are relatively well off in several of the EU Member States: indeed, they are often found to have a lower risk of poverty than other age groups. This inter-generational divide is likely to grow in the coming years, with younger generations increasingly under pressure to save adequately for their retirement and to stop work at a later age. Chapter 6 concludes by presenting information on the social life and opinions of older people. Retirees who are fortunate to be in good health are much more likely to take part in a range of activities, such as returning to education, taking up a hobby, carrying out volunteer work, travelling or playing sports. Alongside participation in a diverse range of activities, another factor
Introduction that can have an important influence on the
well-being of older people is the frequency with which they enjoy regular contacts with family and/or friends. The subjective well-being of older people may be analysed through self-reported measures of overall life satisfaction. In conclusion, it is particularly inspiring to note that older people (aged 65 years or more) had higher levels of life satisfaction (compared with other age groups) in several western and northern EU Member States.
FOR MORE INFORMATION:
Active ageing — https://ec.europa.eu/social/ main.jsp?langId=en&catId=1062
European innovation partnership on active and healthy ageing — https://ec.europa.eu/ eip/ageing/home_en
European pillar of social rights — https:// ec.europa.eu/commission/priorities/deeper-and-fairer-economic-and-monetary-union/ european-pillar-social-rights_en
Delivering on the European pillar of social rights — https://ec.europa.eu/social/main. jsp?langId=en&catId=1226
European social protection committee — https://ec.europa.eu/social/main. jsp?catId=758
2018 Ageing report: policy challenges for an ageing society — https://ec.europa.eu/info/ news/economy-finance/policy-implications-ageing-examined-new-report-2018-may-25_ en
A short reading guide
Ageing Europe — looking at the lives of older people in the EU is available in four formats on Eurostat’s website: as an innovative digital publication, as an online publication via
Statistics Explained, as a PDF file, and as a traditional paper publication.
COVERAGE AND TIMELINESS OF THE DATA
The data presented within Ageing Europe — looking at the lives of older people in the EU were extracted during May and June 2019; the publication was drafted during the summer of 2019.
Ageing Europe — looking at the lives of older people in the EU contains statistics for the Member States of the EU and, where available, data are also shown for the EFTA countries (Iceland, Liechtenstein, Norway and Switzerland). The EU-28 aggregate is only presented when information was available for all of the EU Member States; any incomplete totals that were created have been systematically footnoted. As such, any time series for the EU-28 systematically refer to a sum or an average for the 28 Member States at the time of drafting, regardless of when they joined the EU.
The geographical descriptions used to group EU Member States, for example, ‘northern’, ‘eastern’, ‘southern’ and ‘western’ are not intended as political categorisations. Rather, these references are made in relation to the geographical location of one or more EU Member States, as listed within the geography domain of Eurovoc, the European Commission’s multilingual thesaurus. The northern Member States are often distinguished between the Baltic Member States (Estonia, Latvia and Lithuania) and the
Nordic Member States (Denmark, Finland and Sweden).
Throughout the publication, a billion is used to mean a thousand million and a trillion to mean a thousand billion.
DATA SOURCES
A large number of different sources were used to compile the information presented in this publication. As a result, the latest available reference year may vary across figures, tables and maps — as each aims
Introduction
to show the freshest information. The most common reference period is 2018, although it was necessary to go back to earlier reference periods for some surveys, ad-hoc modules or one-off studies. If data for a particular reference period were not available (at the time of data extraction) for a particular country, then efforts were made to fill figures, tables and maps with data for previous reference periods (these exceptions are footnoted).
Eurostat’s data are published with accompanying metadata that provide background information on each source, as well as specific information (flags) for individual data cells. These flags provide information pertaining to the status of the data, for example, detailing whether a value is estimated, provisional or forecasted. Such flags and breaks in series are indicated, as appropriate, in the footnotes provided under each figure, table or map.
In particular cases, use has been made of sources from outside of the European statistical system; these are systematically credited in the source under each figure, table or map. The most common use of such sources concerns information provided in
Eurobarometer public opinion surveys that are produced by the European Commission’s Directorate-General for Communication. These surveys provide qualitative studies on the motivations, feelings and reactions of selected age groups towards a given subject (this source was principally used in Chapters 5 and 6).
Although a majority of the data presented in Ageing Europe — looking at the lives of older people in the EU concern information for the EU Member States and EFTA countries, there are some figures and tables that provide international comparisons with non-member countries (these are mainly located in Chapters 1 and 2). The principal source of information for these global comparisons is the Population Division of the Department of Economic and Social Affairs in the United
Nations — with demographic statistics from the 2019 Revision of World Population Prospects.
Access to data and other
information on Eurostat’s
website
Eurostat’s database may have fresher or more disaggregated data due to the continuous nature of data collection and processing (resulting in updates and new reference periods being added throughout the year). The online data code(s) below each figure, table or map helps users to locate the freshest data.
Many terms and abbreviations in the publication may be linked to glossary pages on Eurostat’s Statistics Explained website ( https://ec.europa.eu/eurostat/statistics-explained/index.php/Thematic_glossaries). The simplest way to find more information on the broad range of topics that appear within Ageing Europe — looking at the lives of older people in the EU is through Eurostat’s website. It provides users with free access to data, publications and methodologies. The website is updated daily with the latest and most comprehensive statistical information available on: the EU-28 and the euro area, the individual EU Member States, EFTA countries, candidate countries and potential candidates.
Disclaimer
All statements on policies within this publication are given for information purposes only. They do not constitute an official policy position of the European Commission and are not legally binding. To know more about such policies, please consult the European Commission’s website at: https://ec.europa.eu.
1
Population
developments
1
Population developmentsFigure 1.1: Population developments, by age class, EU‑28 2001‑2050
(million inhabitants) 0 50 100 150 200 250 300 350 400 450 500 550 2001 2005 2010 2015 2020 2025 2030 2035 2040 2045 2050 ≥85 years 75-84 years 65-74 years 55-64 years <55 years
Note: all data as of 1 January. 2008, 2010-2012, 2014-2015 and 2017: breaks in series. 2019-2050: population according to the 2018 projections, baseline variant (EUROPOP2018). The vertical line marks the divide between official historical data and EUROPOP2018 population projections.
Source: Eurostat (online data codes: demo_pjangroup and proj_18np)
Europeans are living longer than ever before and the age profile of society is rapidly evolving. Demographic ageing means the proportion of people of working age in the
European Union (EU) is shrinking, while the number of older people is expanding; this pattern will continue in the next couple of decades, as the post-war baby-boom generation completes its move into retirement. Such developments are likely to have
profound implications, not only for individuals, but also for governments, business and civil society, impacting, among others: health and social care systems, labour markets, public finances and pension entitlements (each of which is covered by subsequent chapters in this publication). However, the focus of this opening chapter is a set of demographic indicators that describe the latest developments for an ageing Europe.
Older people — population
overview
Population ageing will rapidly transform the structure of society
Population ageing is a long-term development that has been evident for several decades in Europe. This process is being driven by historically low fertility rates, increasing life expectancy and, in some cases, migratory patterns (for example, those EU Member States characterised by net inflows of retired persons). Population projections suggest that the ageing of the EU’s population will quicken in the coming decades, with a rapid expansion in the number and share of older people.
The total population of the EU-28 is projected to increase from 512 million at the start of 2018 to peak at 525 million by 2044, before falling marginally through to 2050 (see Figure 1.1). The population of older people (defined here as those aged 65 years or more) will increase
1
Population developments
Figure 1.2: People aged ≥55 years, by age class, 2018 and 2050
(% share of total population)
0 5 10 15 20 25 30 35 40 45 50 EU -2 8 Po rt ug al Ita ly Bu lg ar ia Li th ua ni a Cr oa tia G re ec e Sl ov ak ia Po la nd Sl ov en ia Sp ai n Ro m an ia Es to ni a La tv ia H un ga ry Cz ec hi a G er m an y M al ta Fi nl an d A us tr ia Cy pr us N et he rla nd s Be lg iu m Fr an ce D en m ar k Ire la nd Lu xe m bo ur g U ni te d Ki ng do m Sw ed en Sw itz er la nd N or w ay Ic el an d Li ec ht en st ei n ( 1) 65-74 years in 2018 55-64 years in 2018 ≥85 years in 2018 75-84 years in 2018 ≥55 years in 2050
Note: all data as of 1 January. Ranked on the projected share of people aged ≥55 years in the total number of inhabitants in 2050 (according to the 2018 projections, baseline variant (EUROPOP2018)).
(1) Population projections for 2050: not available.
Source: Eurostat (online data codes: demo_pjangroup and proj_18np)
significantly, rising from 101 million at the start of 2018 to reach 149 million by 2050. During this period, the number of people in the EU-28 aged 75-84 years is projected to expand by 60.5 %, while the number aged 65-74 years is projected to increase by 17.6 %. In contrast, the latest projections suggest that there will be 9.6 % fewer people aged less than 55 years living in the EU-28 by 2050.
There will be more than half a million centenarians by 2050
Perhaps the most remarkable aspect of the projected changes to the EU’s population structure concerns the progressive ageing of the older population itself: the relative importance of the very old (people aged 85 years or more) is growing at a faster pace than any other age group. Between 2018 and 2050, the number of very old people in the EU-28 is projected to more than double, up 130.3 %. To give some idea of the magnitude of this change, the number of people aged 85 years or more is projected to increase from 13.8 million in 2018 to 31.8 million by
2050, while the number of centenarians (people aged 100 years or more) is projected to grow from close to 106 000 in 2018 to more than half a million by 2050.
Given the shrinking size of the working-age population and the growing number of older and very old people in society, one of the most pressing concerns for policymakers is to encourage older people to remain, for as long as possible, in the labour force. In 2018, those people aged 55 years or more accounted for almost one third (32.8 %) of the total EU-28 population. Among the EU Member States, this share ranged from a high of more than one third (35.9 %) in Italy down to just less than one quarter (24.7 %) of the population in Ireland. The share of this age group (55 years or more) in the EU-28 population is projected to reach 40.6 % by 2050; it will increase in each of the EU Member States. By 2050, those aged 55 years or more are projected to account for almost half (47.1 %) of the total population in Portugal, and for at least 45.0 % in Italy, Bulgaria, Lithuania and Croatia.
1
Population developmentsFigure 1.3: Population pyramids, EU‑28, 2018 and 2050
(% share of total population)
5 4 3 2 1 0 1 2 3 4 5 < 5 5-9 10-14 15-19 20-24 25-29 30-34 35-39 40-44 45-49 50-54 55-59 60-64 65-69 70-74 75-79 80-84 ≥85 A ge c la ss (y ea rs ) Men Women Solid colour: 2018 Bordered: 2050
Note: all data as of 1 January. 2050: population according to the 2018 projections, baseline variant (EUROPOP2018).
Source: Eurostat (online data codes: demo_pjangroup and proj_18np) The population is turning increasingly grey
Population pyramids provide an illustration as to how the total population is distributed across various age groups. Each pyramid shows the distribution of the population by sex and by five-year age group, with bars corresponding to the share of the given sex and age group in the total population; the sex and age structure of a population determines the ultimate shape of each population pyramid.
Figure 1.3 presents two pyramids for the EU-28 that are overlaid, one showing the situation at the start of 2018 (the solid bars) and the other a projection for 2050 (the bars with borders); they highlight the demographic transition that is projected to take place across the EU during the next three decades. The EU-28 population pyramid on 1 January 2018 is narrow at the bottom and is more like a rhomboid, with a bulge in the middle of the pyramid
indicating that the baby-boom generation are fast approaching retirement. Falling fertility rates from the 1970s onwards explain why the base of the pyramid for 2018 is relatively narrow; this process is known as ‘ageing at the bottom’ (of the population pyramid).
In the coming decades, a high number of baby-boomers will swell the number of old and very old people as the EU-28 population pyramid takes on an almost pillar-like shape, with each age group having a similar share of the total population. The growing proportion of older people may be explained in part by increased longevity; this process is often referred to as ‘ageing at the top’ (of the population pyramid). One of the most striking aspects of the pyramid for 2050 is the widening of bars for the upper age groups, indicating that a greater share of the population will live to be very old (85 years or more); this is especially true among women.
1
Population developments
Figure 1.4: Gender imbalance for people aged ≥65 years, by age class, 2018
(ratio of women to men)
0.5 1.0 1.5 2.0 2.5 3.0 3.5 4.0 EU -2 8 La tv ia Li th ua ni a Es to ni a H un ga ry Sl ov ak ia Po la nd Bu lg ar ia Cr oa tia Ro m an ia Po rt ug al Cz ec hi a Sl ov en ia Fr an ce A us tr ia Sp ai n Ita ly G er m an y Fi nl an d Be lg iu m G re ec e Lu xe m bo ur g M al ta U ni te d Ki ng do m D en m ar k N et he rla nd s Cy pr us Sw ed en Ire la nd Sw itz er la nd Li ec ht en st ei n N or w ay Ic el an d
65-74 years 75-84 years ≥85 years Note: all data as of 1 January. Ranked on the ratio of women to men for all people aged ≥65 years.
Source: Eurostat (online data code: demo_pjangroup)
Older people — differences
between the sexes
There were more than twice as many very old women as very old men
Women consistently outnumber men at older ages within the EU-28 population. In recent years, this gap has started to narrow, as an increasing number of men survive to older ages. In 2018, there were, on average, 1.32 women aged 65 years or more in the EU-28 for every man of the same age. The biggest gender imbalances were recorded in the
Baltic Member States: for example, there were more than two women aged 65 years or more for every man of the same age in Latvia.
Figure 1.4 shows that this gender gap was most apparent among very old people (aged 85 years or more). In 2018, there were more than twice as many very old women in the EU-28 (compared with very old men), a ratio of 2.08 : 1. The largest gaps between the sexes for this age group were also recorded in the Baltic Member States, as very old women outnumbered very old men by more than three to one. At the other end of the range, the gender imbalance for very old people was relatively narrow in Cyprus and particularly Greece (where there were 1.47 very old women for every man of the same age).
1
Population developmentsFigure 1.5: Median age of the population, 1990, 2018 and 2050
(years) 25 30 35 40 45 50 55 EU -2 8 ( 1)( 2) Ita ly G er m an y Po rt ug al G re ec e Bu lg ar ia Li th ua ni a Sl ov en ia Cr oa tia ( 3) Sp ai n La tv ia A us tr ia Fi nl an d H un ga ry N et he rla nd s Cz ec hi a Ro m an ia Es to ni a D en m ar k Be lg iu m Fr an ce ( 2)( 4) Po la nd Sw ed en M al ta Sl ov ak ia U ni te d Ki ng do m Lu xe m bo ur g Cy pr us Ire la nd Li ec ht en st ei n ( 5) Sw itz er la nd N or w ay Ic el an d 1990 2018 2050
Note: 2050, population according to the 2018 projections, baseline variant (EUROPOP2018). (1) 1990: excluding Croatia.
(2) 2018: provisional.
(3) 1990: not available.
(4) 1990: excludes French overseas territories.
(5) Projections for 2050: not available.
Source: Eurostat (online data codes: demo_pjanind and proj_18ndbi)
Older people — increasingly
old and with growing
dependency
The median age will increase by 3.8 years by 2050
The median age of a population provides a useful summary of the overall age profile. A range of factors may influence the median age, including: fertility, life expectancy, social and economic development. In 2018, the median age of the EU-28 population was 43.1 years (see Figure 1.5). Across the EU Member States, the median age was below 40.0 years in Luxembourg, Cyprus and Ireland (where the lowest median age was recorded, 37.3 years).
By contrast, the median age of the population was considerably higher in Germany (46.0 years) and peaked in Italy (46.3 years). The EU-28’s median age is projected to increase by 3.8 years during the next three decades, to reach 46.9 years by 2050. This pattern will be repeated in each of the EU Member States, with the median age of the population projected to rise by 8.0 years or more in Malta, Poland, Slovakia and Cyprus. At the other end of the range, the age profiles of Denmark, Belgium, France, Germany and Sweden will likely evolve at a slower pace, as their median ages are projected to increase by less than 3.0 years during the period under consideration.
1
Population developments
Figure 1.6: Population structure indicators, EU‑28, 2001‑2050
(%) 0 10 20 30 40 50 60 70 2001 2005 2010 2015 2020 2025 2030 2035 2040 2045 2050
Share of total population aged 15-64 years Old-age dependency ratio
Share of total population aged ≥65 years
Note: the old-age dependency ratio is calculated as the number of people aged ≥65 years divided by the number of people aged 15-64 years, expressed as a percentage. 2008, 2010-2012, 2014-2015 and 2017-2018: breaks in series. 2019-2050: population according to the 2018 projections, baseline variant (EUROPOP2018). The vertical line marks the divide between official historical data and EUROPOP2018 population projections.
Source: Eurostat (online data codes: demo_pjanind and proj_18ndbi) In the timespan of 50 years, the old-age
dependency ratio is projected to more than double
The old age dependency ratio may be used to study the level of support given to older people by the working-age population; this ratio expresses the relative size of older population compared with the working-age population. The old-working-age dependency ratio for the EU-28 was 23.5 % in 2001 (see
Figure 1.6); as such, there were just over four persons of working age for every person aged 65 years or more. By 2018, the old-age dependency ratio was 30.5 %, in other words, there were just over three persons of working age for every older person. Population projections suggest that the EU-28 old-age dependency ratio will continue to climb and will reach 49.9 % by 2050, when there will be two persons of working age for each older person.
1
Population developmentsFigure 1.7: Old‑age dependency ratio, 1990, 2018 and 2050
(%) 0 10 20 30 40 50 60 70 EU -2 8 ( 1)( 2) Ita ly Fi nl an d G re ec e Po rt ug al G er m an y Bu lg ar ia Sw ed en Fr an ce ( 2)( 3) La tv ia Cr oa tia ( 4) Es to ni a D en m ar k Li th ua ni a Cz ec hi a Sl ov en ia Sp ai n Be lg iu m N et he rla nd s U ni te d Ki ng do m H un ga ry M al ta A us tr ia Ro m an ia Po la nd Cy pr us Sl ov ak ia Ire la nd Lu xe m bo ur g Sw itz er la nd N or w ay Li ec ht en st ei n ( 5) Ic el an d 1990 2018 2050
Note: the old-age dependency ratio is calculated as the number of people aged ≥65 years divided by the number of people aged 15-64 years, expressed as a percentage. 2050: population according to the 2018 projections, baseline variant (EUROPOP2018).
(1) 1990: excluding Croatia.
(2) 2018: provisional.
(3) 1990: excludes French overseas territories.
(4) 1990: not available.
(5) Projections for 2050: not available.
Source: Eurostat (online data codes: demo_pjanind and proj_18ndbi)
In 2018, the old-age dependency ratio ranged, across the EU Member States, from lows of 20.6 % in Luxembourg and 21.2 % in Ireland to highs of 34.1 % in Greece, 34.2 % in Finland and 35.2 % in Italy. Figure 1.7 illustrates how this ratio is projected to evolve during the next three decades: between 2018 and 2050, the old-age dependency ratios of Slovakia, Ireland, Poland and Spain are projected to increase at a particularly rapid pace, at least doubling.
By 2050, half of the EU Member States are projected to have an old-age dependency ratio above 50.0 %; in other words, they will have less than two persons of working age for every person aged 65 years or more. In Greece and Italy, the old-age dependency ratio is projected to reach a level above 60.0 %, while it will peak at 65.8 % in Portugal. At the other end of the range, the old-age dependency ratio is projected to remain below 40.0 % in 2050 in the United Kingdom, Malta, Luxembourg, Sweden and Cyprus.
1
Population developments
Figure 1.8: People aged ≥85 years, by sex, 2001 and 2018
(% share of total population)
EU -2 8 Ita ly G re ec e Fr an ce Sp ai n Po rt ug al Be lg iu m G er m an y Fi nl an d Sw ed en A us tr ia Es to ni a Li th ua ni a Sl ov en ia U ni te d Ki ng do m La tv ia N et he rla nd s D en m ar k Cr oa tia Po la nd H un ga ry Lu xe m bo ur g Bu lg ar ia Ro m an ia Cz ec hi a M al ta Ire la nd Cy pr us Sl ov ak ia Sw itz er la nd N or w ay Ic el an d Li ec ht en st ei n 0.0 0.5 1.0 1.5 2.0 2.5 3.0 3.5 2001: men 2001: women 2018: men 2018: women
Source: Eurostat (online data code: demo_pjangroup) A rapid expansion in the number of very old people
The growing number of very old people (aged 85 years or more) in the EU-28 has a range of consequences. One of the principal areas of concern for policymakers is the cost of providing adequate health and long-term care, as very old people tend to consume proportionally more social services (their needs are usually greater than those of other age groups).
In 2018, the share of the very old people in the EU-28 population was 2.7 %. There were seven EU Member States where this share was less than 2.0 %, with Ireland, Cyprus and Slovakia each registering the lowest proportion (1.5 %). By contrast, France and
three southern Member States — Spain, Greece and Italy — had the highest shares of very old people, with a peak of 3.5 % recorded in Italy.
There were more very old women than very old men in each of the EU Member States: however, the share of very old men was generally rising at a faster pace than the share of very old women between 2001 and 2018. Those Member States with the highest shares of very old people in their populations were characterised by having relatively large populations of very old men; this was particularly true in Greece, where very old men accounted for 1.3 % of the total population (both sexes) in 2018. The highest share for very old women was recorded in Italy (2.4 % of the total population).
1
Population developmentsFigure 1.9: People aged ≥65 years, by age class, 2015
(% share of total population)
W or ld EU -2 8 Ita ly G er m an y Fr an ce U ni te d Ki ng do m Ja pa n Ca na da A us tr al ia U ni te d St at es Ru ss ia So ut h Ko re a A rg en tin a Ch in a Br az il Tu rk ey M ex ic o In di a In do ne si a So ut h A fr ic a Sa ud i A ra bi a 0 5 10 15 20 25 30 ≥85 years 75-84 years 65-74 years
Note: all data for the EU-28 and EU Member States as of 1 January; world and G20, mid-year population.
Source: Eurostat (online data code: demo_pjangroup) and United Nations, World Population Prospects: the 2019 Revision
Older people — global
developments
While population ageing is a global phenomenon, the ageing process is more advanced in some regions of the world than in others. The pace of population ageing in many developing countries is substantially faster than the historical precedents observed in developed economies. As such, the former are likely to face far greater pressures when adapting to the needs of their ageing populations.
Behind Japan, the EU provides one of the most distinctive examples of demographic ageing
The G20 countries are at various stages of economic and population development. While the process of population ageing is particularly established in Japan, this may
be contrasted with South Africa or Saudi Arabia where young people dominate the population profile.
Figure 1.9 shows the share of older people (aged 65 years or more) in the total
populations of the G20 nations. In 2015, older people accounted for 8.2 % of the world’s population. At one end of the spectrum, the share of older people was more than three times the global average in Japan, where the share of people aged 65 years or more in the total population was more than one quarter (26.0 %). The EU-28 had the next highest share of older people among the G20 nations (18.9 %). Half of the remaining G20 countries had shares of older people in their total populations that were above the global average; these included the United States (14.6 %) and China (9.3 %). Those G20 countries where older people accounted for a relatively small proportion of
1
Population developments
Figure 1.10: Median age of the population, 1980, 2015 and 2050
(years) 0 5 10 15 20 25 30 35 40 45 50 55 60 W or ld EU -2 8 ( 1) Ita ly G er m an y Fr an ce ( 2) U ni te d Ki ng do m So ut h Ko re a Ja pa n Ch in a Ca na da Br az il U ni te d St at es A us tr al ia Ru ss ia Tu rk ey Sa ud i A ra bi a M ex ic o A rg en tin a In di a In do ne si a So ut h A fr ic a 1980 2015 2050
Note: 2050, EU-28 and EU Member States population according to the 2018 projections, baseline variant (EUROPOP2018). 2050, world and G20 population projections according to the United Nations Population Division medium variant.
(1) 1985 (excluding Croatia) instead of 1980.
(2) 1980: excludes French overseas territories.
Source: Eurostat (online data codes: demo_pjanind and proj_18ndbi) and United Nations, World Population Prospects: the 2019 Revision
the total population are often characterised as emerging economies, with relatively young populations and expanding labour forces; examples include Turkey (where older people accounted for 7.9 % of the total population), Mexico (6.7 %), India (5.6 %) and Indonesia (5.4 %).
In 2015, the median age of the world population was 29.6 years. Japan (46.4 years) had the highest median age among the G20 nations and was followed by the EU-28 (42.4 years). There were only four G20 countries where the median age was below the world average: Indonesia, Mexico, India and South Africa.
(1) Note the methodology used by the United Nations is different to that employed by Eurostat.
Figure 1.10 also shows a set of projections (1): by 2050, the median age of the world population is projected to reach 36.2 years. The highest median ages are projected for eastern Asia, peaking at 56.5 years in South Korea and 54.7 years in Japan, while the median age of the population in China (47.6 years) is also projected to rise above that of the EU-28 (46.9 years). By 2050, the only G20 country where the median age is projected to remain below the world average is South Africa (33.9 years).
1
Population developmentsFigure 1.11: Old‑age dependency ratio, 1980‑2050
(%) 0 10 20 30 40 50 60 70 80 1980 1985 1990 1995 2000 2005 2010 2015 2020 2025 2030 2035 2040 2045 2050
Japan EU-28 (1) China United States World India
Note: the old-age dependency ratio is calculated as the number of people aged ≥65 years divided by the number of people aged 15-64 years, expressed as a percentage. 2020-2050: EU-28 population according to the 2018 projections, baseline variant (EUROPOP2018); other population projections according to the United Nations Population Division medium variant. The vertical line marks the divide between official historical data and EUROPOP2018 population projections.
(1) 1980: not available. 1985-2000: EU-28 excluding Croatia. Breaks in series.
Source: Eurostat (online data codes: demo_pjanind and proj_18ndbi) and United Nations, World Population Prospects: the 2019 Revision
The information presented in Figure 1.11 confirms the process of rapid population ageing in eastern Asia. The old-age dependency ratio for Japan will continue to rise at a rapid pace through to 2050, when it is projected to reach 74.3 %. This implies that having had four working-age people for each older person (aged 65 years or more) in 2000, Japan will likely move to a situation
of having approximately 1.5 working-age persons for every older person by 2050. During the next three decades there will also be a considerable shift in the structure of the Chinese population. From having an old-age dependency ratio that was close to the world average in 2015, China is projected to see its ratio rise rapidly such that it will approach the level projected for the EU-28 by 2050.
1
Population developments
Figure 1.12: People aged ≥65 years, by urban‑rural typology, 2018
(%, share of total population living in each type of region = 100)
70 80 90 100 110 120 130 140 150 EU -2 8 Sp ai n N et he rla nd s U ni te d Ki ng do m Fr an ce Sw ed en Po rt ug al D en m ar k G re ec e Fi nl an d Ire la nd Bu lg ar ia Es to ni a G er m an y Ita ly A us tr ia Ro m an ia Li th ua ni a Sl ov en ia ( 1) Cz ec hi a Cr oa tia H un ga ry La tv ia Sl ov ak ia Be lg iu m Po la nd Cy pr us ( 2) Lu xe m bo ur g ( 2) M al ta ( 3) N or w ay Sw itz er la nd Ic el an d ( 4) Li ec ht en st ei n ( 3)
Predominantly rural regions Intermediate regions Predominantly urban regions Note: the indicator is calculated as the share of older people (aged ≥65 years) living in different types of regions
(predominantly urban, intermediate and predominantly rural), divided by the same share for the total population, expressed as a percentage.
(1) Predominantly urban regions: not applicable.
(2) Predominantly urban and predominantly rural regions: not applicable.
(3) Intermediate and predominantly rural regions: not applicable.
(4) Intermediate regions: not applicable.
Source: Eurostat (online data code: urt_pjangrp3)
Older people — where do
they live?
Older people were more inclined to living in rural areas
Rural areas can be places of great natural beauty, which offer a wide range of recreational activities. While such locations might appeal to other older people when they come to consider where to retire, these areas often suffer from a low provision of services. This may be particularly problematic for older people who face a greater risk of reduced mobility, illness or social exclusion. By contrast, urban environments may be advantageous for older people, notably in terms of providing
better access to public transport, as well as a greater variety of housing options, public and commercial services.
In 2018, there were 101 million older people (aged 65 years or more) living in the EU-28. Of these, 42 % were living in predominantly urban regions and 38 % in intermediate regions, leaving 20 % in predominantly rural regions. Figure 1.12 compares the population distribution of older people by
urban-rural typology. It shows that older people in the EU-28 were generally more inclined than their fellow compatriots to live in predominantly rural regions (as shown by indexed values greater than 100 %).
1
Population developmentsThis pattern — a higher than average proportion of older people living in
predominantly rural regions — was repeated in the vast majority of EU Member States; in 2018, the only exceptions were Slovakia, Belgium and Poland (2). By contrast, the share of older people living in predominantly rural regions was high (relative to the share for the rest of the population) in France, the United Kingdom, the Netherlands and particularly Spain. In some cases, the relatively high shares of older people living in rural regions may reflect younger generations leaving sparsely populated regions (for example, in search of job opportunities and/or a better quality of life), while older people continue to live in rural areas.
Older people accounted for a high share of the population in eastern Germany and northern Italy
Subnational breakdowns of demographic statistics can be useful to policymakers, particularly when making preparations for age-related services. Map 1.1 provides information by NUTS level 2 regions and is based on the shares of older people (aged 65 years or more) in the total population. In 2018, there were 14 regions across the EU where older people made up more than one quarter of the total population. These regions were principally located in eastern Germany and northern/central Italy (with only 5 of the 14 regions from other EU Member States): the highest shares were recorded in Chemnitz (eastern Germany; 28.5 %), Liguria (north-western Italy; 28.4 %) and Ipeiros (north-western Greece; 26.6 %).
(2) Note that in the urban-rural typology there are no rural areas defined for Cyprus, Luxembourg or Malta.
There were high concentrations of older people in rural, sparsely populated regions
Figure 1.13 provides more detailed regional figures for NUTS level 3 regions. It underlines the considerable regional variations that exist in some of the EU Member States regarding the share of older people (aged 65 years or more) in the total population. Normally these differences reflect the contrasting situations that prevail between sparsely populated rural regions and urban centres; note that it was common to find the lowest shares of older people in capital city regions. In 2018, older people accounted for more than one third (35.8 %) of the total population in the central Greek region of Evrytania — a relatively mountainous, rural region, which is sparsely populated. The next highest shares were recorded in the Belgian region of Arr. Veurne (31.7 %) that is located close to the English Channel and shares a border with France and the eastern German city of Suhl, Kreisfreie Stadt (31.5 %) which has been characterised by a dramatic fall in population numbers since German reunification. Aside from Evrytania, there were several other relatively sparsely populated, remote regions where older people accounted for at least 30.0 % of the total population: Ourense (north-western Spain; 31.2 %), Creuse (central France; 30.1 %) or Alto Tâmega (northern Portugal; 30.0 %). By contrast, the lowest shares of older people were recorded in two of the outermost regions of France (Mayotte (2.7 %) and Guyane (5.3 %)), and seven regions from the United Kingdom, all but one of which — Manchester (9.3 %) — were part of London: Tower Hamlets (6.2 %), Hackney & Newham (7.4 %), Lambeth (8.1 %), Lewisham & Southwark (8.7 %), Haringey & Islington (9.3 %) and Wandsworth (9.4 %).
1
Population developments
Map 1.1: People aged ≥65 years, by NUTS level 2 regions, 2018
(% share of total population)
Administrative boundaries: © EuroGeographics © UN-FAO © Turkstat
Note: as of 1 January.
People aged ≥65 years, by NUTS level 2 regions, 2018
(% share of total population)
0 200 400 600 800 km Guadeloupe (FR) 0 25 Martinique (FR) 0 20 Guyane (FR) 0 100 Réunion (FR) 0 20 Açores (PT) 0 50 Madeira (PT) 0 20 Canarias (ES) 0 100 Malta 0 10 Liechtenstein 0 5
Cartography: Eurostat — GISCO, 09/2019
Source: Eurostat (online data code: demo_r_pjanind2)
Mayotte (FR) 0 15 EU-28 = 19.7 < 15.0 15.0 - < 19.7 19.7 - < 25.0 ≥ 25.0 Note: as of 1 January.
1
Population developmentsFigure 1.13: NUTS level 3 regions with the highest and lowest shares of people aged ≥65 years, 2018
(% share of total population)
Mayotte (FRY50) Caserta (ITF31) Dytiki Attiki (EL306) Região Autónoma dos Açores (PT200) Helsinki-Uusimaa (FI1B1) Sofia (stolitsa) (BG411) Medimurska zupanija (HR046) Pieriga (LV007) Stockholms län (SE110) Mayotte (FRY50) Vilniaus apskritis (LT011) Põhja-Eesti (EE001) Byen København (DK011) Stredoceský kraj (CZ020) Fuerteventura (ES704) Szabolcs-Szatmár-Bereg (HU323) Flevoland (NL230) Malta (MT001) Bruxelles Cap./Brussel-Hoofdstad (BE100)
-Tiroler Oberland (AT334) Tower Hamlets (UKI42) Ilfov (RO322) Gdanski (PL634) Presovský kraj (SK041) Mid-East (IE062) Höfudborgarsvædi (IS001) Oslo (NO011) Freiburg (CH022) Evrytania (EL643) Savona (ITC32) Evrytania (EL643) Alto Tâmega (PT11B) Etelä-Savo (FI1D1) Suhl, Kreisfreie Stadt (DEG04) Vidin (BG311) Sibensko-kninska zupanija (HR034) Latgale (LV005) Gotlands län (SE214) Creuse (FRI22) Utenos apskritis (LT029) Kirde-Eesti (EE007) Goriska (SI043) Bornholm (DK014) Královéhradecký kraj (CZ052) Ourense (ES113) Békés (HU332) Zeeuwsch-Vlaanderen (NL341) Gozo & Comino (MT002) Arr. Veurne (BE258) Östliche Obersteiermark (AT223) Dorset CC (UKK22) Teleorman (RO317) Miasto Lódz (PL711) Trenciansky kraj (SK022) Border (IE041); West (IE042) Ticino (CH070) Hedmark (NO021) Landsbyggd (IS002) 0 10 20 30 40 EU-28 Italy Greece Portugal Finland Germany Bulgaria Croatia Latvia Sweden France Lithuania Estonia Slovenia Denmark Czechia Spain Hungary Netherlands Malta Belgium Austria United Kingdom Romania Poland Cyprus (1) Slovakia Luxembourg (1) Ireland Switzerland Liechtenstein (1) Norway Iceland
Region with the
lowest share Region withthe highest share
Frankfurt am Main (DE712); Freising (DE21B)
Jugovzhodna Slovenija (SI037);Osrednjeslovenska (SI041)
Note: the figure has a bar for each country that shows the range from the region with the lowest share to the region with the highest share; the vertical line inside each bar denotes the national average (mean). As of 1 January.
(1) No regional breakdown for level 3 regions.
Source: Eurostat (online data code: demo_r_pjanind3)
Older people — where do
they come from?
While declining fertility and increasing longevity are the key drivers of population ageing in the EU, international migration can also play a role. Indeed, migration usually slows down the ageing process, as a majority of immigrants tend to be relatively young (often searching for work opportunities and the chance of a better quality of life).
A relatively small proportion of older people are foreign citizens
Figure 1.14 presents information on the prominence of foreign citizens. In 2018, foreign citizens of another EU Member State accounted for 3.4 % of the EU-28 population, a share that fell to 1.7 % among older people (aged 65 years or more). This pattern was repeated in the vast majority of Member States, as only France and Croatia reported
1
Population developments
Figure 1.14: Citizenship, by age class, 2018
(% share of age class)
EU -2 8 ( 1) Lu xe m bo ur g Cy pr us A us tr ia Es to ni a M al ta La tv ia Ire la nd Be lg iu m G er m an y Sp ai n U ni te d Ki ng do m D en m ar k Sw ed en Ita ly G re ec e Fr an ce ( 1) Sl ov en ia N et he rla nd s Cz ec hi a Fi nl an d Po rt ug al H un ga ry Sl ov ak ia Cr oa tia Bu lg ar ia Li th ua ni a Po la nd ( 1) Ro m an ia 0 5 10 15 20 25 30 35 40 45 50
Total population: citizens of a non-member country People aged ≥65 years: citizens of a non-member country Total population: citizens of another EU Member State People aged ≥65 years: citizens of another EU Member State (1) Provisional.
Source: Eurostat (online data code: migr_pop1ctz)
higher shares for older citizens of other Member States; this would tend to suggest that both France and Croatia were popular retirement destinations for citizens of other Member States.
Similarly, citizens of non-EU member countries accounted for 4.4 % of the EU-28 population, while their share of the older population was much lower, at 1.5 %. Again there were two exceptions to this pattern, Estonia and Latvia, where higher shares of older people (than the total population) were citizens of a non-member country. This may be linked to a high number of older people in Estonia and Latvia being classified as recognised non-citizens; they were mainly former Soviet Union citizens, who are
permanently resident but have not acquired any other citizenship.
To conclude, across the EU it was relatively common to find the share of foreign citizens in the total population falling as a function of age, both for citizens of another EU Member State and citizens of a non-member country. This would tend to suggest that migratory flows have increased in recent years, or that some foreign citizens choose to leave their host economy once they have grown old (and finished their working lives). For example, in Luxembourg, foreign citizens made up almost half (47.8 %) of the total population in 2018, while their share among older people was considerably lower (at 28.4 %).
2
Housing and
2
Housing and living conditionsHousehold composition
among older people
Recent decades have been characterised by a fall in the average size of households, reflecting — at least in part — lower fertility
rates, a higher number of divorces and the dissolution of extended households. A growing number (and share) of older people in the European Union (EU) are living alone (particularly older women): they form a particularly vulnerable group in society, with an increased risk of poverty or social exclusion.
Older women were more likely to be living alone …
Figure 2.1 shows there are considerable differences between the sexes in relation to the composition of private households (1). In 2017, almost three fifths (58.5 %) of all men aged 65 years or more living in the EU-28 shared their household with a partner
(1) These figures exclude people living in institutional households (for example, retirement or
nursing homes).
(2) It is important to note that the difference between these shares was further compounded,
insofar as the total number of older women was much higher than the total number of older men (as shown in Chapter 1).
(but no other persons in the household); the corresponding share for women of the same age was much lower, at 39.6 %. In Cyprus and the Netherlands, approximately three quarters of all older men were living in households as part of a couple, while this share was less than half in Spain, Malta, Bulgaria, Romania, Poland and Slovakia — where a relatively high proportion of older men were living in other types of household, for example, with other family members, friends or other persons.
Older women (aged 65 years or more) were much more likely to be living alone: in 2017, the share of older women living in households composed of a single person was 40.4 % across the EU-28, while the share for older men was 22.4 % (2). More than half of all older women in Denmark, Lithuania and Estonia were living alone, while the lowest shares of older women living alone were recorded in Cyprus (27.0 %), Luxembourg (29.4 %) and Spain (29.9 %).
2
Housing and living conditions
Figure 2.1: Distribution by type of household of people aged ≥65 years, by sex, 2017
(% share of older men/older women living in private households)
0 10 20 30 40 50 60 70 80 EU -2 8 D en m ar k Li th ua ni a Es to ni a Sw ed en Fi nl an d H un ga ry La tv ia Fr an ce Bu lg ar ia G er m an y Ro m an ia U ni te d Ki ng do m Sl ov en ia A us tr ia Be lg iu m Ire la nd Cz ec hi a N et he rla nd s Sl ov ak ia M al ta Cr oa tia Ita ly Po la nd G re ec e Sp ai n Po rt ug al Lu xe m bo ur g Cy pr us N or w ay Sw itz er la nd Ic el an d ( 1)
Men aged ≥65 years living in a couple without other persons Men aged ≥65 years living alone
Men aged ≥65 years living in other types of household Men 0 10 20 30 40 50 60 70 80 EU -2 8 D en m ar k Li th ua ni a Es to ni a Sw ed en Fi nl an d H un ga ry La tv ia Fr an ce Bu lg ar ia G er m an y Ro m an ia U ni te d Ki ng do m Sl ov en ia A us tr ia Be lg iu m Ire la nd Cz ec hi a N et he rla nd s Sl ov ak ia M al ta Cr oa tia Ita ly Po la nd G re ec e Sp ai n Po rt ug al Lu xe m bo ur g Cy pr us N or w ay Sw itz er la nd Ic el an d ( 1)
Women aged ≥65 years living in a couple without other persons Women aged ≥65 years living alone
Women aged ≥65 years living in other types of household Women
Note: ranked on the average share of older people (both sexes) aged ≥65 years living alone. (1) 2016.
2
Housing and living conditionsFigure 2.2: People aged ≥65 years living in an institutional household, by sex, 2011
(% share of older men/women)
0.0 2.5 5.0 7.5 10.0 12.5 EU -2 8 ( 1) Lu xe m bo ur g M al ta Fr an ce Be lg iu m N et he rla nd s Sl ov en ia A us tr ia Po rt ug al U ni te d Ki ng do m Sw ed en H un ga ry G er m an y Cz ec hi a Cr oa tia Sl ov ak ia Es to ni a D en m ar k Sp ai n Cy pr us La tv ia Ita ly Li th ua ni a G re ec e Po la nd Bu lg ar ia Ro m an ia Ic el an d Li ec ht en st ei n N or w ay
Men aged ≥65 years Women aged ≥65 years Note: ranked on the average share for all older people (both sexes) aged ≥65 years. Ireland and Finland: not available.
(1) Excluding Ireland and Finland.
Source: Census hub (https://ec.europa.eu/CensusHub2)
… they were also more likely to be living in institutional households
The overwhelming majority of older people continue to live in private households (either alone, with their spouse or with other persons). Nevertheless, some older people move into institutional households, such as retirement or nursing homes; this may occur out of choice (for example, not wishing to live alone) or because it is no longer possible for older people to carry on living at home (for example, due to complex long-term care needs). The very old are more likely to be frail and therefore to need services such as those provided within institutional households. While most healthcare costs in the EU are covered by social protection systems, long-term social care is usually treated in a different manner; indeed, it is rare that such services are covered to the same extent as
healthcare. This means that the responsibility for financing institutional care often resides with the older person needing such care (or with their family).
In 2011, 3.8 % of older women (aged 65 years or more) in the EU-28 were living in an institutional household (see Figure 2.2). This was twice as high as the corresponding share recorded for older men (1.9 %), reflecting at least in part, the longevity of women. This difference between the sexes was repeated in all but one of the EU Member States, the exception being Latvia (where the share of older men living in institutional households was marginally higher). At the other end of the range, in France and Belgium, around 7 % of older women were living in institutional households, a share that reached 9.2 % in Malta and peaked at 10.2 % in Luxembourg (and was even higher in Iceland; 10.9 %).
2
Housing and living conditions
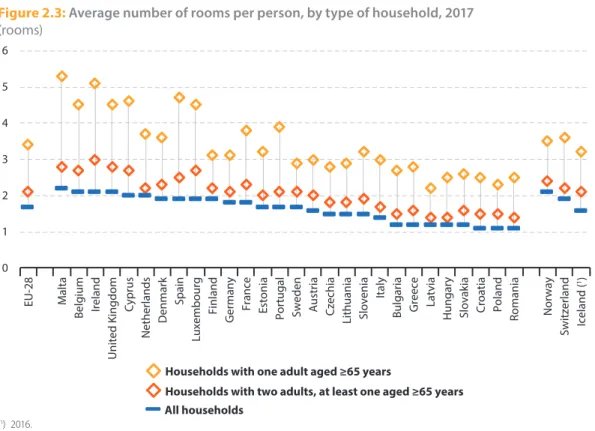
Figure 2.3: Average number of rooms per person, by type of household, 2017
(rooms) 0 1 2 3 4 5 6 EU -2 8 M al ta Be lg iu m Ire la nd U ni te d Ki ng do m Cy pr us N et he rla nd s D en m ar k Sp ai n Lu xe m bo ur g Fi nl an d G er m an y Fr an ce Es to ni a Po rt ug al Sw ed en A us tr ia Cz ec hi a Li th ua ni a Sl ov en ia Ita ly Bu lg ar ia G re ec e La tv ia H un ga ry Sl ov ak ia Cr oa tia Po la nd Ro m an ia N or w ay Sw itz er la nd Ic el an d ( 1)
Households with one adult aged ≥65 years
Households with two adults, at least one aged ≥65 years All households
(1) 2016.
Source: Eurostat (online data code: ilc_lvho04)
Older people living in under‑
occupied dwellings
Contrary to the problem of over-crowding, which tends to affect younger people and those living in some of Europe’s principal cities, older people are more likely to be living in under-occupied dwellings (3). In 2017, households in the EU-28 had an average of 1.7 rooms (4) per person (see Figure 2.3). Older people had more space in their dwellings: on average, 2.1 rooms per person for households composed of two adults (at least one of which was aged 65 years or more), rising to 3.4 rooms for households composed of a single person aged 65 years or more. The most common cause of under-occupation is because older
(3) An under-occupied dwelling is one that is deemed to be too large for the needs of the
household living in it, in terms of excess rooms (and more specifically bedrooms); for more information refer to the note under Figure 2.4.
(4) A room is defined as a space of a housing unit of at least four square meters such as normal
bedrooms, dining rooms, living rooms and habitable cellars, attics, kitchens and other separated spaces used or intended for dwelling purposes with height of more than two metres and accessible from inside the housing unit.
individuals or couples continue to live in their property long after their children have left the family home, despite it being, for example, too large, difficult to heat, or ill-adapted. The average number of rooms for households composed of a single person aged 65 years or more was particularly high in Belgium, Luxembourg, the United Kingdom, Cyprus and Spain (4.5-4.7 rooms in 2017), rising to 5.1 rooms in Ireland and peaking at 5.3 rooms in Malta; all seven of these EU Member States also recorded a relatively high average number of rooms per person for all households. By contrast, the average number of rooms was relatively low for all households and for households composed of older people across most of the eastern EU Member States.
2
Housing and living conditionsFigure 2.4: People living in under‑occupied dwellings, by age class, 2017
(%) 0 10 20 30 40 50 60 70 80 90 100 EU -2 8 M al ta Ire la nd Cy pr us Be lg iu m U ni te d Ki ng do m Sp ai n Lu xe m bo ur g N et he rla nd s Fi nl an d ( 1) Fr an ce D en m ar k Sw ed en Po rt ug al G er m an y A us tr ia Es to ni a Sl ov en ia Cz ec hi a Li th ua ni a Po la nd Ita ly Sl ov ak ia Cr oa tia La tv ia Bu lg ar ia H un ga ry G re ec e Ro m an ia N or w ay Sw itz er la nd Ic el an d ( 1) 18-64 years ≥65 years
Note: a dwelling is defined as under-occupied if the household living in it has at its disposal more than the minimum number of rooms considered adequate, which is equal to: one room for the household; one room per couple in the household; one room for each single person aged 18 or more; one room per pair of single people of the same gender between 12 and 17 years of age; one room for each single person between 12 and 17 years of age and not included in the previous category; one room per pair of children under 12 years of age.
(1) 2016.
Source: Eurostat (online data code: ilc_lvho50a)
Approximately half of all older people were living in under-occupied dwellings
In 2017, the share of working-age adults (18-64 years) living in under-occupied dwellings across the EU-28 was just over one third (34.2 %). By contrast, the proportion of older people (aged 65 years or more) living in under-occupied dwellings was slightly higher than half (50.6 %). This pattern — a higher share of older people than working-age adults living in under-occupied dwellings — was observed in all of the EU Member States. The share of older people
living in under-occupied dwellings peaked at 90.5 % in Ireland, and was more than 80 % in Malta, Cyprus, the United Kingdom and Belgium. By contrast, in Bulgaria, Poland, Croatia, Latvia, Hungary and Romania less than 20 % of older people were living in under-occupied dwellings; the lowest share was recorded in Romania (11.2 %). This wide disparity between Member States may reflect, among others, whether older people were living predominantly: in houses or flats/ apartments; in urban or rural areas; on their own or with their (extended) family.