Science Arts & Métiers (SAM)
is an open access repository that collects the work of Arts et Métiers Institute of
Technology researchers and makes it freely available over the web where possible.
This is an author-deposited version published in:
https://sam.ensam.eu
Handle ID: .
http://hdl.handle.net/10985/9809
To cite this version :
G LE MOAL, George MORARU, Philippe VERON, M DOUILLY, Patrice RABATE - Multisensor
data fusion and belief functions for robust singularity detection in signals - In: Proceedings of the
14th International Conference on Information Fusion - FUSION, Etats-Unis, 2011 - Proceedings of
the 14th International Conference on Information Fusion - FUSION - 2011
Any correspondence concerning this service should be sent to the repository
Administrator :
[email protected]
Multisensor Data Fusion and Belief Functions for Robust
Singularity Detection in Signals
Gwénolé Le Moal, George Moraru,
Philippe Véron
LSIS - INSM, Arts et Métiers ParisTech
Aix-en-Provence, France.
[email protected]
[email protected]
[email protected]
Marc Douilly, Patrice Rabaté
EADS Innovation Works
Méaulte, France.
[email protected]
patrice.rabaté@eads.net
Abstract - This paper addresses the problem of robustdetection of signal singularity in hostile environments using multisensor data fusion. Measurement uncertainty is usually treated in a probabilistic way, assuming lack of knowledge is totally due to random effects. However, this approach fails when other effects, such as sensor failure, are involved. In order to improve the robustness of singularity detection, an evidence theory based approach is proposed for both modeling (data alignment) and merging (data fusion) information coming from multiple redundant sensors. Whereas the fusion step is done classically, the proposed method for data alignment has been designed to improve singularity detection performances in multisensor cases. Several case studies have been designed to suit real life situations. Results provided by both probabilistic and evidential approaches are compared. Evidential methods show better behavior facing sensors dysfunction and the proposed method takes fully advantage of component redundancy.
Keywords: Singularity Detection, Multisensor Data
Fusion, Evidence Theory, Belief Functions.
1 Introduction
Singularity detection in signals is of major importance in many fields of application. This is especially true in monitoring applications. Such applications can take place in environments that are hostile to data acquisition and processing by downgrading the quality of signals coming from sensors, making measurements uncertain. This uncertainty has to be taken into account when processing the signal data in order to make coherent decisions about the singularity detection.
Considering measurements, uncertainty is defined as a parameter associated with the result of a measurement that characterizes the dispersion of the values that could reasonably be attributed to the measurand [1]. This parameter is defined as the standard deviation of a probability density function which describes this dispersion. This definition of the uncertainty associated with a measurement assumes that the result of the measurement has been corrected for all recognized significant systematic effects [1]. In other words, only
random effects are taken into account. Modeling random effects is straightforward in probability theory, hence this theory is used to describe and manipulate measurements affected by random effects, also called noise. However, it has been pointed out that in the measurement practice, the “random effect only” assumption might not be acceptable: significant systematic effects cannot always be corrected [2], and there are even situations where it would be wrong to make corrections, for instance when sensor failure occurs. Some sensible applications like high value-added manufacturing processes or power plant monitoring, for example, need robust and automatic singularity detection systems that are able to reach good performance levels even in critical cases which involve sensor dysfunction or lack of detection ability.
The need for robustness against sensor failures in singularity detection leads to two solutions: increasing the number of sensors, and working in another framework than the classical probabilistic one, which shows better behavior facing unexpected sensor behavior. Multisensor data fusion, which seeks to combine data from multiple sensors to perform inferences that may not be possible from a single sensor alone [3], seems to be the ideal solution facing this type of situation. Indeed, one potential advantage of using data fusion is related to the capacity for a system to work in a degenerated mode [5]. However, any process of fusion requires a conversion of the sensor raw or processed data into a common coordinate frame before being merged. This step is called data alignment and is considered a difficult problem for which a general theory does not exist [4].
The present work aims to provide a method for modeling uncertain sensor measurements which has been designed to improve the performance of singularity detection in cases when two or more redundant sensors are used. A comparative study allows to compare the method with existing ones. The proposed method is designed in the evidence theory framework and uses belief functions to model sensor measurements instead of probability density functions, which are used in the probabilistic framework.
A description of the problem of singularity detection in signals and some concepts about evidence theory is first presented. Then the probabilistic approach, an existing evidential method, and the proposed method for data alignment and fusion are detailed. Finally, as numerical
14th International Conference on Information Fusion
Chicago, Illinois, USA, July 5-8, 2011
experiments have been conducted considering several cases, results are presented and discussed to provide an overview of the performance levels of the different approaches, and improvements are suggested.
1.1 Monitoring singularities in signals in
hostile environments
This paper is limited to monitoring applications using sensor data, but may be extended to other applications. Monitoring a system via sensors means looking for one or more features of interest in the acquired signals. Such a feature of interest has to be singular in a way, in order to be differentiated from the rest of the signal and detected. Without loss of generality, we assume the singularity is represented as a maximum in a signal. Indeed, a number of tools, like filters or statistical operations, may be used to process the signals to reveal the feature of interest. The problem addressed here is to determine the location of a singularity (that is supposed to exist) in a signal after the eventual conversion step mentioned above has been done. The singularity is to be localized on the signal abscissa, which is usually the time axis, but not always.
Sensor-based monitoring can be problematic, especially in hostile environments where measurements are tainted with uncertainty. It is assumed that the sensors do not have self-diagnostic features and that all significant systematic effects have been catered for. The measurement uncertainty can hence take two forms: stochastic uncertainty, due to external perturbations, and epistemic uncertainty, or lack of knowledge, due to sensor failure or lack of detection ability. When no a priori information is available about the monitored system, redundancy appears as the natural solution to avoid issues due to sensor failure, but could also increase accuracy of results by reducing the stochastic uncertainty. Voting techniques work quite well to detect sensor failure and eliminate faulty instruments in systems that possess a high degree of sensor redundancy [6]. However, they often lead to erroneous statements as the number of faulty sensors becomes large, or when random effects are so important that every sensor’s output differs markedly from others. Thus, in situations where sensor failures are likely to occur, and a high level of external perturbations are expected, a method taking into account both stochastic and epistemic uncertainty is needed to perform singularity detection.
1.2 Concepts on evidence theory
Evidence theory has been shown to be a practical framework to model both stochastic and epistemic uncertainty. In this paper, belief functions as defined in the transferable belief model [9] are used to model sensor measurements. Some concepts are presented following [7,8,9] to remind the reader about some main terms and formulas that are used in the main part of the paper. A frame of discernment Ω is a finite set of mutually exclusive propositions. In our case, the propositions are the possible localization of the maximum in the signal and are called candidates. 2Ω is the set containing all subsets of Ω and is called the power set. Considering a single
information source j, the basic belief assignment function
mjis used to allocate parts of an initial unitary amount of belief among the proposition of 2Ω. Thus, considering a proposition A, mj(A) is a part of the jth source’s belief that supports A and is called a basic belief mass. Every A such that mj(A) > 0 is called a focal proposition. Let mj : 2Ω → [0,1] with
0
)
0
(
,
1
)
(
2=
/
=
∑
Ω ∈ j A jA
m
m
(1)The difference with probability model is that masses can be given to any proposition of 2Ω instead of only singletons of 2Ω. From the basic beliefs assignment, other functions are defined that give meaningful quantities. The belief function Belj gives the quantity Belj(A) which can be viewed as a measure of the jth source’s belief in the
proposition A.
∑
⊆=
A BB
m
A
Bel
j(
)
j(
)
(2)The plausibility Plj(A) can be interpreted as a measure of the amount of belief that could be potentially accorded to
A and is given by the plausibility function.
∑
/ ≠ ∩=
0)
(
)
(
B AB
m
A
Pl
j j (3)The pignistic probability function BetP allows constructing a probability distribution on 2Ω from the sources beliefs, which is useful when decisions on singletons of Ω have to be made.
∑
⊆ 〈 〉=
B A j B B m jA
BetP
(
)
( ) (4)where ‹B› denotes the cardinality of set B. The commonality measure Qj(A) can be interpreted as the belief that is free to move to A. According to (5), (2) and (3) one can observe that the commonality of a proposition will increase as its belief and plausibility will decrease. Thus the commonality function is commonly used to build an ordering concerning the specificity of different belief functions [12].
∑
⊇=
A BB
m
A
Q
j(
)
j(
)
(5)All these representations are equivalent in the sense that one can be derived from any other.
Evidence theory also allow to aggregate information coming from multiple sources by providing combination rules. Dempster’s rule of combination is the first one defined within the framework of evidence theory and plays a central role. This rule should be applied under the following conditions: propositions of the frame of discernment have to be mutually exclusive, exhaustive (closed world assumption), and the information sources
have to be independent. In the singularity detection problem the first two issues are addressed by considering the maximum of the original signal Y is unique. The third one requires the sensors measurements to be independent, which depends on the application design. Let m+ denote the belief function resulting from the aggregation of information provided by J sensors.
Ω ∩ +
=
1
−
(
0
/
)
,
∀
⊆
2
)
(
)
(
A
m
A
m
A
m
(6)where m∩ denotes the conjunctive rule of combination defined as Ω = ∩ ∩ ∈ = ∩
=
∑ ∏
∀
⊆
Ω2
,
)
(
)
(
1 1, , 2 1A
B
m
A
m
A B B B B J i i i J J … … (7)and where m(Ø) is the mass assigned to the empty set and given by
∑ ∏
/ = ∩ ∩ ∈ = Ω=
/
0 2 , , 1 1 1)
(
)
0
(
J J B B B B J i i iB
m
m
… … (8)m(Ø) can be interpreted as a measure of conflict between the different information sources.
2 Modeling and merging sensor
measurements
A sensor measurement is described by a discrete signal
Sj obtained by adding the original signal Y and a random noise Bj defined by a probability density function pBj with support θBj.
[
N
]
n
n
B
n
Y
n
S
j(
)
=
(
)
+
j(
)
,
∈
1
,
…
,
(9) where N is the signals length and j the sensor identifier.In the following, uncertainty concerning the maximum of a signal is described as a function of two variables: di,k the distance between the ith and the kth value of the
measured signal,
)
(
)
(
,
)
(
)
(
,S
i
S
k
S
i
S
k
d
ik=
−
≥
(10)and the comparison between the signal and noise levels expressed in term of the spurious free dynamic range (SFDR) between the normalized signal standard deviation and the noise standard deviation. The signal points are supposed to follow a uniform distribution in [-1,1], and the noise is centered at 0.
))
(
log
)
3
1
(
(log
20
noiseSFDR
=
−
σ
(11)The problem addressed in this paper is illustrated in figure 1. One wants to find the index n of the maximum of the unknown original signal Y given J sensor measurements Sj tainted with uncertainty. The uncertainty can be due to the presence of noise, represented in the figure by error bars corresponding to the θBj supports of uniform pBj distributions, but also to sensor failure as it is the case for the third sensor.
Figure 1 – Illustration of the singularity detection problem presented in the paper.
2.1 The probabilistic approach
When no prior information is available, given a measurement Sj and the associated noise probability density function pBj, one can derive the probability Pj(i) of the ith point of the original signal to be the maximum
according to the jth sensor. In the following, k is defined as
[
N
]
k
i
k
∈
1 …
,
,
,
≠
)
),
(
,
)
(
(
)
(
i
P
Y
i
…
Y
k
…
P
j=
j>
(12)∫ ∫ ∫
∏
+∞ ∞ − −∞ −∞=
) ( ())
(
)
(
i Y Yi k i k j ji
p
Y
dy
dy
P
(13)where pj (Y) is the joint probability distribution function of the Y signal values which can be derived from Sj and pBj.
Considering J independent sensors, the a posteriori aggregated probability P(i) of the ith point being the
maximum is given following the independent opinion pool approach [10] by
∑ ∏
∏
= = ==
N i J j j J j ji
P
i
P
i
P
1 1 1)
(
)
(
)
(
(14)Then, the decision concerning location of the singularity in Y is made choosing the maximum a posteriori
probability according to the maximum a posteriori decision rule.
2.2 The evidential approaches
Evidence theory provides sophisticated tools to model and manipulate degrees of belief, but one of the main difficulties lies in modeling the knowledge of the problem by initializing the belief functions mj as well as possible [11]. On the other hand, the absence of a procedure to convert the information into basic belief masses allows one to adapt the data alignment step to his requirements. In the presented method, a strong probabilistic background is held according to the fact that random noise is one of the principal uncertainty vectors in hostile environments measurements, but advantage will also be taken of sensor redundancy. The underlying idea is to assign high masses to total ignorance when sensors seem to give uncertain information so that during the combination of sensors measurement, the most specific sensors measurements will be taken into account.
In the following the j subscript denoting the sensor index is omitted for sake of readability as belief function construction concerns each sensor separately.
2.2.1 Existing evidential approach
Several approaches allow deriving belief functions from discrete probabilities obtained using a probabilistic approach like, for instance, the one described in section 2.1. Classically, the least commitment principle is used when no meta-knowledge concerning the reliability of the information sources is available to build belief function from those probabilities. An inverse pignistic transformation is first used to generate the set of isopignistic belief functions Biso(BetP) that would lead to
the original probability distribution through (4) [9]. Then a belief function is chosen in Biso(BetP) according to the
least commitment principle: among a set belief functions, when there is no reason to prefer one to another, the least specific (or least informative) one is chosen. The specificity of a belief function can be evaluated using the commonality function (5). A belief function constructed this way is consonant. A consonant belief function is a belief function which focal elements are nested. More explanations and an algorithm to derive the least committed basic belief distribution can be found in [12].
In order to better feel how uncertainty is allocated, (10), (11), (13) and (14) can be used to derive discrete probabilities as a function of di,k and SFDR. Then, the above mentioned algorithm can be used to derive the corresponding belief functions. In order to obtain readable results, a case when only two points S(1) and S(2) are candidates to be the maximum is considered, so the ignorance is fully contained in m(Ω) = m({1,2}). A Gaussian noise is considered as it is a typical real life noise shape. Computing the amount of ignorance derived from P(1) and P(2) leads to Figure 2.
Figure 2 - Mass allocated to the total ignorance in function of d1,2 and SFDR for two candidates according to the
existing evidential approach.
As expected, total ignorance is reached when d1,2 = 0, and the uncertainty level decreases as the SFDR1,2 and d1,2 increases. It can be noted that the total ignorance state is achieved only for d1,2 = 0. This approach to build belief functions has been implemented and obtained results are compared to the probabilistic and the proposed evidential approaches results in section 3.
2.2.2 The proposed evidential approach
In the proposed approach, belief functions are not derived from the discrete probability distribution defined by (13). However, as an important aspect of the provided information, probability distributions p(Y(n)|S(n)), describing random effects on each point of S(n), which is straightforward to derive from (9) knowing pB, play an important role in the belief function construction. The supports θn of the p(Y(n)|S(n))’s are also of great importance, and are considered to present the same width for every n as real life situations will usually present the same noise perturbations for each point Sj(n) given by a sensor. As in the existing approach, the constructed belief function is consonant. The consonant belief function construction procedure is first presented for two candidates, and then be generalized to N. The two candidates are S(1) and S(2), with S(1) > S(2). This ordering gives the ordering of the consonant belief function, as it is the case in the least commitment principle method. The basic belief assignment are given following
dY
S
Y
p
m
Sup Sup(
(
1
)
(
1
))
)
1
(
( ) ) ( 1 2∫
=
θθ (15)}
{
p
Y
S
dY
m
Sup Inf(
(
1
)
(
1
))
)
2
,
1
(
( ) ) ( 2 1∫
=
θθ (16)As we integrate a density probability function over its whole support, (1) is respected. This mass allocation
procedure can be interpreted as “if there is a chance that
Y(2) is the maximum, then we assume that we do not
know which of Y(1) or Y(2) is the maximum. Else, Y(1) is the maximum, so the probability of Y(1) to be greater than the higher possible value of Y(2) is allocated to m(1) ”. We now consider N candidates ordered in a vector u such as
S(u(n-1)) > S(u(n)) for every n in [2,…,N]. In the
following, u(k) is denoted uk for sake of readability. We have for the general case
}
{
u
u
p
Y
u
S
u
dY
m
un n u Sup Sup n)
(
(
)
(
))
,
,
(
1 ) ( ) ( 1 1 1∫
+=
θθ…
(17)The particular case m(u(1),…,u(N)) = m(Ω) is derived from (18).
dY
u
S
u
Y
p
m
uN u Sup Inf(
(
)
(
))
)
(
( ) 1 ) ( 1 1∫
=
Ω
θθ (18)In the case that the θn supports are not bounded, the method will lead to the creation of a vacuous belief function, which is a belief function such m(Ω) = 1. Having only this kind of belief functions cannot lead to a choice, which is a drawback in a decision making context. We then propose to limit unbounded probability density functions supports by defining new θn so that the probability Pconf of a random value drawn from
p(Y(n)|S(n)) to lie in θn is high even if it does not exactly equals 1. Then, the eventual little amount of mass which has not been allocated is allocated to m(Ω). The confidence interval θn and the associated probability Pconf are user-defined parameters of the method. For instance, illustrative example and numerical experiments presented below have been implemented using Gaussian probability density functions to represent noise, and the θn have been defined as [µn-5σn , µn+5σn] where µn and σn are the mean and the standard deviation of the Gaussian probability density function, respectively. In this case Pconf is considered equal to 1.
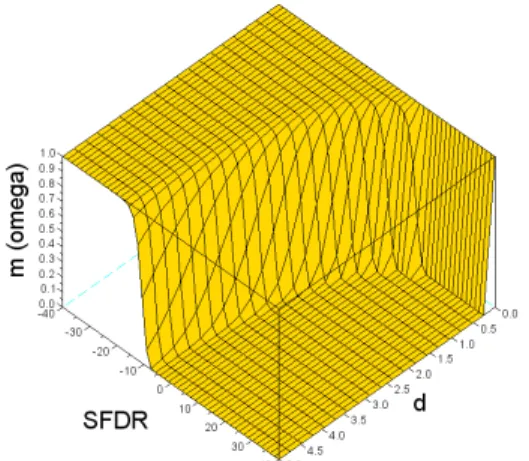
As the underlying idea is to confer more credit to most specific sensors (sensors presenting low SDFR levels and high du(1),u(2) levels) to take advantage of redundancy, least specific sensors should be much discarded during the combination step than they are using existing methods. Thus, the basic belief assignment should be less specific regarding the uncertainty level characterized by du(k),u(k+1) and SFDR. Figure 2 shows that in the same conditions of distance and noise than in figure 1, total ignorance state is not only achieved when du(1),u(2)=0, but also as SFDR decreases. The most specific sensors will thus be favorized during the combination step in two ways. First, it can be observed that uncertainty starts increasing sooner that in figure 1 according to the SFDR level. Second, the sharper behavior observed in figure 3 will lead to a quicker discarding of less specific sources during the combination step.
Figure 3 - Mass allocated to the total ignorance as a function of d1,2 and SFDR for two candidates according to
the proposed evidential approach.
2.2.3 Decision making using the evidential
approaches
As the evidential framework offers several ways to represent knowledge about propositions (see section 1.2), several strategies that lead to decision on propositions of
2Ω can be implemented. When decisions have to be made
only on propositions of Ω, as it is the case in this study, three rules are generally considered to make a choice among them: the maximum belief, the maximum plausibility and the maximum pignistic probability rules. The three strategies were implemented and results are compared and discussed in section 3.
2.3 Complexity considerations
When compared with probability theory, evidence theory faces higher computational complexity due to the higher number of possible focal elements (2|Ω| instead of |Ω|, where |Ω| represents the cardinality of Ω) and the Dempster’s combination rule requirements. Several approximation algorithms have been suggested to overcome this difficulty. A review of such algorithms can be found in [13]. As the belief functions presented in this work are consonant, their number of focal elements does not exceed |Ω|. Unfortunately, consonance is not preserved by Dempster’s rule of combination and no significant computational performances improvement can be achieved due to this property [14].
Focusing on the scope of this work, depending on the N-dimensional probability density function given by (12) and the number N of candidates, the calculation of the discrete probability distribution on [1,…,N] using (14) can be difficult and/or time consuming, and is needed for both the probabilistic and the existing evidential approaches. Using the proposed approach allows to bypass the discrete probabilities calculation (13) and does not involve anything else than the calculation of only one-dimensional integrals of monovariate probability density functions given by (17) and (18).
3 Numerical experiments results
In order to give an overview of the proposed approach ability to improve performance of the singularity detection in real-life situations, a series of tests was conducted to reproduce hostile environments measurements issues and evaluate the performances of the three different methods presented in section 2.
Three sensor states have been considered. The normal operating state corresponds to a classical sensor behavior where a measurement is given with an associated noise level characterized by the SFDR value. In the weak failure state, a sensor only provides noise which can be quantified according to (11), whereas in the strong failure case, a wrong measurement is given and is perturbed by noise.
3.1 Numerical experiments set-up
The test series have been conducted considering 3 sensors, each one providing a 3 points long measurement. The original signals Y have been drawn from [-1,1] following a uniform distribution. For one original signal,
2500 random noise realisations were generated for each
sensor and for each considered SFDR level. The error detection rate concerning the localization of the maximum among the three points was then computed and expressed as a detection error percentage. The 95% confidence interval on the detection error rates lies between +/- 0% and +/- 2% depending on the detection error rate. A Gaussian noise distribution has been considered, and the
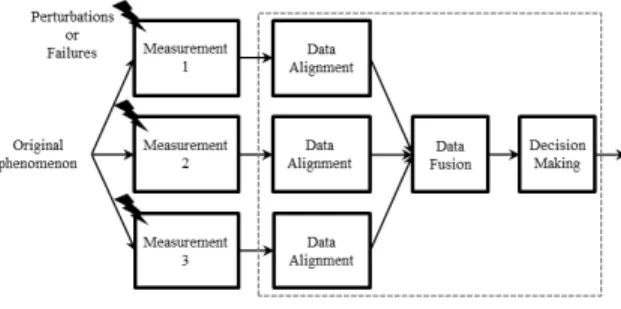
θn supports have been defined as [S(n)-5σn , S(n)+5σn] to perform the (16) and (18) calculations. The general scheme followed to conduct the test series is drawn in figure 4.
Figure 4 - General scheme followed to conduct test series. For the sake of readability of figures, results obtained by the same data alignment method but different decision rules that do not present significant differences are drawn together.
3.2 Results and discussions
Significant cases are first exposed to serve as a basis to draw more general conclusions concerning the different approaches performance level.
The first case addressed concerns a normal operating state for the 3 sensors. It aims at evaluating performances of the evidential methods in a case where only random
effects occur and thus the probabilistic approach is optimal. Figure 5 shows that the asymptotic behaviors are the same for all the approaches: no error is made for high
SFDR levels, and when it is so low that the original signal Y influence is not significant in the measurements Sj anymore, the error rate reaches 66.6% as the chance to detect the maximum with no significant knowledge available is 1 out of 3. As expected, the lowest error rates are obtained by using the probabilistic approach as it is optimal in such a case. However the evidential approaches, and especially the inverse pignistic transformation based method, as it derives directly masses from probabilities, achieves very good performance level.
The decision rules do not have great influence except the maximum belief one, which when applied with the proposed approach present slightly higher error rates. This can be explained by the sharper behaviors of both the proposed data alignment method and the maximum belief decision rule: lower consensus is made between the sensors during the combination step as detailed in section 2.2.2, and according to (2), mass allocated to partial ignorance after combination is not taken into account while calculating the belief, so not all available evidence is taken into account when making decision.
Figure 5 - Evolution of the detection error rate according to the SFDR1,2,3 levels in normal operating mode. The second case study simulates a situation where one sensor’s SFDR level is different from the two others:
SFDR1 equals -5 dB, which allow quite good detection rate according to the original signal. Two situations can then occur: SFDR1 ≤ SFDR2,3 and SFDR1 > SFDR2,3. The proposed evidential method has been designed to address the second situation when one sensor provides more specific information than others. The simulation results are shown in figure 6. Evidential approaches show lower error rates, especially the proposed method used with the maximum belief decision rule. This can be explained, once again, by their respective sharper behaviors. Indeed, more credit is accorded to the most specific sensor 1 during the combination step and uncertainty brought by sensors 2 and 3 as their SFDR level decrease is less taken into account during decision making.
Figure 6 - Evolution of the detection error rate according to the SFDR2,3 levels while SFDR1 = -5 dB. Previous results lead to an interrogation in case of a strong sensor failure. Indeed, if a sensor provides a wrong measurement tainted with low uncertainty (high du(1),u(2) and SFDR level) and no consensus is made, detection error rates should be high. Such a case has been simulated forcing the third sensor to give a wrong measurement and setting SFDR3 to 0 dB. Results are drawn in figure 7. As expected, the error rate increases quicker as SFDR1,2 levels decrease using the proposed approach. The existing evidential approach show good behavior compared to the probabilistic approach. A closer look to figure 7 allows to see that the results obtained using the proposed method are actually better as SFDR1,2 levels are higher than 10 dB so that less credit is given to the wrong sensor as it is considered to be less specific. Then the existing evidential method is the best suited between 10 dB and 0 dB SFDR1,2 levels as its smoother behavior allows taking sensors 1 and 2 measurements in consideration at such SFDR1,2 levels unlike the proposed method. Finally the probabilistic approach shows better performance for
SFDR1,2 levels lower than 0 dB because no additional credit is then given to the wrong sensor as it is the case when using evidential approaches. No general conclusion on the best suited approach can be drawn considering the strong sensor failure state as it depends on the healthy sensor SFDR level and, consequently, on the application case.
The fourth addressed case study considers the weak failure state of sensors 2 and 3. As they only provide noise, singularity detection problems should appear when this noise is important enough to provide measurements where du(1),u(2) is as important as in the healthy signal brought by sensor 1. This example allows us to emphasize the role of an important parameter which is the distance d as defined in (10) but applied to the original signal Y:
dY
u(1),u(2). This parameter not only has influence on the location of the detection error zones, but also leads to different behaviors according to the used method. The simulation results of the fourth case study are drawn in figure 8.
Figure 7 - Evolution of the detection error rate according to the SFDR1,2 levels when facing a strong failure state of
sensor 3 with SFDR3 = 0 dB.
The evidential based approaches show lower detection error rates in general, and the proposed approach gives better results for 10 dB < SFDR1,2,3 < 20 dB whereas the existing approach is the best to use when SFDR1,2,3 > 20
dB. Once again, taking epistemic uncertainty explicitly
into account provides lower error detection rates. Lower consensus provided by the proposed approach allows better detection when sensor 1 is not much perturbed by noise. The decision rule does not have a great influence in this case, but one can notice that as SFDR1,2,3 levels become lower, the maximum belief rule tends to show slightly higher detection error rates than the maximum pignistic probability rule.
Figure 8 - Evolution of the detection error rate according to the SFDR1,2,3 levels whan facing a weak failure state of
sensors 2 and 3.
The case studies exposed above demonstrate the better ability of evidential approaches to face unexpected sensor behaviors. They also provide good results even when only random effects occur. Other cases have been
experimented that confirm this trend. They are summarized in table 1.
Sensor state Normal Weak Failure Strong failure Affected sensors 3 2 1 2 1 2 High dY
u(1),u(2) (>0.7) ○ ○ + + + +
Low dY
u(1),u(2) (<0.3) + + + ○ ○ +
○: Cases exposed in section 3.2
+: Cases where simulations were conducted but not exposed in the paper
Table 1 - Cases studies on which numerical experiments were conducted.
An important criterion to choose between the different approaches appears to be the need of consensus to take a good decision. Indeed, the sharper behaviors of the proposed approach and the maximum belief decision rule are well adapted to perform singularity detection when considering at least one reliable sensor, so no consensus has to be made. However, we showed that if a sensor seems to be reliable but is actually in a strong failure state, more consensual approaches allow to perform lower detection error rates. In some cases, different approaches should be used according to the SFDR levels, enforcing the fact that approaches could be used complementarily.
More investigations are needed concerning the influence of the dY parameter, but simulations show that as the detection becomes more difficult (dY decreases) the evidential approaches show lower error rates. Moreover, the user defined parameters Pconf and θn used with the proposed approach should also be investigated as they are important levers of the modeling of uncertainty in the data alignment proposed approach. More specifically, the case of some probability density functions, like long tail distributions, raises questions about the definition of θn. Influence of sources number is also an interesting point to investigate.
4 Conclusion
The problem of singularity detection in signals considering hostile environments and redundant multisensor cases has been addressed. Two evidence theory based approaches have been exposed, implemented, and compared to the probabilistic approach. Simulation results shows that evidential approaches are generally best suited to face sensor dysfunction, and also provide good performance level in classical situations where only random effects are considered. The proposed approach, which has especially been designed to merge information coming from redundant information sources, shows lower detection error rates when at least one sensor is reliable. However, further investigation has to be made to explore the whole parameter space. Guidelines have been given to choose the best approach considering the application case. The complementarity of the different approaches has been emphasized, as choosing automatically the case’s best suited method could improve the overall performance of a monitoring system.
References
[1] IEC-ISO, “Guide to the Expression of Uncertainty in Measurement”, 1993.
[2] Simona Salicone, “Measurement Uncertainty – An Approach via the Mathematical Theory of Evidence”, Springer, 2007.
[3] David L. Hall, Sonya A. H. McMullen,
“Mathematical Techniques in Multisensor Data Fusion”, Artech House, Boston, 2004.
[4] Lucien Wald, “Definitions and Terms of Reference in Data Fusion”, International Archives of
Photogrammetry and Remote Sensing, Vol. 32, Part 7-4-3 W6, Valladolid, Spain, 1999.
[5] Stéphane Houzelle, Gérard Giraudon, “Contribution to Multisensor Fusion Formalization”, Robotics and Autonomous Systems, Vol. 13, pp. 69-85, 1994.
[6] Alan S. Willsky, “A Survey of Design Methods for Failure Detection in Dynamic Systems”, Automatica, Vol. 12, pp. 601-611, 1976.
[7] Arthur P. Dempster, “Upper and Lower Probabilities Induced by a Multivalued Mapping”, Annals of Mathematical Statistics, Vol. 38, 1967, pp. 325-339. [8] Glenn Shafer, “A Mathematical Theory of Evidence”, Princeton University Press, Princeton, NJ, 1976.
[9] Philippe Smets, Robert Kennes, “The Transferable Belief Model”, Artificial Intelligence, Vol. 66, pp. 191-234, 1994.
[10] James Manyika, Hugh Durant Whyte, “Data Fusion and Sensor Management: A decentralized Information-Theoretic Approach”, Ellis Horwood, New York, 1994. [11] Eric Lefevre et al., “Belief Function Combination and Conflict Management”, Information Fusion, Vol. 3, pp. 149-162, 2002.
[12] Philippe Smets, “Belief Functions on Real Numbers”, International Journal of Approximate Reasoning, Vol. 40, pp. 181-223, 2005.
[13] Mathias Bauer, “Approximation Algorithms and Decision Making in the Dempster-Shafer Theory of Evidence – An Empirical Study”, International Journal of Approximate Reasoning, Vol. 17, pp. 217-237, 1997. [14] BjØrnar Tessem, “Approximation for Efficient
Computation in the Theory of Evidence”, Artificial Intelligence, Vol. 61, pp. 315-329, 1993.