Science Arts & Métiers (SAM)
is an open access repository that collects the work of Arts et Métiers Institute of
Technology researchers and makes it freely available over the web where possible.
This is an author-deposited version published in: https://sam.ensam.eu
Handle ID: .http://hdl.handle.net/10985/14638
To cite this version :
Meng LI, Goyal ANCHAL, Véronique DOQUET, Nicolas RANC, JeanPhilippe COUZINIÉ
Ultrafine versus coarse grained Al 5083 alloys: From lowcycle to veryhighcycle fatigue
-International Journal of Fatigue - Vol. 121, p.84-97 - 2019
Any correspondence concerning this service should be sent to the repository
Administrator : archiveouverte@ensam.eu
Ultrafine versus coarse grained Al 5083 alloys: From low-cycle to
very-high-cycle fatigue
Meng Li
a,b, Anchal Goyal
a, Véronique Doquet
a,⁎, Nicolas Ranc
c, Jean-Philippe Couzinié
d aLaboratoire de Mécanique des Solides, CNRS UMR 7649, Ecole Polytechnique, 91128 Palaiseau, FrancebSchool of Naval Architecture, Ocean and Civil Engineering (State Key Laboratory of Ocean Engineering), Shanghai Jiao Tong University, 200240 Shanghai, China cArts et Métiers ParisTech, PIMM, UMR CNRS 8006, 151 Bd de l’Hôpital, 75013 Paris, France
dUniversité Paris Est, ICMPE (UMR 7182) CNRS-UPEC, 2-8 rue Henri Dunant, Thiais, France
A R T I C L E I N F O Keywords: Cyclic plasticity VHCF Ultrafine grains Al-Mg alloy Fish-eye A B S T R A C T
The fatigue performance of coarse and ultrafine-grained (UFG) 5083 Al alloy were compared, from low to very high cycle fatigue. The UFG alloy exhibited cyclic hardening and predominant kinematic hardening. At high plastic strain amplitude (and only in this regime), it showed easier crack initiation and a lower fatigue resistance. Its resistance to HCF was hardly better than that of its coarse grained counterpart until 2.106cycles, but 43%
higher in VHCF, until 5.108cycles. Beyond that point, internal crack initiation occurred, and the fatigue
re-sistance of the UFG material decreased, which was explained using Fracture Mechanics.
1. Introduction
Substantial improvements in yield stress and tensile strength of metals and alloys can be obtained through a refinement of their mi-crostructure to obtain nano-crystalline metals (grain size smaller than 100 nm) or ultrafine grained (UFG) metals (with a mean grain size ranging from 100 nm to 1 μm). The latter can be obtained either by compaction of nano-crystalline powders produced by cryo-milling or by several severe plastic deformation processes, among which Equal Channel Angular Pressing (ECAP) is quite popular.
For many industrial applications though, the fatigue performance is a selection criterion of structural materials and it was thus assessed for many UFG alloys[1,2]. However, fatigue damage is very sensitive to microstructural features like precipitates size and spatial distribution, heterogeneity in grain size and shape, as well as local textures, which all depend on the manufacturing process. As a consequence, conclu-sions drawn for materials issued from friction-stir processing, high pressure torsion, accumulative roll bonding, or cryo-milled powder consolidation may not be valid for those issued from ECAP[3]. Besides, observations made on ECAPed materials may themselves differ, de-pending on the ECAP route (i.e. rotation of the billet between con-secutive extrusions)[4], or even on the number of ECAP passes[5].
Furthermore, the gain or loss in fatigue resistance due to grain re-finement into the UFG regime is likely to be dependent on the intended life and on the loading mode. A higher tensile strength as compared to coarse grained (CG) materials is expected to improve the resistance of
UFG materials to high or very high cycle fatigue (denoted below as HCF and VHCF), which is generally observed[1,2,5–7], while a lower duc-tility is expected to reduce the performance in low-cycle fatigue (LCF), which is generally observed in strain-controlled tests[1,8–10], but not in stress-controlled tests[11,12]. While the entire S-N curve of a UFG material generally stands above that of its CG counterpart, their strain-life curves often cross[1,4].
Pure UFG metals, even at room temperature (RT), are prone to cyclic softening induced by grain growth. Such grain growth can occur inside localized shear bands, as observed for UFG Al[10,13], or UFG Cu
[14], around micro-cracks[15], from unrefined grains, or any pre-ex-isting inhomogeneity[16,17]. However, An et al.[18]and Zhang et al.
[15]have shown the beneficial effect of an increased Al or Zn content on the cyclic stability and fatigue performance of UFG copper alloys, while Canadinc et al.[5]have shown that solute Mg, which restricts dislocations mobility and recovery processes, promotes cyclic stability in UFG Al-Mg alloys.
Walley et al.[19]investigated the LCF behavior of a UFG Al 5083 -obtained by compaction of cryo-milled powder- through plastic strain-controlled push-pull tests. In spite of a moderate grain growth observed by TEM after cyclic loading at Δεp/2 = 0.2%, cyclic hardening was
observed. For a given plastic strain range, a similar fatigue life was found for CG and UFG alloys. By contrast, Sedighi et al.[9]who in-vestigated the LCF behavior of a UFG Al 5083 alloy obtained by Equal Channel Angular Rolling, through total strain-controlled tests reported a slight cyclic softening and reduced fatigue lives, as compared to the
⁎Corresponding author.
E-mail address:doquet@lms.polytechnique.fr(V. Doquet).
CG material. Patlan et al.[11]investigated the LCF and HCF behavior of a UFG Al 5056 Al-Mg alloy obtained by ECAP. They did not observe any significant cyclic hardening or softening during plastic-strain-con-trolled LCF tests, but a reduced life compared to the CG material. Under stress-control, the UFG material had a better resistance to LCF, but nearly the same resistance as the CG material in the HCF regime. A study in the HCF regime was run on a UFG Al 5083 obtained by cryo-rolling with or without subsequent warm cryo-rolling by Singh et al. [6]. They reported a significant enhancement in fatigue strength of the UFG material, compared to the coarse-grained material in the range 5 105−6 106 cycles. The S-N curves did not exhibit any horizontal
asymptote. Majchrowicz et al.[7]investigated the HCF behavior of a UFG 5083 alloy obtained by hydro-extrusion through repeated tension tests at −50 °C, 25 °C and 100 °C. At RT, they observed a significant enhancement in fatigue strength of the UFG material, compared to the coarse-grained material in the range 5 105−2 106cycles.
Micro-hard-ness measurements made before and after the fatigue tests at 25 °C suggested a slight softening, which was not due to grain growth, but to a reduction in dislocations density by a recovery process, according to TEM observations and X-ray diffraction peak analysis.
From this survey of the literature devoted to Al 5083 or 5056, it appears that for nearly the same composition, depending on the method used to obtain a UFG microstructure, cyclic hardening or softening can occur in LCF, with or without a reduction in fatigue resistance in strain-controlled tests, and that the expected improvement of the resistance to HCF is not always observed. The gain or loss in fatigue performance associated with a UFG microstructure is thus a more complex issue than anticipated, and seems to be influenced by other factors than strength and ductility.
Surprisingly, while the strong texture generally inherited from se-vere plastic deformation processes, and the presence of intermetallic particles might have a decisive influence on the damage mechanisms, their roles have not been much discussed so far. These two points de-serve more attention and are considered in the present study. Furthermore, the idea that UFG materials have a better resistance to crack initiation –inferred from their better resistance to HCF– is gen-erally supposed to hold whatever the loading range. But in most papers, the description of fatigue damage is purely qualitative, and does not allow to check that point. In the present study, an extensive statistical analysis of secondary micro-cracks shows that this may be wrong in LCF. Concerning cyclic plasticity of UFG materials, nearly all previous work focused on the amount and kinetics of hardening or softening, with little attention paid to the isotropic/kinematic character of this hardening, which might however shed light on the underlying de-formation mechanisms. Vinogradov et al.[20]as well as Patlan et al.
[11]underlined the more pointed shape of the stress-strain loops in UFG copper, suggesting a stronger Bauschinger effect. In the present study, constitutive equations are identified for both CG and UFG 5083 Al alloy, allowing a comparison of their isotropic/kinematic hardening, and the results are discussed, based on TEM observations.
From the elements provided above it is clear that in order to fully determine the potential and limitations of a UFG alloy in fatigue, it is important to investigate its behavior over a wide range of stress/strain amplitudes and fatigue lives. However, the literature on VHCF of UFG materials is very limited, and deals only with copper with various im-purity levels[21–23] or commercially pure aluminum[24]. In both metals, cracks kept initiating from PSBs on the surface, like in LCF and HCF regimes, and no internal crack initiation was observed in VHCF, as it is often the case in CG alloys in this regime. Grain coarsening was observed around cracks propagating at rates between 10−12and 10−10
m/cycle in pure copper, but not in commercially pure Cu[22,23]. The VHCF behavior of UFG alloys thus remains to be explored. That is why the present study compares the fatigue performance of a 5083 Al-Mg UFG alloy obtained by ECAP to that of the as received, CG material, from about 102to 1010cycles. The results are discussed based on
mi-crostructural features, quantitative data about fatigue damage, as well
as on Fracture Mechanics. 2. Experimental procedure
2.1. Investigated materials
An extruded bar of Al-5083 (composition inTable 1) in the H112 condition – that is slightly strain hardened – with a diameter of 20 mm was used to machine specimens of CG material, or rods for ECAP pro-cessing.
Fig. 1shows the initial CG microstructure in longitudinal (Fig. 1a) and transverse sections (Fig. 1b), as revealed by electron backscatter diffraction (EBSD). The grains are nearly equiaxed in the transverse plane, with a diameter ranging from 4 to 90 μm, but are elongated parallel to the bar axis, with a mean aspect ratio of 2.5. A typical bar texture with 〈1 1 1〉 and 〈1 0 0〉 fibers is observed (Fig. 1d). A post-treatment of EBSD data, based on Nye's tensor computation[25]and available in the ATEX© software allowed the density of geometrically necessary dislocations (GND) to be estimated as 3.6 1013m−2. The
material contains two types of intermetallic particles (Fig. 1c). EDS chemical analyses show that one type is rich in Mg and Si, and the other in Fe and Mn. These particles form rows parallel to the bar axis, up to 18 μm long. In the transverse section, their maximum diameter is 7 μm. 105 or 80 mm long pieces of the same bar were submitted to 6 ECAP passes at 150 °C, with a punch displacement rate of 0.05 mm/s, fol-lowing route Bc (rotation of 90° around the sample axis between each pass), in a lubricated die with an angle of 90°. The resulting micro-structure is presented inFig. 2, with the grain size distribution. This widespread distribution ranges from 200 nm to 2 μm, with a mean value around 600 nm. The microstructure is thus not fully ultrafine grained (UFG) but also contains some micron-sized grains.
The pole figures reveal a stronger and different texture than in the CG material, with a high density of {1 1 0} directions normal to the entrance and exit directions of the die, which is typical after ECAP following route Bc[26].Fig. 3compares maps of the maximum Schmid factor in each grain (for a stress applied in the same direction as during the fatigue tests) in CG and UFG alloys, and the corresponding dis-tributions of Schmid factors. The fraction of grains with a Schmid factor above 0.4 on at least one of their slip systems is 48% in the CG material, but only 17% in the UFG material.
More than 80% of the grain boundaries are high angle grain boundaries (HAGBs, with more than 15° misorientation). The GND density after ECAP is increased to 9.0 1014m−2.
The grains are elongated at 50−60° to the extrusion axis, which corresponds to the shearing direction during the last ECAP pass. The intermetallic particles are somewhat fragmented by this severe plastic deformation, but their fragments remain clustered, and the diameter of the largest particles on a transverse section is not significantly lower than in the CG material.
Fig. 4compares the engineering stress-strain curves of CG and UFG materials in tension at 2.10−3s−1. Both materials exhibit serrated flow,
due to solute Mg-induced dynamic strain aging, but this aspect is be-yond the scope of the present paper. As can be seen inTable 2, the 0.2% yield stress and ultimate tensile stress (UTS) of the UFG material (314 and 391 MPa, respectively) are much higher than those of the CG ma-terial (128 and 281 MPa, respectively). However, the ductility of UFG material (15.8%) is somewhat reduced, as compared to its CG coun-terpart (21.6%).
Table 1
Chemical composition of the material.
Element Mg Fe Mn Si Cr Cu Al
Fig. 1. Microstructure of the coarse grained material. EBSD maps of Euler angles (a) parallel and (b) normal to the bar axis (c) Rows of intermetallic particles along
the bar axis and (d) pole figures.
Fig. 2. Microstructure of the ultrafine grained material. EBSD maps of Euler angles (a) parallel and (b) normal to the bar axis, (c) BSE image of the fragmented
2.2. Procedures for the fatigue tests and subsequent observations
90 mm long cylindrical specimens, 8 mm in diameter and 16 mm in gage length (Fig. 5a), for LCF and HCF push-pull tests, as well as 54 mm long waisted cylindrical specimens for VHCF push-pull tests (Fig. 5b) were machined from the as received bar, or from the extruded rods, with the tensile axis parallel to the die exit direction. Both types of samples were mechanically polished and electro-polished.
A servohydraulic testing machine was used for fully reversed
push-pull tests, which were plastic strain controlled, thanks to an ex-tensometer, in LCF (with a fixed strain rate of 10−3s−1), or
stress-controlled in HCF (with a frequency between 5 and 10 Hz). Stress control in the plastic regime would not allow a good control of the strain rate, which might lead to substantial heating of the samples.
An ultrasonic testing device operating at 20 kHz was used for fully reversed push-pull tests in the VHCF regime. The geometry of the specimen, given inFig. 5b was designed to have its first longitudinal vibration mode at a frequency of 20 kHz. The machine was controlled via the tension applied to a piezoelectric converter, and therefore the vibration amplitude imposed on one edge of the specimen was con-trolled. Air cooling was applied to the samples, whose temperature never rose by more than 1 °C, as checked by infrared thermography. The stress applied to the specimen was calculated with a harmonic model, assuming a purely elastic response of the tested material. The normalized axial stress profile along the gage length, issued from the harmonic calculation is plotted inFig. 5c. Since the stress peaks at mid-length, fatigue fracture is expected to occur in that plane. However, in a few cases, the fracture plane was slightly shifted along the axis (by a few hundred microns). In that case, the stress amplitude in the fracture plane was reported and used to plot the S-N curve. However, in all cases, the correction remained small.
Optical digital microscopy was used for a statistical analysis of micro-cracks density, lengths and orientations on the outer surface of fatigued samples. Series of pictures with a magnification of 200–300 were captured and stitched to cover the whole gage length of the spe-cimens. To ensure a statistical representativeness, a minimum of three such bands per specimen, at different angular positions along the cir-cumference were used for a manual counting of micro-cracks and a measurement of their lengths, using imaging softwares (Gimp or Fiji). Such counting was done only for the high loading ranges, which pro-duced at least a few tens of micro-cracks in the observed area.
Scanning electron microscopy was used for observations of the fracture surfaces, and in some cases after cross sectioning with a Focused Ion Beam (FIB).
µ
µ
Fig. 3. (a, b) Maps of maximum Schmid factor in each grain and (c, d) corresponding histograms in CG (a, c) and UFG (b, d) materials.
Fig. 4. Engineering stress-strain curves of coarse and ultrafined grained
mate-rials.
Table 2
Tensile properties of CG and UFG Al 5083 at 2.10−3s−1.
Material σ0.2%(MPa) UTS (MPa) Fracture strain (%)
CG AL 5083 128 ± 3 281 ± 7 21.6 ± 1.6
TEM was used to analyze and compare the dislocation structures induced by cyclic plasticity in CG and UFG materials. For that purpose, slices were cut normal to the tensile axis of fatigued samples, as far away from the fracture surface as possible, mechanically ground, and finally electropolished in a double jet Tenupol apparatus, using a so-lution of 25% nitric acid in 75% methanol kept at −33 °C, under 12 V. Observations were carried out under bright-field and/or weak-beam conditions.
3. Experimental results
3.1. Cyclic plasticity
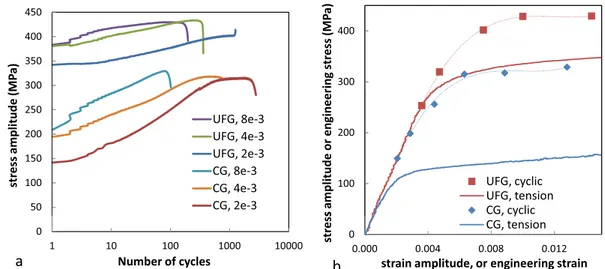
Fig. 6a compares the evolutions of the stress amplitude versus the number of cycles, in CG and UFG materials during plastic-strain con-trolled tests. Both materials exhibited cyclic hardening. This implies that the cyclic stress-strain curves -plotted using the stress amplitudes at mid-life, since no steady-state value exists- stand above the monotonic stress-strain curves (Fig. 6b). Cyclic hardening was more moderate in the UFG material, which will be discussed later.
The nature of this hardening was also different, as evident from the compared mid-life stress-strain loops CG/UFG at the same amplitude, shown inFig. 7: the loops are more elongated, with a steeper slope in the plastic regime in the UFG material, which suggests a more pro-nounced kinematic hardening (in other words: stronger Bauschinger effect).
The recorded stress-strain loops were fed to a Levenberg-Marquardt algorithm in order to fit constitutive equations using isotropic and non-linear kinematic hardening variables, according to Lemaitre and Chaboche’s model[27]:
Von Mises yield criterion was used, since the aim is not to describe the plastic anisotropy of the UFG material, but just the nature of its uniaxial cyclic hardening:
X R
J (2 ) =0 (1)
where J2denotes the second invariant. R denotes the isotropic
hard-ening variable:
R R Q(1 e b p).
0 .
= + (2)
X denotes the kinematic hardening variable:
dX=C d. p D X dp. . (3) where p denotes the cumulated plastic strain, R0, Q, b, C and D are
material parameters.
The best sets of parameters for CG and UFG materials are reported inTable 3.Fig. 8compares the measured and simulated stress-strain loops. The importance of kinematic hardening can be estimated by the ratio C/D, which corresponds to the asymptotic value of the kinematic variable at high tensile strain, while the importance of isotropic hard-ening is indicated by parameter Q. In UFG material, C/D is equal to 121.2 MPa, and is 3.3 times higher than Q, (36.2 MPa), while in CG material, C/D is equal to 94.6 MPa, which is smaller than Q (132 MPa). Kinematic hardening thus largely prevails in the UFG material, while isotropic hardening predominates in the CG alloy.
Fig. 5. Specimens geometry for (a) LCF and HCF tests, (b) VHCF tests and (c)
the normalized profile along the gage length.
Figs. 9 and 10show TEM micrographs of dislocation patterning for the CG and UFG materials, respectively and for plastic strain amplitudes of ± 2.10−3and ± 8.10−3. In CG material, a dense and uniform
dis-tribution of tangled and jogged dislocations was observed, for the lower amplitude (Fig. 9a). Many dislocations loops were also found in the microstructure, probably formed by the dipole bypassing mechanism after jog dragging[28]. The presence of curved dislocations near the Fig. 7. Compared mid-life stress-strain loops for CG and UFG materials.
Table 3
Best fit parameters for the constitutive equations of CG and UFG materials.
E (GPa) v R0(MPa) Q (MPa) b C (MPa) D
CG 67 0.3 102.5 132 2.6 54,467 575.7
UFG 66.5 0.3 276 36.2 9.86 29,523 243.5
ε
ε
ε
ε
ε
incoherent second phase particles suggests the Orowan-type bypassing mechanism. No organized features like veins, cells, labyrinths or lad-ders were found. In the UFG material, a heterogeneous microstructure was observed from one grain (or sub-grain) to the other after fatigue, contrary to the CG material for the same amplitude. While the smallest grains exhibited low dislocation densities (Fig. 10a), the larger ones contained loops and tangled dislocations (Fig. 10b), not so different from those observed in the CG material. The strong curvature of the dislocations suggests high internal stresses and probable pinning ef-fects. Dislocation loops bowing out of low-angle grain boundaries (LAGBs) could also be observed (Fig. 10b).
For the larger amplitude, a high density of tangled dislocations was observed in most grains of the CG material (Fig. 9b), and occasionally, some long and narrow band-like structures (Fig. 9c). In the UFG ma-terial, a very dense and non-structured network of tangled dislocations and loops was observed, without any obvious difference with the mi-crostructure found at the lower amplitude (Fig. 10c). The grain-to-grain heterogeneity in dislocations content previously observed was still present. The post-treatment of EBSD mappings made on the outer sur-face of fatigued samples did not reveal any evolution in the mean grain size.
3.2. Fatigue lives
Fig. 11shows the fatigue lives versus plastic strain amplitudes in the LCF regime. Except for the highest amplitude, for a given plastic strain range, the UFG material exhibits a lower fatigue life than its CG counterpart, and the difference tends to rise as the plastic strain range decreases. This unusual trend will be discussed later.
The S-N curves for CG and UFG materials, from LCF to VHCF are compared inFig. 12. Several domains can be distinguished. In the LCF range (N < 104cycles) the S-N curve of the UFG material lies clearly
above that for the CG material. For intermediate lives (N ranging from
104to 2.106cycles) the two curves nearly overlap, with a slightly better
resistance of the UFG material. Above 2.106cycles, the S-N curve of the
CG material exhibits a plateau at 140 MPa, which corresponds to 1.09 times the 0.2% yield stress of the CG material. The S-N curve of the UFG material first exhibits a plateau at 200 MPa, which is 0.64 times its 0.2% yield stress. However, above 5.108cycles, the fatigue resistance of
the material slowly decreases, and at 5.109cycles, it has the same level
as for the CG material.
3.3. Damage mechanisms
In CG material, crack initiation always occurred at the surface, mostly from persistent slip bands (Fig. 13a), and marginally from broken intermetallic particles (Fig. 13b), even in the VHCF regime. More than one crack initiation site was often observed on the fracture Fig. 9. Weak-beam dark field TEM micrographs of coarse grained LCF samples. (a) εp= ± 2.10−3Nf= 2784 cycles (b–c) εp= ± 8.10−3, Nf= 102 cycles.
Fig. 10. TEM observations of UFG LCF samples. (a–b) εp= ± 2.10−3, Nf= 1259 cycles, (c) εp= ± 8.10−3, Nf= 200 cycles. Micrographs (b) and (c) were taken
under weak-beam dark field conditions. Red arrows show dislocations bowing out from a LAGB. (For interpretation of the references to colour in this figure legend, the reader is referred to the web version of this article.)
surfaces, up to 5.8 108cycles. These surfaces, quite classically, were
characterized by a crystallographic facetted area around the crack in-itiation(s) site(s), corresponding to stage I growth, followed by a stri-ated area (stage II), and finally a more or less slanted area covered with dimples, corresponding to ductile fracture. No significant difference was noticed between the fracture surfaces corresponding to LCF, HCF and VHCF, except the decreasing size of the shear lips when the loading range decreased.
By contrast, in the UFG material, two regimes have to be considered separately in terms of damage mechanisms: below 5.108cycles (end of
the plateau on the S-N curve), and above.
In the first domain, a minority of crack initiations associated with extrusions was observed, especially in the largest grains (Fig. 14a and b). More frequently, cracks initiated from broken intermetallic particles (Fig. 14c and d), not always normal to the tensile axis, as might be expected, but most often along a direction inclined by 50−60°. In the LCF regime, micro-cracks often exhibited multiple branches, maybe along grain boundaries (Fig. 14d). Two micro-cracks paths are super-imposed on EBSD maps in Fig. 15. It appears that the cracks grew straight across relatively large grains, but exhibited a zigzag path in areas of finer grains. A closer look suggests an alternation of transgra-nular growth, across large grains, and intergratransgra-nular growth, in fine grain areas. A post-treatment of these EBSD data to get the local grain size distribution, and a comparison with that of the undeformed UFG
material did not reveal any local grain growth.
Fig. 16shows a fracture surface typical of the LCF regime (45,000 cycles to fracture). Several semi-circular micro-cracks (no less than 6 in this case), like the one shown inFig. 16a initiated from the surface, and the fracture surface looked relatively smooth, with radial markings, until these cracks reached approximately 150 μm in depth (which for the stress level of 200 MPa corresponds to ΔKIclose to 3 MPa√m). Then
striations appeared (Fig. 16b) as if a transition from stage I to stage II occurred. However, contrary to what usually happens in CG materials during such a transition, the crack roughness increased substantially. In the final slanted area, heavy friction marks and spalling due to the repeated contact between the crack lips were observed (Fig. 16c).
Fig. 17a and b compare the distributions of secondary cracks lengths on the outer surface of CG and UFG samples submitted to the same plastic amplitude: εp = ± 2.10−3. In CG material, the steady-state
stress amplitude was 315 MPa and the fatigue life 2876 cycles, while in UFG material, the steady-state stress amplitude was 402 MPa and the fatigue life 1259 cycles. In spite of this smaller number of cycles, the density of micro-cracks was much higher (82 per mm2) in the latter
than in the former (8.8 per mm2). For this plastic strain range, crack
initiation was thus easier and faster in the UFG material.
Fig. 17c shows the distributions of secondary cracks lengths on the outer surface of a UFG sample submitted nearly to the same stress amplitude ( ± 319 MPa) as the sample analyzed inFig. 17b. In the UFG sample, the mean cracks length was only 57.3 μm, compared to 112 μm in the CG sample, in spite of a much larger number of cycles (8482 cycles, as compared to 2876). This indicates that for this high stress amplitude, micro-cracks growth was slower in the UFG material.
By contrast, at a lower stress amplitude ( ± 200 MPa,Fig. 17d–e), the density of micro-cracks in the UFG alloy (0.97 per mm2) became
lower than in the CG alloy (1.22 per mm2), and the mean crack length
was 40% larger (38.8 μm instead of 26.8 μm), even though the number of cycles was only 11% larger. This suggests a faster growth in the UFG alloy, at this stress amplitude.
The mean crack nucleation rates (final crack density divided by the number of cycles to failure) in nine CG and UFG samples are plotted as a function of the strain amplitude inFig. 18. It is much higher in the UFG alloy at high strain range, but the difference with the CG alloy decreases as the strain rate decreases, and a crossing of the curves might exist. More tests would be necessary to check that point. While the angular distribution of the micro-cracks on the outer surface was relatively wide for the CG material, it was quite narrow and asymmetrical in the UFG material, with a preferential inclination around 60 degrees.
Fig. 12. Compared S-N curves for CG and UFG materials. A
super-imposed × denotes internal crack initiation.
50 µm 100 µm
Fig. 13. Damage mechanisms in the CG material. εp= ± 2.10−3, Nf= 2784 cycles. (a) Crack initiation from localized slip bands, and (b) crack initiation from
Above 5.108 cycles, a transition towards internal crack initiation
with the so-called “fish-eye patterns” was observed (Fig. 19). In seven cases out of eight, the “defect” at the origin of fracture looked like a cluster of intermetallic particles (Fig. 19b), while for the sample cor-responding to the longest life of 5.5 109cycles, no such particles were
visible on the fracture surface, which seemed covered with roof tiles-like features all along the same direction (Fig. 19d). No striations were observed for any of these internal cracks, contrary to the cracks grown in air.
To get more information about internal crack initiation
mechanisms, radial cross sections from the center of such “fish-eye patterns” were made, after platinum deposition, using FIB. Fig. 20
shows SEM images of two such sections, for the same UFG samples as those shown inFig. 19.Fig. 20b confirms the presence of a relatively large broken intermetallic particle along the crack path, near the in-itiation site for the sample failed after 9.44 108cycles, whileFig. 20c
reveals the presence of several more or less aligned, 90–280 nm large cavities below the probable crack initiation site.
In both cases, the crack path was initially quite rough, with 5–15 μm high “cliffs” and became smoother and more normal to the tensile axis
5 µm
10 µm
50 µm
20 µm
Fig. 14. Damage mechanisms in UFG
ma-terial. εp = ± 4.10−3, Nf= 359 cycles.
(a–b) Crack initiation from localized slip bands, and (c–d) Crack initiation from broken intermetalic particles. The red ar-rows point to branches. The tensile axis is horizontal. (For interpretation of the refer-ences to colour in this figure legend, the reader is referred to the web version of this article.)
µ
µ
Fig. 15. EBSD analysis of two micro-cracks paths relative to the microstructure of a UFG sample εp= ± 4.10−3. The tensile axis is vertical.
µ
µ µ
Fig. 16. Fracture surface of a UFG sample submitted to a stress-controlled test at ± 200 MPa (Nf= 45,438 cycles). (a) One of the cracks initiated from the surface, (b)
striations (the arrow indicates the crack growth direction) and (c) heavily mated slanted zone.
1259 cycles µ 2876 cycles µ 8482 cycles µ µ µ µ µ µ µ µ
as the crack grew. No sign of local grain growth was found along this path. In a few places, areas of very fine grains (120–150 nm large) were observed along the crack path. However, it cannot be concluded that a nano-crystalline layer was formed, as it is often the case for “fish-eye patterns” in coarse grained materials in VHCF, because (1) such small grains are only present over limited portions of the crack path and (2) such a grain size is actually present (although not so frequent) in the wide grain size distribution of the UFG material (seeFig. 2e). 4. Discussion
The large isotropic hardening highlighted in CG material is con-sistent with the large number of dislocation loops and jogged
dislocations revealed by TEM after plastic-strain controlled tests. Loops and jogs constitute strong obstacles on gliding dislocations[28]. The non negligible kinematic hardening can be related to the interaction of dislocations with incoherent intermetallic particles. The dislocation loops left around the particles after Orowan's bypassing process is known to induce a back stress on gliding dislocations, that assists their backward glide upon load reversal and thus a Bauschinger effect.
The absence of cyclic softening of the UFG material is consistent with the results from Canadinc et al.[14]about the stabilizing effect of solute Mg, which restricts dislocations mobility and thus hinders re-covery and grain growth in Mg rich Al-Mg alloys. The high fraction of HAGBs in the material (more than 80%) probably contributes to its stability as well. The dislocation density is already very high after ECAP and the capacity for a further increase is limited, which explains the more modest isotropic hardening compared to the CG material.
The heterogeneity in deformation from one grain to the other, especially between the “large” and ultrafine grains in the UFG material contributes to its high kinematic hardening. A higher Bauschinger effect in the UFG microstructure was also reported (based on the pointer shape of the stress-strain loops) for ECAPed copper by Vinogradov et al.
[20].
In LCF, the reduction in life of the UFG material compared to its CG counterpart decreases as the plastic strain amplitude increases, up to the point that the two curves seem to cross at the highest amplitude -which should not be considered as a definitive result, owing to the limited number of data-points and the scatter often found, even in this regime [29]. This result is opposite to the trend reported in several papers (for example[4]). However, these papers mostly concern mi-crostructurally unstable, cyclically softening UFG materials in which softening and grain coarsening, associated with strain localization tend to increase with the strain amplitude, leading to a more pronounced Fig. 18. Crack nucleation rate in CG and UFG alloys.
µ
µ
µ
reduction in life than at lower amplitudes. In the present study, no such cyclic softening is observed, but at the contrary, a significant hardening. Walley et al.[19]who performed plastic-strain controlled LCF tests on cryo-milled 5083 Al alloy (that exhibited cyclic hardening as well, after a slight transient softening attributed to the relaxation of residual stresses) also reported very little difference in life with the CG material at high plastic strain amplitude, or even slightly better life for the UFG alloy, as in the present case.
The easier crack nucleation and the slower growth of micro-cracks observed here in the UFG alloy at high plastic strain amplitude are also in contradiction with what is usually reported, but these two results are consistent with one another and, paradoxically, with the divergence of the Manson-Coffin curves when the plastic strain amplitude decreases. A large micro-cracks density might produce a shielding effect that would slow down micro-cracks growth. Diffuse energy dissipation by (slow) growth of many cracks would occur, instead of a more localized dissipation by (fast) growth of a smaller number of cracks. The presence of many branches along the micro-cracks in LCF might also reduce their growth rate. When the plastic strain amplitude decreases, so does the micro-cracks density, and without a shielding effect, the usual tendency for faster crack growth in UFG materials[30]reappears.
On the other hand, the large density of micro-cracks that form in the UFG alloy in LCF also promotes the coalescence of those initiated in the same cross section, and indeed, up to six different crack initiation sites were sometimes observed on a given fracture surfaces, in this regime. Such a crack coalescence phenomenon might be the main cause for its earlier fracture (with a minor contribution of the reduced crack in-itiation stage, which does not constitute a large part of life in LCF).
While the micro-cracks exhibit a wide variety in their orientations relative to the tensile axis in the CG material, a preferential orientation around 60° was found in the UFG material. This direction corresponds more or less to the shear-induced elongation direction of the grains during ECAP, and it was shown by Niendorf et al.[31]or Arzaghi et al.
[32]that ECAP-processed UFG materials have a preference for fatigue crack growth along the grain elongation direction. In addition, the grains with a high SF in the UFG material were found to have a (0 0 1) direction nearly parallel to the tensile axis, so that the {1 1 1} plane
with the highest SF on one of its slip systems would have a trace on the surface inclined by 50–60°, which corresponds to the preferential micro-cracking direction.
For the smooth cylindrical specimens used in conventional fatigue tests, the uniformly stressed volume and external surface were 804 mm3
and 402 mm2, respectively, while for the waisted specimens used in
ultrasonic fatigue tests, due to the non uniform stress profile along the gage length, the volume and external surface submitted to more than 90% of the maximum stress were only 194 mm3 and 127 mm2,
re-spectively. The two types of specimens thus differed nearly by a factor of four for both parameters. This size effect might explain the slight apparent upward shift of the data points from ultrasonic fatigue tests relative to those from conventional tests, although it might as well be due to the scatter of fatigue lives inherent to HCF.
The results of the VHCF tests suggest an endurance limit around 140 MPa for the CG material. This value –which might be somewhat lower in larger specimens– is 1.09 times its yield stress and 0.5 times its UTS. The latter is close to the ratio of 0.4–0.5 reported by Estrin and Vinogradov for slightly strain hardened CG Al-Mg alloys[2]. In this material, no transition towards internal crack initiation was observed when the stress range was further reduced.
The plateau at 200 MPa on the S-N curve of the UFG material cor-responds to a limit for surface-initiated fatigue fracture. This stress level – which might be somewhat lower in larger specimens – is 0.64 times
µ
µ
µ
Fig. 20. Radial cross sections of “fish-eye” patterns in the same UFG samples as those shown inFig. 19. (a–b) Δσ/2 = 186 MPa, 9.44 108cycles, and (c–e) Δσ/
2 = 149 MPa, 5.5 109cycles. The arrows point towards the center of the fish eyes.
Table 4
Computation of ΔKIfor incipient internal penny-shape crack growth.
Defect radius (μm) Peak stress (MPa) ΔKI(MPa√m)
21 186 0.95 30 186 1.15 32 181 1.15 30 177 1.10 29 169 1.08 30 163 1.01 31 158 1.00 46 149 1.14
the 0.2% yield stress, as compared to a ratio of 1.09 in the CG material. While the yield stress reflects the average behavior of a material, the fatigue resistance reflects the “weakest link” in the microstructure. Since the heterogeneity of the ECAPed material –which contains both UFG and micron-sized grains– is more pronounced than that of its CG counterpart, it seems logical that its fatigue resistance represents a lower fraction of its yield stress.
The value of 200 MPa also corresponds to 0.51 times the UTS, which is substantially higher than the ratio (0.34) reported by Patlan and Vinogradov[11]for UFG 5056 Al-Mg alloy obtained by 4 ECAP passes following route Bc at 110 °C. Although this material was comparable in terms of tensile properties, it was prone to cyclic softening, contrary to the present one, which might explain the difference
Linear Elastic Fracture Mechanics was well suited to explain the subsequent decrease in resistance to fatigue above 5.108cycles, because
(1) the peak stress was less than 0.64 the 0.2% yield stress and (2) the internal cracks already constituted “microstructurally long cracks” when their diameter was above 10–15 μm. For a penny-shape crack of radius a, the amplitude of the stress intensity factor, ΔKIcan be
com-puted, taking only the tensile part of the cycle into account as:
KI=2 max a (4)
The radius of the cluster of defects at the center of the “fish-eye patterns”, as well as the peak stress of each test, and the computed ΔKI
for incipient internal crack growth are gathered inTable 4. ΔKIappears
to be nearly the same for all tests, and close to 1 MPa√m, which cor-responds to the threshold ΔKIfor short fatigue cracks growth at R = −1
in Al 5083 alloy, according to Costa et al.[33]and is also consistent with the threshold measured on UFG Al-7.5 Mg by Pao et al.[34]. The fatigue resistance of the UFG alloy above 5.108 cycles seems thus
controlled by the capacity of internally-initiated cracks to propagate. The lower the stress amplitude, the larger the cluster of defect needed to allow crack growth.
In the CG material, in which cracks initiated mostly from slip bands in suitably oriented grains, an external surface of 127 mm2was still
sufficient at 140 MPa to ensure the presence of at least one such grain with a relatively large size, and neighbors that do not exhibit too much misorientation, so that the micro-crack can cross the first grain boundaries, reach the threshold ΔKIand grow until failure.
In the UFG material where the grains and most intermetallic parti-cles were smaller, and where the probability for a grain to be sur-rounded by grains suitably oriented for plasticity was lower (seeFig. 3), an external surface of 127 mm2might not be sufficient below 200 MPa
to ensure the presence of at least one “defect” large enough for the crack to reach the threshold ΔKI. The probability to have such a defect
in the highly stressed volume of 194 mm3was higher, and this might
explain the transition towards internal crack initiation.
Fig. 20a and b suggest that two different mechanisms for internal crack initiation in the UFG material might actually exist: one triggered by the fracture of a few microns-wide intermetallic particles or clusters of particles, and the other, observed only at very long lives (5.5 109
cycles) triggered by the coalescence of one to two hundred nanometer wide cavities. Such cavities might result from the ECAP process, as suggested by the Small angle X-ray scattering measurements of Lapovok et al.[35]who reported the presence of 5–100 nm wide cavities in UFG titanium or by those of Betekhtin et al.[36]in an Al-Mg-Li alloy.
To the author's best knowledge, the only other report of internal crack initiation in a UFG alloy was made recently by Esmaeili et al.[5], for a 7075 Al UFG alloy obtained by 4 ECAP passes, after several million rotating bending cycles, but no “fish-eye” pattern was mentioned, nor a possible cause for this internal initiation, and it was not clear whether this occurred once, or repeatedly.
5. Conclusions
The UFG Al 5083 produced by 6 passes of ECAP at 150 °C in-vestigated here exhibits a stable microstructure, and cyclic hardening when submitted to plastic-strain-controlled push-pull tests. This hard-ening is however less pronounced than for its CG counterpart, because its initial dislocation density after ECAP is high, and its capacity to store more dislocations is limited. In the ECAPed alloy, a strong kinematic hardening is observed, which is attributed mainly to a high hetero-geneity in plastic deformation from grain-to-grain, especially between “large” and small grains.
A statistical analysis of secondary micro-cracks shows that at high plastic strain amplitude, the crack nucleation rate (mostly from inter-metallic particles) is much higher in the UFG alloy, so that crack coa-lescence phenomena might be responsible for its reduced fatigue life, in spite of a lower crack growth rate attributed to shielding effects, as well as to the presence of many branches. The micro-cracks exhibit trans-granular growth across the largest grains, but intertrans-granular growth in the small grained areas.
As the loading range decreases, the difference in crack nucleation rate between CG and UGH alloys however decreases, and at the lowest amplitude for which the statistical analysis of damage is meaningful, this rate becomes lower in the latter. On the other hand, the micro-crack growth rate in the UFG alloy becomes higher than in the CG alloy in the HCF regime, which might explain why between 104and 2.106
cycles, its fatigue performance is just slightly better.
The S-N curve of the CG material exhibits a horizontal asymptote around 140 MPa which corresponds to 1.09 times its yield stress or 0.5 times its UTSs.
The S-N curve of the UFG material also exhibits a plateau at 200 MPa between 2.106and 5.108cycles. This stress level, which is
0.64 times its 0.2% yield stress or 0.51 times its UTS corresponds to the endurance limit for surface crack initiation.
However, above 5.108 cycles, a transition towards internal crack
initiation from intermetallic particles or from cavities clusters occurs, with a very rough initial crack path. The fatigue resistance of the UFG material slowly decreases until at 5.109cycles, it has the same level as
for the CG material. This decrease can be explained considering the threshold ΔKIfor the growth of a penny shape crack.
For engineering applications, the UFG alloy only exhibits a clear superiority over its CG counterpart between 2.106and 5.108cycles,
where its resistances is 43% higher. Acknowledgments
The dual-beam SEM of the MatMéca facilities, funded by the « Investissements d’Avenir » program managed by Agence Nationale de la Recherche under the reference: ANR-10-EQPX-37 was used in this study. It was operated by Alexandre Tanguy who's contribution is gratefully acknowledged. The support provided by China Scholarship Council (CSC) for the visit of Li MENG to Laboratoire de Mécanique des Solides is acknowledged
References
[1] Mughrabi H, Höppel HW. Cyclic deformation and fatigue properties of very fine-grained metals and alloys. Int J Fatigue 2010;32:1413–27.
[2] Estrin Y, Vinogradov A. Fatigue behavior of light alloys with ultrafine grain struc-ture produced by severe plastic deformation: an overview. Int J Fatigue 2010;32:898–907.
[3] Xue P, Huang Z, Wang B, Tian Y, Wang W, Xiao B, et al. Intrinsic high cycle fatigue behavior of ultrafine grained pure Cu with stable microstructure. Sci China Mater 2016;7:531–7.
[4] Böhner A, Höppel HW, May J, Göken M. Influence of the ECAP processing para-meters on the cyclic deformation behavior on ultrafine-grained cubic face centered metals. Adv Engng Mater 2012;14(10):842–7.
[5] Esmaeili A, Hossein Shaeri M, Talafi Noghani M, Razaghian A. Fatigue behavior of AA7075 aluminium alloy severely deformed by equal channel angular pressing. J Alloys Compd 2018;757:324–32.
[6] Singh D, Nageswara Rao P, Jayaganthan R. High cyclic fatigue behavior of ultrafine grained Al 5083 alloy. Mater Sci Techn 2014;30:1835–42.
[7] Majchrowicz K, Pakieła Z, Giżyńskia M, Karnya M, Kulczykb M. High-cycle fatigue strength of ultrafine-grained 5483 Al-Mg alloy at low and elevated temperature in comparison to conventional coarse-grained Al alloys. Int J Fatigue 2018;106:81–91. [8] Malekjani S, Hodgson PD, Cizek P, Sabirov I, Hilditch T. Cyclic deformation
re-sponse of UFG 2024 Al alloy. Int J Fatigue 2011;33:700–9.
[9] Sedighi M, Monshi P, Joudaki J. Investigation of mechanical properties and fatigue life of ECARED AA5083 aluminium alloy. Fat Fract Engng Mater Struct 2017;40:412–22.
[10] Wong MK, Kao WP, Lui JT, Chang CP, Kao PW. Cyclic deformation of ultrafine-grained Aluminum. Acta Mater 2007;55:715–25.
[11] Patlan V, Vinogradov A, Higashi K, Kitagawa K. Overview of fatigue properties of fine grain 5056 Al-Mg alloy processed by equal-channel angular pressing. Mater Sci Engng A 2001;300:171–82.
[12] Fintova S, Kunz L. Initiation of fatigue cracks in AZ91 Mg alloy processed by ECAP. IOP Conf Ser: Mater Sci Engng 2014;63:012159.
[13] Malekjani S, Hodgson PD, Cizek P, Hilditch T. Strain rate effect on the cyclic de-formation response of UFG Al alloys. Mater Sci Engng A 2012;548:69–74. [14] Canadinc D, Niendorf T, Maier HJ. A comprehensive evaluation of parameters
governing the cyclic stability of ultrafine-grained FCC alloys. Mater Sci Engng, A 2011;528:6345–55.
[15] Zhang ZJ, Zhang P, Zhang ZF. Cyclic softening of ultra-fine grained Cu-Zn alloys. Acta Mater 2016;121:331–42.
[16] Kwan, Wang. Cyclic deformation behavior of ultra-fine grained copper processed by accumulative roll-bonding. Proc Engng 2010;2:101–10.
[17] Kümmel F, Hausöl T, Höppel HW, Göken M. Enhanced fatigue lives in AA1050A/ AA5005 laminated metal composites produced by accumulative roll bonding. Acta Mater 2016;120:150–8.
[18] An XH, Wu SD, Wang ZG, Zhang ZF. Enhanced cyclic deformation responses of ultrafine-grained Cu and nanocrystalline Cu-Al. Acta Mater 2014;74:200–14. [19] Walley JL, Lavernia EJ, Gibeling JC. Low-cycle fatigue of ultra-fine-grained
cryo-milled 5083 aluminium alloy. Metal Mater Trans 2009;40A:2622–30. [20] Vinogradov A, Kaneko Y, Kitagawa K, Hashimoto S. Cyclic response of
ultrafine-grained copper at constant plastic strain amplitude. Scripta Mater 1997;36(11):1345–51.
[21] Kunz L, PLukaš, Navratilova L. Strain localization and fatigue crack initiation in ultrafine-grained copper in high- and giga-cycle region. Int J Fatigue 2014;58:202–8.
[22] Horky J, Khatibi G, Weiss B, Zehetbauer MJ. Role of structural parameters of ultra-fine grained Cu for its fatigue and crack growth behaviour. J Alloys Compd 2011;509S:S323–7.
[23] Khatibi G, Horky J, Weiss B, Zehetbauer MJ. High cycle fatigue behaviour of copper deformed by high pressure torsion. Int J Fatigue 2010;32:269–78.
[24] Höppel HW, May L, Prell M, Göken M. Influence of grain size and precipitation state on the fatigue lives and deformation mechanisms of CP aluminium and AA6082 in the VHCF-regime. Int J Fatigue 2011;33:10–8.
[25] Pantleon W. Resolving the geometrically necessary dislocation content by con-ventional electron backscattering diffraction. Scripta Mater 2008;58:994–7. [26] Zhilyaev AP, Swisher DL, Oh-ishi K, Langdon TG, McNelley TR. Microtexture and
microstructure evolution during processing of pure aluminum by repetitive ECAP. Mater Sci Engng A 2006;429:137–48.
[27] Lemaitre J, Chaboche J-L. Mechanics of solid materials. Cambridge University Press; 1994.
[28] Messerschmidt U. Dislocation dynamics during plastic deformation. Springer series in materials science 129 Berlin Heidelberg: Springer Verlag; 2010.https://doi.org/ 10.1007/978-3-642-03177-9.
[29] Hockauf K, Niendorf T, Wagner S, Halle T, Meyer LW. Cyclic behavior and micro-structural stability of ultrafine-grained AA6060 under strain-controlled fatigue. Proc Engng 2010;2:2199–208.
[30] Cavaliere P. Fatigue properties and crack behavior of ultra-fine and nanocrystalline pure metals. Int J Fatigue 2009;31:1476–89.
[31] Niendorf T, Rubitschek F, Maier HJ, Canadinc D, Karaman I. On the fatigue crack growth–microstructure relationship in ultrafine-grained interstitial-free steel. J Mater Sci 2010;45:4813–21.
[32] Arzaghi M, Sarrazin-Baudoux C, Petit J. Fatigue crack growth in ultrafine-grained copper obtained by ECAP. Adv Mater Res 2014;891–892:1099–104.
[33] Costa JD, Branco CM, Radon JC. Short fatigue crack growth behavior in Al 5083 alloy. Int J Fatigue 1997;19:161–8.
[34] Pao PS, Jones HN, Cheng SF, Feng CR. Fatigue crack propagation in ultrafine grained Al–Mg alloy. Int J Fatigue 2005;27:1164–9.
[35] Lapovok R, Tomus D, Mang J, Estrin Y, Lowe TC. Evolution of nanoscale porosity during equal-channel angular pressing of titanium. Acta Mater 2009;57:2909–18. [36] Betekhtin VI, Kadomtsev AG, Sklenicka V, Saxl I. Nanoporosity of fine-crystalline