Science Arts & Métiers (SAM)
is an open access repository that collects the work of Arts et Métiers Institute of
Technology researchers and makes it freely available over the web where possible.
This is an author-deposited version published in: https://sam.ensam.eu Handle ID: .http://hdl.handle.net/10985/13635
To cite this version :
Alain ETIENNE, Jean-Yves DANTAN, Paul STIEF, Ali SIADAT - A new methodology to analyze the functional and physical architecture of existing products for an assembly oriented product family identification - Procedia CIRP - Vol. 70, p.47-52 - 2018
Any correspondence concerning this service should be sent to the repository Administrator : archiveouverte@ensam.eu
ScienceDirect
Available online at www.sciencedirect.com
Available online at www.sciencedirect.com
ScienceDirect
Procedia CIRP 00 (2017) 000–000www.elsevier.com/locate/procedia
2212-8271 © 2017 The Authors. Published by Elsevier B.V.
28th CIRP Design Conference, May 2018, Nantes, France
A new methodology to analyze the functional and physical architecture of
existing products for an assembly oriented product family identification
Paul Stief *, Jean-Yves Dantan, Alain Etienne, Ali Siadat
École Nationale Supérieure d’Arts et Métiers, Arts et Métiers ParisTech, LCFC EA 4495, 4 Rue Augustin Fresnel, Metz 57078, France
* Corresponding author. Tel.: +33 3 87 37 54 30; E-mail address: paul.stief@ensam.eu
Abstract
In today’s business environment, the trend towards more product variety and customization is unbroken. Due to this development, the need of agile and reconfigurable production systems emerged to cope with various products and product families. To design and optimize production systems as well as to choose the optimal product matches, product analysis methods are needed. Indeed, most of the known methods aim to analyze a product or one product family on the physical level. Different product families, however, may differ largely in terms of the number and nature of components. This fact impedes an efficient comparison and choice of appropriate product family combinations for the production system. A new methodology is proposed to analyze existing products in view of their functional and physical architecture. The aim is to cluster these products in new assembly oriented product families for the optimization of existing assembly lines and the creation of future reconfigurable assembly systems. Based on Datum Flow Chain, the physical structure of the products is analyzed. Functional subassemblies are identified, and a functional analysis is performed. Moreover, a hybrid functional and physical architecture graph (HyFPAG) is the output which depicts the similarity between product families by providing design support to both, production system planners and product designers. An illustrative example of a nail-clipper is used to explain the proposed methodology. An industrial case study on two product families of steering columns of thyssenkrupp Presta France is then carried out to give a first industrial evaluation of the proposed approach.
© 2017 The Authors. Published by Elsevier B.V.
Peer-review under responsibility of the scientific committee of the 28th CIRP Design Conference 2018.
Keywords: Assembly; Design method; Family identification
1. Introduction
Due to the fast development in the domain of communication and an ongoing trend of digitization and digitalization, manufacturing enterprises are facing important challenges in today’s market environments: a continuing tendency towards reduction of product development times and shortened product lifecycles. In addition, there is an increasing demand of customization, being at the same time in a global competition with competitors all over the world. This trend, which is inducing the development from macro to micro markets, results in diminished lot sizes due to augmenting product varieties (high-volume to low-volume production) [1]. To cope with this augmenting variety as well as to be able to identify possible optimization potentials in the existing production system, it is important to have a precise knowledge
of the product range and characteristics manufactured and/or assembled in this system. In this context, the main challenge in modelling and analysis is now not only to cope with single products, a limited product range or existing product families, but also to be able to analyze and to compare products to define new product families. It can be observed that classical existing product families are regrouped in function of clients or features. However, assembly oriented product families are hardly to find.
On the product family level, products differ mainly in two main characteristics: (i) the number of components and (ii) the type of components (e.g. mechanical, electrical, electronical).
Classical methodologies considering mainly single products or solitary, already existing product families analyze the product structure on a physical level (components level) which causes difficulties regarding an efficient definition and comparison of different product families. Addressing this
Procedia CIRP 70 (2018) 47–52
2212-8271 © 2018 The Authors. Published by Elsevier B.V. © 2018 The Authors. Published by Elsevier B.V.
Peer-review under responsibility of the scientific committee of the 28th CIRP Design Conference 2018.
ScienceDirect
Procedia CIRP 00 (2017) 000–000
www.elsevier.com/locate/procedia
2212-8271 © 2017 The Authors. Published by Elsevier B.V.
Peer-review under responsibility of the scientific committee of the 28th CIRP Design Conference 2018.
28th CIRP Design Conference, May 2018, Nantes, France
A new methodology to analyze the functional and physical architecture of
existing products for an assembly oriented product family identification
Paul Stief *, Jean-Yves Dantan, Alain Etienne, Ali Siadat
École Nationale Supérieure d’Arts et Métiers, Arts et Métiers ParisTech, LCFC EA 4495, 4 Rue Augustin Fresnel, Metz 57078, France
* Corresponding author. Tel.: +33 3 87 37 54 30; E-mail address: paul.stief@ensam.eu
Abstract
In today’s business environment, the trend towards more product variety and customization is unbroken. Due to this development, the need of agile and reconfigurable production systems emerged to cope with various products and product families. To design and optimize production systems as well as to choose the optimal product matches, product analysis methods are needed. Indeed, most of the known methods aim to analyze a product or one product family on the physical level. Different product families, however, may differ largely in terms of the number and nature of components. This fact impedes an efficient comparison and choice of appropriate product family combinations for the production system. A new methodology is proposed to analyze existing products in view of their functional and physical architecture. The aim is to cluster these products in new assembly oriented product families for the optimization of existing assembly lines and the creation of future reconfigurable assembly systems. Based on Datum Flow Chain, the physical structure of the products is analyzed. Functional subassemblies are identified, and a functional analysis is performed. Moreover, a hybrid functional and physical architecture graph (HyFPAG) is the output which depicts the similarity between product families by providing design support to both, production system planners and product designers. An illustrative example of a nail-clipper is used to explain the proposed methodology. An industrial case study on two product families of steering columns of thyssenkrupp Presta France is then carried out to give a first industrial evaluation of the proposed approach.
© 2017 The Authors. Published by Elsevier B.V.
Peer-review under responsibility of the scientific committee of the 28th CIRP Design Conference 2018.
Keywords: Assembly; Design method; Family identification
1. Introduction
Due to the fast development in the domain of communication and an ongoing trend of digitization and digitalization, manufacturing enterprises are facing important challenges in today’s market environments: a continuing tendency towards reduction of product development times and shortened product lifecycles. In addition, there is an increasing demand of customization, being at the same time in a global competition with competitors all over the world. This trend, which is inducing the development from macro to micro markets, results in diminished lot sizes due to augmenting product varieties (high-volume to low-volume production) [1]. To cope with this augmenting variety as well as to be able to identify possible optimization potentials in the existing production system, it is important to have a precise knowledge
of the product range and characteristics manufactured and/or assembled in this system. In this context, the main challenge in modelling and analysis is now not only to cope with single products, a limited product range or existing product families, but also to be able to analyze and to compare products to define new product families. It can be observed that classical existing product families are regrouped in function of clients or features. However, assembly oriented product families are hardly to find.
On the product family level, products differ mainly in two main characteristics: (i) the number of components and (ii) the type of components (e.g. mechanical, electrical, electronical).
Classical methodologies considering mainly single products or solitary, already existing product families analyze the product structure on a physical level (components level) which causes difficulties regarding an efficient definition and comparison of different product families. Addressing this
48 Paul Stief et al. / Procedia CIRP 70 (2018) 47–52
2 Author name / Procedia CIRP 00 (2018) 000–000
research gap, the key question is “How to analyze and model product varieties and how define product families?”. To answer this question and to acquire the described needed knowledge of products, a new modeling method is presented.
This research is part of a PhD project with the global aim to measure and improve the agility of production systems. The presented method contributes to the product analysis part and is a brick of a future integrated methodology and software application. Information out of the product analysis will be joined to process information and serve as input for the production system design and optimization part. Using the existing product as starting point, the method can be partly located in a reverse engineering approach. Referring to the FBS approach, the method is located in the link B ← S, the structure being the product analyzed and the behavior being its technical realization (technical function). The functional level is taken as input parameter for the method but not concerned or modified.
In the following, Section 2 gives a brief literature review on existing modeling approaches representing the structure of an assembly and highlighting the need for an evolution of these approaches. Section 3 presents the proposed new methodology, supported by an illustrative example. In Section 4, this methodology is applied to a first case study and the results are discussed. Finally, Section 5 gives a conclusion and outlines the further work.
2. Literature review
Over the years, several approaches to model an assembly have found their way to industrial application. They are identified by Daniel Whitney as follows [2]:
Part list: most simple model which presents only the different components of an assembly
Bill of materials (BOM): model in form of a segmented, hierarchical list identifying subassemblies and their components
Liaison graph: simple, non-directed graph in which nodes represent components and edges stand for connections between the components
Datum Flow Chain (DFC): directed graph comparable to the liaison graphs in which the direction of the arcs indicates the relative positioning of components and values on the arcs indicate eliminated degrees of freedom.
In addition, a new method based on cladistics was proposed a few years ago [3]. After a pre-evaluation of the different models, part lists and BOM are no further considered in the literature review because both do not furnish information about the relation between components and are therefore not useful for assembly modelling. An evolution of BOM, the generic BOM, was proposed for the representation of product varieties [4]. However, it is still not able to illustrate relations between components [5]. For these reasons, the following review focuses on the evaluation of the most promising approaches which are (i) liaison graphs, (ii) DFC and (iii) cladistics.
2.1 Assembly representation in sequence generation and liaison graphs
In 1984, Bourjault introduced the notion of liaison graphs for an assembly representation based on information furnished by part lists and technical drawings [6]. The principle idea behind the liaison graph is to create a tool which permits to represent an assembly in a comprehensive way. Based on this so-called liaison graph, assembly sequences can be generated by determining liaison precedencies. Gupta and Krishnan use liaison graphs for the identification of common components in product families by finding identical parts in different graphs [7]. For De Fazio and Whitney, the liaison graph is the first step to examine an assembly and/or assembly sequence generation by determining which liaisons must be established before and which have to remain after one assembly step [8]. Similarly, Demoly et al. use the liaison graph as starting point for the precedence graph creation, affecting an assembly operation to each liaison [9]. Another approach is presented by Homem de Mello and Sanderson who propose a hypergraph with AND/OR relations to define all different assembly possibilities [10]. For the sequence generation, they propose a complete algorithm which is detailed in [11]. Yu and Li propose an object relationship graph for assembly planning in the domain of electronics. Their method consists in creating a liaison graph with additional information about the type of attachment on the arcs. Afterwards, the graph is transformed into a matrix which helps to identify possible assembly sequences [12].
In conclusion, liaison graphs and comparable graphic representations for sequence generations are comprehensive assembly representations. However, they furnish only quantitative information about component connections and no data about the relation characteristics. Furthermore, all the mentioned methods are only applied either on one specific product or on one family of very similar products. No method for the examination of different product families is described nor is such an application featured by the approaches.
2.2 Cladistics
Having been used in biology already for a long time to classify species, in the domain of engineering this method describes technical feature variation in between one product family putting the emphasis not on its chronological but technical evolution [3]. The cladistics method is used to support the paradigm of delayed product differentiation (DPD). Several case studies are presented by ElMaraghy and AlGeddawy applying cladistics on assembly analysis for the design of assembly lines for DPD. The first study proposes an algorithm for the automatic generation of cladograms which is applied on the analysis of a product family of electric kettles for assembly line design [13]. The second study, conducted analogous to the first one, concerns belt tensioners for car engines [14]. A supplementary application of cladistics to architecture representation of a car body in white was conducted in 2013 by the same authors aiming to identify different granularity levels for product variety management
Author name / Procedia CIRP 00 (2017) 000–000 3
[15]. Another application is the use of cladistics for the determination of an optimal granularity for the choice of production line modules to optimize the system changeability for a given anticipated period [16].
To sum it up, cladistics seem to be adapted for a product family analysis. However, the analysis does not deliver information about all connections between different components and all case studies concern only on product family.
2.3 Datum Flow Chain
The DFC and its applications in industry are presented by Whitney [2]. It represents an evolution of the liaison graphs by adding information about positioning and eliminated degrees of freedom on the arcs. Key characteristics may be added to the graph to identify which component groups serve for the fulfilment of functional requirements [17]. In general, DFC are mainly used for three purposes: Firstly, (i), it is used for the identification of over-, under-, and properly constraint assemblies, like presented by Shukla and Whitney [18] and Demoly [19] who integrated DFC in his PEGASUS software tool. Secondly, (ii), DFC is used for geometrical variation propagation analysis by Jun and Jun for optimized positioning strategies [20], by Marguet and Mathieu in their assembly optimization method [21] and by Falgarone and Chevassus in their software tool GAIA for geometrical variation management [22]. Thirdly, (iii), tolerancing analysis applications of DFC are presented by Mathieu and Marguet using it for tolerance propagation analysis [23], by Hejazi et al. in their 1st order tolerance method for tolerancing schemes and
the development of a tolerance orientation framework [24]. In summary, DFC offer not only quantitative but also qualitative information about an assembly, but it has not often been used for the representation of part and product families and a variation analysis in between these families. One application of DFC on this aspect known to the authors is proposed by Xia [5].
2.4 Summary
In the subsections above, several approaches for assembly representation are presented and evaluated in regard of their capacity to respond to the need for multi-family product analysis and product family identification. In conclusion, it can be stated that none of the described approaches, all of them focusing on the physical product architecture, is capable to furnish a complete product assembly representation model which allows the comparison of products in terms of number and nature of components.
3. Proposed methodology
To overcome difficulties due to variation of component numbers and types, the abstraction level of the new model needs to be increased. The model output is a hybrid functional and physical architecture graph (HyFPAG) representation of
the product aiming to simplify the similarity analysis of complex products and to support their clustering. It regroups components assuring the same function. Firstly, it will be applied to existing products, then, in a next step, it will be used to integrate easily new products in existing families based on their product architecture. Furthermore, the intermediate DFC representation will be reused during the process analysis part.
3.1 General presentation
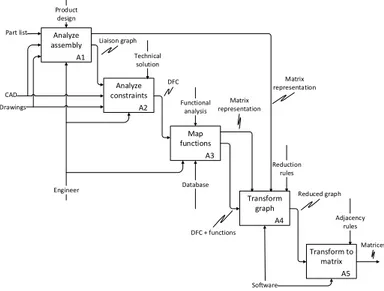
To build the HyFPAG, five analysis steps need to be executed which will be supported by a software:
A1 – Creating the liaison graph (Assembly analysis): The graph is created based on information out of the part list and technical drawings (CAD or paper form).
A2 – Creating the DFC (Constraint and positioning analysis): For each liaison, the constraint information needed for the DFC is added. This step can be executed simultaneously with A1. A3 – Mapping of functional subassemblies: Components are allocated to well defined functions in the DFC.
A4 – Transforming the DFC to a new hybrid graph (HyFPAG) showing the functional and physical architecture: This step is based on the DFC which is transformed following a rule set. A5 – Transforming the graph into matrix for future exploitation: Matrices are deduced from the graphs (liaison graph, DFC, HyFPAG)
These five steps are detailed in the IDEF0 representation in Fig.1. The first two steps contain the application of the well-known liaison graph and DFC methods. Their deployment does not differ from the usual procedure and, for this reason, is not described in detail in this article. The differentiation point is step three, mapping of functional subassemblies.
Fig. 1. IDEF0 representation of the proposed methodology These are added in the DFC representation instead of the standard key characteristic representation. A functional subassembly contains the whole product components which are allocated to one particular function. Whereas a function describes a role which is fulfilled by one element of a group of elements to realize an activity or the destination of a device.
A1 Analyze assembly A2 Analyze constraints A3 Map functions Functional analysis Database A4 Transform graph Reduction rules A5 Transform to matrix Engineer CAD Part list Drawings Software Liaison graph DFC DFC + functions Matrix representation Matrix representation Reduced graph Matrices Technical solution Adjacency rules Product design
research gap, the key question is “How to analyze and model product varieties and how define product families?”. To answer this question and to acquire the described needed knowledge of products, a new modeling method is presented.
This research is part of a PhD project with the global aim to measure and improve the agility of production systems. The presented method contributes to the product analysis part and is a brick of a future integrated methodology and software application. Information out of the product analysis will be joined to process information and serve as input for the production system design and optimization part. Using the existing product as starting point, the method can be partly located in a reverse engineering approach. Referring to the FBS approach, the method is located in the link B ← S, the structure being the product analyzed and the behavior being its technical realization (technical function). The functional level is taken as input parameter for the method but not concerned or modified.
In the following, Section 2 gives a brief literature review on existing modeling approaches representing the structure of an assembly and highlighting the need for an evolution of these approaches. Section 3 presents the proposed new methodology, supported by an illustrative example. In Section 4, this methodology is applied to a first case study and the results are discussed. Finally, Section 5 gives a conclusion and outlines the further work.
2. Literature review
Over the years, several approaches to model an assembly have found their way to industrial application. They are identified by Daniel Whitney as follows [2]:
Part list: most simple model which presents only the different components of an assembly
Bill of materials (BOM): model in form of a segmented, hierarchical list identifying subassemblies and their components
Liaison graph: simple, non-directed graph in which nodes represent components and edges stand for connections between the components
Datum Flow Chain (DFC): directed graph comparable to the liaison graphs in which the direction of the arcs indicates the relative positioning of components and values on the arcs indicate eliminated degrees of freedom.
In addition, a new method based on cladistics was proposed a few years ago [3]. After a pre-evaluation of the different models, part lists and BOM are no further considered in the literature review because both do not furnish information about the relation between components and are therefore not useful for assembly modelling. An evolution of BOM, the generic BOM, was proposed for the representation of product varieties [4]. However, it is still not able to illustrate relations between components [5]. For these reasons, the following review focuses on the evaluation of the most promising approaches which are (i) liaison graphs, (ii) DFC and (iii) cladistics.
2.1 Assembly representation in sequence generation and liaison graphs
In 1984, Bourjault introduced the notion of liaison graphs for an assembly representation based on information furnished by part lists and technical drawings [6]. The principle idea behind the liaison graph is to create a tool which permits to represent an assembly in a comprehensive way. Based on this so-called liaison graph, assembly sequences can be generated by determining liaison precedencies. Gupta and Krishnan use liaison graphs for the identification of common components in product families by finding identical parts in different graphs [7]. For De Fazio and Whitney, the liaison graph is the first step to examine an assembly and/or assembly sequence generation by determining which liaisons must be established before and which have to remain after one assembly step [8]. Similarly, Demoly et al. use the liaison graph as starting point for the precedence graph creation, affecting an assembly operation to each liaison [9]. Another approach is presented by Homem de Mello and Sanderson who propose a hypergraph with AND/OR relations to define all different assembly possibilities [10]. For the sequence generation, they propose a complete algorithm which is detailed in [11]. Yu and Li propose an object relationship graph for assembly planning in the domain of electronics. Their method consists in creating a liaison graph with additional information about the type of attachment on the arcs. Afterwards, the graph is transformed into a matrix which helps to identify possible assembly sequences [12].
In conclusion, liaison graphs and comparable graphic representations for sequence generations are comprehensive assembly representations. However, they furnish only quantitative information about component connections and no data about the relation characteristics. Furthermore, all the mentioned methods are only applied either on one specific product or on one family of very similar products. No method for the examination of different product families is described nor is such an application featured by the approaches.
2.2 Cladistics
Having been used in biology already for a long time to classify species, in the domain of engineering this method describes technical feature variation in between one product family putting the emphasis not on its chronological but technical evolution [3]. The cladistics method is used to support the paradigm of delayed product differentiation (DPD). Several case studies are presented by ElMaraghy and AlGeddawy applying cladistics on assembly analysis for the design of assembly lines for DPD. The first study proposes an algorithm for the automatic generation of cladograms which is applied on the analysis of a product family of electric kettles for assembly line design [13]. The second study, conducted analogous to the first one, concerns belt tensioners for car engines [14]. A supplementary application of cladistics to architecture representation of a car body in white was conducted in 2013 by the same authors aiming to identify different granularity levels for product variety management
[15]. Another application is the use of cladistics for the determination of an optimal granularity for the choice of production line modules to optimize the system changeability for a given anticipated period [16].
To sum it up, cladistics seem to be adapted for a product family analysis. However, the analysis does not deliver information about all connections between different components and all case studies concern only on product family.
2.3 Datum Flow Chain
The DFC and its applications in industry are presented by Whitney [2]. It represents an evolution of the liaison graphs by adding information about positioning and eliminated degrees of freedom on the arcs. Key characteristics may be added to the graph to identify which component groups serve for the fulfilment of functional requirements [17]. In general, DFC are mainly used for three purposes: Firstly, (i), it is used for the identification of over-, under-, and properly constraint assemblies, like presented by Shukla and Whitney [18] and Demoly [19] who integrated DFC in his PEGASUS software tool. Secondly, (ii), DFC is used for geometrical variation propagation analysis by Jun and Jun for optimized positioning strategies [20], by Marguet and Mathieu in their assembly optimization method [21] and by Falgarone and Chevassus in their software tool GAIA for geometrical variation management [22]. Thirdly, (iii), tolerancing analysis applications of DFC are presented by Mathieu and Marguet using it for tolerance propagation analysis [23], by Hejazi et al. in their 1st order tolerance method for tolerancing schemes and
the development of a tolerance orientation framework [24]. In summary, DFC offer not only quantitative but also qualitative information about an assembly, but it has not often been used for the representation of part and product families and a variation analysis in between these families. One application of DFC on this aspect known to the authors is proposed by Xia [5].
2.4 Summary
In the subsections above, several approaches for assembly representation are presented and evaluated in regard of their capacity to respond to the need for multi-family product analysis and product family identification. In conclusion, it can be stated that none of the described approaches, all of them focusing on the physical product architecture, is capable to furnish a complete product assembly representation model which allows the comparison of products in terms of number and nature of components.
3. Proposed methodology
To overcome difficulties due to variation of component numbers and types, the abstraction level of the new model needs to be increased. The model output is a hybrid functional and physical architecture graph (HyFPAG) representation of
the product aiming to simplify the similarity analysis of complex products and to support their clustering. It regroups components assuring the same function. Firstly, it will be applied to existing products, then, in a next step, it will be used to integrate easily new products in existing families based on their product architecture. Furthermore, the intermediate DFC representation will be reused during the process analysis part.
3.1 General presentation
To build the HyFPAG, five analysis steps need to be executed which will be supported by a software:
A1 – Creating the liaison graph (Assembly analysis): The graph is created based on information out of the part list and technical drawings (CAD or paper form).
A2 – Creating the DFC (Constraint and positioning analysis): For each liaison, the constraint information needed for the DFC is added. This step can be executed simultaneously with A1. A3 – Mapping of functional subassemblies: Components are allocated to well defined functions in the DFC.
A4 – Transforming the DFC to a new hybrid graph (HyFPAG) showing the functional and physical architecture: This step is based on the DFC which is transformed following a rule set. A5 – Transforming the graph into matrix for future exploitation: Matrices are deduced from the graphs (liaison graph, DFC, HyFPAG)
These five steps are detailed in the IDEF0 representation in Fig.1. The first two steps contain the application of the well-known liaison graph and DFC methods. Their deployment does not differ from the usual procedure and, for this reason, is not described in detail in this article. The differentiation point is step three, mapping of functional subassemblies.
Fig. 1. IDEF0 representation of the proposed methodology These are added in the DFC representation instead of the standard key characteristic representation. A functional subassembly contains the whole product components which are allocated to one particular function. Whereas a function describes a role which is fulfilled by one element of a group of elements to realize an activity or the destination of a device.
A1 Analyze assembly A2 Analyze constraints A3 Map functions Functional analysis Database A4 Transform graph Reduction rules A5 Transform to matrix Engineer CAD Part list Drawings Software Liaison graph DFC DFC + functions Matrix representation Matrix representation Reduced graph Matrices Technical solution Adjacency rules Product design
50 Paul Stief et al. / Procedia CIRP 70 (2018) 47–52
4 Author name / Procedia CIRP 00 (2018) 000–000
= 1 0 ∀ , ∈ ℕ The different identified functional subassemblies are in relation to each other based on the physical relations of the components which are composing them. The DFC graph with mapped functional subassemblies can be transformed into a matrix illustrating the attachment of components to functional subassemblies. For this, the lines of the matrix are representing the functional subassemblies and the columns stand for the components. This matrix is called F and defined according to equation (1).
(1)
Applying the Rank Order Clustering Algorithm (ROC), the entries of the matrix are ordered in way that the relations between the different functional subassemblies are highlighted. Five different relations are possible. For each of the first four, a distinct representation is defined to express them in the hybrid functional and physical architecture graph (HyFPAG): Identity: At least two functional subassemblies contain the
same components. It is represented by a shared node. Inclusion: A functional subassembly is included in another
one, i.e. the components of one functional subassembly are a subset of the components of another one. It is represented by an aggregation link analogous to an UML aggregation. Partition: Two functional subassemblies share some (not all)
components. It is represented by a dotted line.
Contact: Two functional subassemblies are linked by a simple DFC mate relation between their components. It is represented by a single or bidirectional arc.
Separation: If there exist none of the above-mentioned relations between two functional subassemblies.
The above-mentioned relations do not have an equal priority, rather there is a hierarchy which impacts the manner how the HyFPAG is built. The following figure shows the relations hierarchy. In the HyFPAG, strong relations must be established before weak relations and primary relations are established before secondary relations.
Fig. 2. Relations hierarchy in the HyFPAG
The relation matrix GF for the HyFPAG is defined according to equation (2). This matrix GF eases the similarity comparison of products attached to different product families.
(2) In the following subsection, the example of a nail clipper illustrates the application of the methodology. For this, the different steps defined before (A1-A5) are reminded. The example is inspired by the nail clipper example used in [25].
3.2 Exemplary application on a nail clipper
The nail clipper and its functions are illustrated in Fig. 3. The components are numbered from one to four and five functions are identified and named a to e. It represents the input for A1. Their belonging functional subassemblies are named with the same letter written in capital letters.
Fig. 3. Nail clipper with part list and functions [25]
The related liaison graph is illustrated in Fig. 4a, the DFC with mapped functional subassemblies is detailed in Fig. 4b. This information will be added during the steps A1 to A3. The related matrix FNC, already arranged with the ROC algorithm,
is shown in equation (3) below.
Fig. 4. (a) Liaison graph; (b) DFC with functional subassemblies The matrix lines stand in decreasing order for the functional subassemblies B, A, C, D and E and are filled according to equation (1). The columns stand for the components 1, 2, 3 and 4 (from left to right). It can be seen easily that two times two functional subassemblies are identic (groups A&C and E&D) and that two others share one component (groups AC&B, component 2). Now, the HyFPAG can be created (A4).
(3) The graph shows two identities (Fig. 5.), two relations of the type “contact” and one relation of the type “partition”. In step A5, the matrix GFNC is created. The entriesgfi1 represent the
relation from B to AC and DE, gfi2 the relation from AC to B
and DE and gfi3 the relations form DE to B and AC.
Fig. 5. HyFPAG of the nail clipper with adjacency matrix
As additional feature, (un)coupling of functional subassemblies is highlighted by the HyFPAG representation.
1 0 0 0 1 0 0 0 0 1 1 0 0 1 1 0 0 0 1 1 FNC ij i j f f f f F L M O M L 1 1 11 ij i j gf gf gf gf GF L M O M L 1 1 11 = 3 −3 2 1 −1 0 ∀ , ∈ ℕ D E A C B
Primary relations Secondary relations
Contact
Strong relations
Inclusion / Identity Weak relationsPartition
Reduced graph 1 2 3 4 5 4 6 4 B) A) C) D) E) 1 2 3 4 2 1 4 3 5 a b
Author name / Procedia CIRP 00 (2017) 000–000 5
In the nail clipper example, all of them are coupled. Uncoupled groups are identified if a node has only entering “contact” relations, which means that this functional subassembly can be dissociated from the others without impacting them.
4. Case study
In this section, the above described methodology is applied on a case study conducted in cooperation with thyssenkrupp Presta France. Two steering columns which are related to two different product families are analyzed, then compared. The first one, here called “column 1”, is a sophisticated mechanical column permitting height and length adjustment and possessing comfort components. The second one, here called “column 2”, is a basic mechanical column which permits only a height adjustment not possessing any comfort components. The former one is composed of 59 components fulfilling 25 different sub-functions. The latter one consists of 22 components fulfilling 19 sub-functions. The two steering columns are illustrated by the figure below.
Fig. 6. thyssenkrupp Presta France column 1 (left) and column 2 (right); For reasons of confidentiality, from the liaison graphs, DFC, reduced graphs and the matrices F of the two columns, only the DFC and reduced graph of column 1 are shown in this article (Fig. 7.) and the labels have been removed.
Fig. 7. DFC and HyFPAG of column 1
The reduction of the number of nodes and links in the HyFPAG compared to the DFC is obvious. In this case, the number of nodes is reduced from 59 to 22 and the number of links is reduced from 97 to 42. The corresponding relation matrix GFcolumn1 and the relation matrix GFcolumn2 for column
2 are illustrated in Fig. 8. The boxes show a zoomed extract for better a readability.
These matrices represent the HyFPAG of the two steering columns. Empty columns in both matrices were deleted to improve the readability and family identification. To compare them, both matrices are analyzed in regard of which functional subassemblies are connected.
Fig. 8. Matrix GFcolumn1 (a) and Matrix GFcolumn2 (b)
A link between two functional subassemblies existing in both matrices, is marked with an X and grey cases in the similarity analysis matrix. Fig. 9 shows the result of the similarity analysis. The matrix represents the synthesis of the two GF matrices.
Fig. 9. First glance of a similarity analysis
In result of the comparison, in total 39 links between functional subassemblies are identified existing in both columns. This means for column 1 that around 40% of the links (39 links of 98) exist as well in the functional architecture of column 2. For column 2, 59% of its links (39 links of 66) exist in the functional architecture of column 1. These numbers give a first idea of the similarity degree of these two columns. More columns could be added to the comparison method to identify common functional links analyzing a larger product range.
The presented approach showed its capacity to model two product families represented by two products on the level of their functional structure. Two main achievements are realized: Firstly, this case study proves that it is possible to transform a physical assembly representation into a hybrid structure representation. Secondly, it has proven that the HyFPAG enables and eases the comparison of two different products which are attached to different product families and which differ in terms of number and nature of their components. The aim to propose a method which overcomes the difficulties of comparing products with a large component variety may be regarded as achieved, proven by the case study.
6 23 fct. Sub-assembly FSA 1 FSA 2 FSA 3 FSA 4 5FSA FSA 6 FSA 7 8FSA FSA 9 FSA 10 11A FS FSA 12 FSA 13 FS14A FSA 15 FSA 16 17FSA FSA 18 FSA 19 FSA 20 FSA 21 FSA 22 FSA 1 X X X FSA 2 X X FSA 3 FSA 4 X X FSA 5 FSA 6 FSA 7 X X FSA 8 X X X FSA 9 FSA 10 FSA 11 X X X X FSA 12 X X X X FSA 13 X X FSA 14 X X FSA 15 FSA 16 X X FSA 17 X X X X X FSA 18 X X X X FSA 19 X FSA 20 X X FSA 21 X X FSA 22 X X (a) (b)
= 1 0 ∀ , ∈ ℕ The different identified functional subassemblies are in relation to each other based on the physical relations of the components which are composing them. The DFC graph with mapped functional subassemblies can be transformed into a matrix illustrating the attachment of components to functional subassemblies. For this, the lines of the matrix are representing the functional subassemblies and the columns stand for the components. This matrix is called F and defined according to equation (1).
(1)
Applying the Rank Order Clustering Algorithm (ROC), the entries of the matrix are ordered in way that the relations between the different functional subassemblies are highlighted. Five different relations are possible. For each of the first four, a distinct representation is defined to express them in the hybrid functional and physical architecture graph (HyFPAG): Identity: At least two functional subassemblies contain the
same components. It is represented by a shared node. Inclusion: A functional subassembly is included in another
one, i.e. the components of one functional subassembly are a subset of the components of another one. It is represented by an aggregation link analogous to an UML aggregation. Partition: Two functional subassemblies share some (not all)
components. It is represented by a dotted line.
Contact: Two functional subassemblies are linked by a simple DFC mate relation between their components. It is represented by a single or bidirectional arc.
Separation: If there exist none of the above-mentioned relations between two functional subassemblies.
The above-mentioned relations do not have an equal priority, rather there is a hierarchy which impacts the manner how the HyFPAG is built. The following figure shows the relations hierarchy. In the HyFPAG, strong relations must be established before weak relations and primary relations are established before secondary relations.
Fig. 2. Relations hierarchy in the HyFPAG
The relation matrix GF for the HyFPAG is defined according to equation (2). This matrix GF eases the similarity comparison of products attached to different product families.
(2) In the following subsection, the example of a nail clipper illustrates the application of the methodology. For this, the different steps defined before (A1-A5) are reminded. The example is inspired by the nail clipper example used in [25].
3.2 Exemplary application on a nail clipper
The nail clipper and its functions are illustrated in Fig. 3. The components are numbered from one to four and five functions are identified and named a to e. It represents the input for A1. Their belonging functional subassemblies are named with the same letter written in capital letters.
Fig. 3. Nail clipper with part list and functions [25]
The related liaison graph is illustrated in Fig. 4a, the DFC with mapped functional subassemblies is detailed in Fig. 4b. This information will be added during the steps A1 to A3. The related matrix FNC, already arranged with the ROC algorithm,
is shown in equation (3) below.
Fig. 4. (a) Liaison graph; (b) DFC with functional subassemblies The matrix lines stand in decreasing order for the functional subassemblies B, A, C, D and E and are filled according to equation (1). The columns stand for the components 1, 2, 3 and 4 (from left to right). It can be seen easily that two times two functional subassemblies are identic (groups A&C and E&D) and that two others share one component (groups AC&B, component 2). Now, the HyFPAG can be created (A4).
(3) The graph shows two identities (Fig. 5.), two relations of the type “contact” and one relation of the type “partition”. In step A5, the matrix GFNC is created. The entriesgfi1 represent the
relation from B to AC and DE, gfi2 the relation from AC to B
and DE and gfi3 the relations form DE to B and AC.
Fig. 5. HyFPAG of the nail clipper with adjacency matrix
As additional feature, (un)coupling of functional subassemblies is highlighted by the HyFPAG representation.
1 0 0 0 1 0 0 0 0 1 1 0 0 1 1 0 0 0 1 1 FNC ij i j f f f f F L M O M L 1 1 11 ij i j gf gf gf gf GF L M O M L 1 1 11 = 3 −3 2 1 −1 0 ∀ , ∈ ℕ D E A C B
Primary relations Secondary relations
Contact
Strong relations
Inclusion / Identity Weak relationsPartition
Reduced graph 1 2 3 4 5 4 6 4 B) A) C) D) E) 1 2 3 4 2 1 4 3 5 a b
In the nail clipper example, all of them are coupled. Uncoupled groups are identified if a node has only entering “contact” relations, which means that this functional subassembly can be dissociated from the others without impacting them.
4. Case study
In this section, the above described methodology is applied on a case study conducted in cooperation with thyssenkrupp Presta France. Two steering columns which are related to two different product families are analyzed, then compared. The first one, here called “column 1”, is a sophisticated mechanical column permitting height and length adjustment and possessing comfort components. The second one, here called “column 2”, is a basic mechanical column which permits only a height adjustment not possessing any comfort components. The former one is composed of 59 components fulfilling 25 different sub-functions. The latter one consists of 22 components fulfilling 19 sub-functions. The two steering columns are illustrated by the figure below.
Fig. 6. thyssenkrupp Presta France column 1 (left) and column 2 (right); For reasons of confidentiality, from the liaison graphs, DFC, reduced graphs and the matrices F of the two columns, only the DFC and reduced graph of column 1 are shown in this article (Fig. 7.) and the labels have been removed.
Fig. 7. DFC and HyFPAG of column 1
The reduction of the number of nodes and links in the HyFPAG compared to the DFC is obvious. In this case, the number of nodes is reduced from 59 to 22 and the number of links is reduced from 97 to 42. The corresponding relation matrix GFcolumn1 and the relation matrix GFcolumn2 for column
2 are illustrated in Fig. 8. The boxes show a zoomed extract for better a readability.
These matrices represent the HyFPAG of the two steering columns. Empty columns in both matrices were deleted to improve the readability and family identification. To compare them, both matrices are analyzed in regard of which functional subassemblies are connected.
Fig. 8. Matrix GFcolumn1 (a) and Matrix GFcolumn2 (b)
A link between two functional subassemblies existing in both matrices, is marked with an X and grey cases in the similarity analysis matrix. Fig. 9 shows the result of the similarity analysis. The matrix represents the synthesis of the two GF matrices.
Fig. 9. First glance of a similarity analysis
In result of the comparison, in total 39 links between functional subassemblies are identified existing in both columns. This means for column 1 that around 40% of the links (39 links of 98) exist as well in the functional architecture of column 2. For column 2, 59% of its links (39 links of 66) exist in the functional architecture of column 1. These numbers give a first idea of the similarity degree of these two columns. More columns could be added to the comparison method to identify common functional links analyzing a larger product range.
The presented approach showed its capacity to model two product families represented by two products on the level of their functional structure. Two main achievements are realized: Firstly, this case study proves that it is possible to transform a physical assembly representation into a hybrid structure representation. Secondly, it has proven that the HyFPAG enables and eases the comparison of two different products which are attached to different product families and which differ in terms of number and nature of their components. The aim to propose a method which overcomes the difficulties of comparing products with a large component variety may be regarded as achieved, proven by the case study.
6 23 fct. Sub-assembly FSA 1 FSA 2 FSA 3 FSA 4 5FSA FSA 6 FSA 7 8FSA FSA 9 FSA 10 11A FS FSA 12 FSA 13 FS14A FSA 15 FSA 16 17FSA FSA 18 FSA 19 FSA 20 FSA 21 FSA 22 FSA 1 X X X FSA 2 X X FSA 3 FSA 4 X X FSA 5 FSA 6 FSA 7 X X FSA 8 X X X FSA 9 FSA 10 FSA 11 X X X X FSA 12 X X X X FSA 13 X X FSA 14 X X FSA 15 FSA 16 X X FSA 17 X X X X X FSA 18 X X X X FSA 19 X FSA 20 X X FSA 21 X X FSA 22 X X (a) (b)
52 Paul Stief et al. / Procedia CIRP 70 (2018) 47–52
6 Author name / Procedia CIRP 00 (2018) 000–000
5. Conclusion and perspectives
In a globalized world with volatile market condition, industrial enterprises are facing various challenges, among others a continuous tendency to more personalization. This tendency is the motor which forces them to develop more product varieties which impacts strongly the need to define new product families. A development imposing new challenges on the production system: the production lines will have to face a product mix with small lot sizes and different product families. Treating these families requires their modelling and analysis permitting the identification of commonalities beyond the frontier of specific product families. Based on commonalities, a new clustering could be proposed.
The literature review underlined that a lot of work has been done on the modelling of physical product structures. One shortcoming of these methods is that they are dedicated only to one product or one existing product family. In addition, in some cases, weak degree of qualitative information is furnished by the mostly quantitative approaches. This research gap is aimed to be closed by the proposed methodology for product family modelling, analysis and comparison. A hybrid functional and physical product model is proposed to overcome the difficulties related to variety analysis only on a physical level.
The new methodology is based on DFC as a starting point. By the definition of functional subassemblies in a second step, the physical representation can be transformed into a functional structure representation with the advantage that this model is always the same without being influenced by number and type of the product’s components. It is this equality which makes a similarity analysis possible. Based on this analysis, design recommendations for assembly optimized design can be made. The novel approach is explained with the example of a nail-clipper and successfully applied on an industrial case study of two steering columns from thyssenkrupp Presta France.
Future work will be done concerning the automation of graph generation and treatment as well as their mathematical representations to ease the approach and decrease the impact of human related input errors. In addition, the similarity analysis which is presented in a straightforward way in this article will evolve and will be automated. The product model will be enriched with assembly technology information to be able to support assembly process analysis and optimization.
Acknowledgements
The authors gratefully acknowledge the support by thyssenkrupp Presta France, member of the research cluster about humans in the center of reconfigurable, safe, and efficient production systems, co-founded by the European Regional Development Fund FEDER.
References
[1] Shirinzadeh B. Flexible fixturing for workpiece positioning and constraining. Assembly Automation. 2002;22:112–20.
[2] Whitney DE. Mechanical Assemblies: Their Design, Manufacture, and Role in Product Development. N Y, Oxford: Oxford Univ. Press; 2004.
[3] ElMaraghy HA, AlGeddawy T, Azab A. Modelling evolution in manufacturing: A biological analogy. CIRP Annals - Manufacturing Technology. 2008;57:467–72.
[4] Hu SJ, Ko J, Weyand L, ElMaraghy HA, Lien TK, Koren Y, et al. Assembly system design and operations for product variety. CIRP Annals - Manufacturing Technology. 2011;60:715–33.
[5] Xia Q, Etienne A, Dantan J-Y, Siadat A. Reconfigurable machining process planning for part variety in new manufacturing paradigms: Definitions, models and framework. CAIE. 2018;115:206–19.
[6] Bourjault A. Contribution à une approche méthodologique de l'assemblage automatisé: Elaboration automatique des séquences opératoires [PhD Thesis]. Besançon: Université de Franche-Comté; 1984.
[7] Gupta S, Krishnan V. Product family-based assembly sequence design methodology. IIE Transactions. 1998;30:933–45.
[8] Fazio TL De, Whitney DE. Simplified generation of all mechanical assembly sequences. IEEE J. Robot. Automat. 1987;3:640–58.
[9] Demoly F, Yan X-T, Eynard B, Rivest L, Gomes S. An assembly oriented design framework for product structure engineering and assembly sequence planning. Robotics and Computer-Integrated Manuf. 2011;27:33–46. [10] Homem de Mello LS, Sanderson AC. AND/OR graph representation of
assembly plans. IEEE Trans. Robot. Automat. 1990;6:188–99.
[11] Homem de Mello LS, Sanderson AC. A correct and complete algorithm for the generation of mechanical assembly sequences. IEEE Trans. Robot. Automat. 1991;7:228–40.
[12] Yu J-C, Li Y-M. The structure representation for the concurrent analysis of product assembly and disassembly. Proceedings of the IEEE 9th International Conference on Computer Supported Cooperative Work in Design. 2005;2:893-898.
[13] AlGeddawy T, ElMaraghy HA. Assembly systems layout design model for delayed products differentiation. Int J Prod Res. 2010;48:5281–305. [14] AlGeddawy T, ElMaraghy HA. Design of single assembly line for the
delayed differentiation of product variants. Flex Serv Manuf J. 2010;22:163–82.
[15] AlGeddawy T, ElMaraghy HA. Determining Granularity Level in Product Design Architecture. In: Abramovici M, Stark R, editors. Smart Product Engineering. Berlin, Heidelberg: Springer; 2013. p. 535–542.
[16] AlGeddawy T, ElMaraghy HA. Determining Granularity of Changeable Manufacturing Systems Using Changeable Design Structure Matrix and Cladistics. J Mech Des N Y. 2015;137:041702-1-041702-12.
[17] Onori M, Whitney DE. The role of key characteristics in the design of mechanical assemblies. Assembly Automation. 2006;26:315–22. [18] Shukla G, Whitney DE. Systematic evaluation of constraint properties of
datum flow chain. Proceedings of the IEEE International Symposium on Assembly and Task Planning. 2001:337–43.
[19] Demoly F. Conception intégrée et gestion d'informations techniques: application à l'ingénierie du produit et de sa séquence d'assemblage [PhD thesis]. Belfort: Université de Technologie de Belfort-Montbéliard - UTBM; 2010.
[20] Jun S, Jun C. Systematic Optimization of Concurrent Design of Product and Locating Strategy by Datum Flow Chain. In: Proceedings of the FISITA 2012 World Automotive Congress. Berlin, Heidelberg: Springer Berlin Heidelberg; Springer; 2013. p. 79–85.
[21] Marguet B, Mathieu L. Method for Geometric Variation Management from Key Characteristics to Specification. In: Bourdet P, Mathieu L, editors. Geometric Product Specification and Verification : Integration of Functionality. Dordrecht: Springer Netherlands; 2003. p. 217–226. [22] Falgarone H, Chevassus N. Structural and Functional Analysis for
Assembly. In: ElMaraghy HA, ElMaraghy WH, editors. Advances in Design. London: Springer-Verlag London Limited; 2006.
[23] Mathieu L, Marguet B. Integrated Design Method to Improve Producibility based on Product Key Characteristics and Assembly Sequences. CIRP Annals - Manufacturing Technology. 2001;50:85–8. [24] Hejazi SM, Biswas D, Venkiteswaran A, Shah JJ, Davidson JK.
Automated 1st Order Tolerancing: Schema Generation. Proceedings of the ASME 2016 International Design Engineering Technical Conferences and Information in Engineering Conference. 2016:1–14.
[25] Ulrich KT, Seering WP. Function sharing in mechanical design. Design Studies. 1990;11:223–34.