UNIVERSITÉ DE MONTRÉAL
CYCLING NETWORK DISCONTINUITIES AND THEIR EFFECTS ON CYCLIST BEHAVIOUR AND SAFETY
MATIN ALSADAT NABAVI NIAKI
DÉPARTEMENT DES GÉNIES CIVIL, GÉOLOGIQUE ET DES MINES ÉCOLE POLYTECHNIQUE DE MONTRÉAL
THЀSE PRÉSENTÉE EN VUE DE L’OBTENTION DU DIPLÔME DE PHILOSOPIAE DOCTOR
(GÉNIE CIVIL) AOÛT 2018
UNIVERSITÉ DE MONTRÉAL
ÉCOLE POLYTECHNIQUE DE MONTRÉAL
Cette thèse intitulée :
CYCLING NETWORK DISCONTINUITIES AND THEIR EFFECTS ON CYCLIST BEHAVIOUR AND SAFETY
présentée par : NABAVI NIAKI Matin Alsadat
en vue de l’obtention du diplôme de : Philosophiae Doctor a été dûment acceptée par le jury d’examen constitué de :
Mme MORENCY Catherine, Ph. D., présidente
M. SAUNIER Nicolas, Ph. D., membre et directeur de recherche
M. MIRANDA-MORENO Luis, Ph. D., membre et codirecteur de recherche M. WAYGOOD Owen, Ph. D., membre
ACKNOWLEDGEMENTS
My work leading to the completion of this dissertation would have been insignificant without the intellectual efforts and moral support of my supervisors and friends. My deepest gratitude goes to my supervisors Dr. Nicolas Saunier, and Dr. Luis Miranda-Moreno for their patience and guidance. My persistent questions and showing up at their office were always rewarded with insightful responses and constructive feedback. I am very lucky to have worked with these remarkable researchers and mentors. Through an international doctoral exchange, I had the fortune of working with Dr. Aliaksei Laureshyn at Lund University, Sweden. The experience was inspiring and memorable.
I would like to thank the Fonds de recherche du Québec - Nature et technologies (FRQNT) grant 2015-NC-180344 and the National Science and Research Council (NSERC), grant 2017-06115 for their financial support, as well as the City of Montréal and boroughs that authorized the data collection. Special thanks to Anae Sobhani, Sohail Zangenehpour, Asad Lesani and Ting Fu for helping me with the early morning data collections.
RESUME
Le cyclisme est généralement considéré comme le mode de transport le plus dangereux, car les collisions avec des véhicules sont plus susceptibles de provoquer des blessures graves et même la mort que les autres usagers de la route à l’exception des piétons. Compte tenu de ses nombreux avantages environnementaux et sociaux, les villes encouragent le cyclisme en tant que mode de transport abordable et développent leur infrastructure cyclable. Alors que les villes visent à augmenter la part modale du vélo, les statistiques de sécurité alarmantes ont forcé les chercheurs et planificateurs des transports ainsi que les responsables municipaux et les décideurs à investir dans la conception, la mise en œuvre et l’amélioration du réseau cyclable afin d’accueillir les cyclistes en toute sécurité. L'amélioration du réseau cyclable pour accroître la part modale du vélo et la sécurité repose sur des informations quantitatives détaillées et des indicateurs de performance. L’une des dimensions de l’analyse du réseau cyclable est sa continuité. La continuité du réseau fournit un ensemble de routes possibles qui sont connectées et accessibles à tous les utilisateurs de la route. Toutefois, les réseaux cyclables sont généralement ajoutés au réseau routier existant, ce qui crée des endroits avec des changements dans les caractéristiques du réseau cyclable et routier. Ces changements sont des interruptions du réseau cyclable qui causent les discontinuités. Malgré les nombreuses mesures sur l'infrastructure, la circulation et l'environnement étudiées dans la littérature du cyclisme, la définition et l'adoption systématiques des discontinuités des réseaux cyclables ont été négligées.
Dans cette dissertation, quatre lacunes ont été identifiées dans la littérature sur le comportement et la sécurité des cyclistes ainsi que sur la performance des réseaux cyclables: la définition et présentation des indicateurs de discontinuité des réseaux cyclables, les effets des discontinuités d'éclairage routier sur la sécurité des cyclistes de nuit, l’analyse du comportement et de la sécurité des cyclistes à des sites avec des discontinuités du réseau cyclable. Pour combler la première lacune, différentes catégories de mesures de discontinuité sont proposées et définies lorsqu’il y a 1) des changements intrinsèques dans le réseau cyclable (fin du réseau cyclable, changement de type d’aménagement cyclable, changement de la largeur des aménagements cyclables, changement de l'emplacement de l’aménagement cyclable sur la route, changement de l'état de la chaussée, changement de l'éclairage routier, changement de la pente de la route, fermeture/détour des réseaux cyclables en raison de travaux), 2) des changements des caractéristiques du réseau routier
(changement de classe, changement du nombre de voies, carrefours) et de la circulation (changement du débit de la circulation, changement de la vitesse de la circulation) et 3) autres changements (entrées de garage, arrêts de bus, stationnement autorisé sur la route). De plus, une méthodologie automatisée est proposée qui peut être appliquée à n'importe quelle zone avec des données de réseau cyclable géoréférencées pour identifier et quantifier les discontinuités infrastructurelles le long du réseau cyclable. La méthodologie est appliquée à une étude de cas de quatre villes nord-américaines, afin de comparer leurs niveaux de discontinuité de manière uniforme et systématique. Les villes étudiées sont classées en fonction de deux indicateurs de discontinuité du réseau cyclable, de la pire à la meilleure, à savoir Portland, Vancouver, Washington D.C. et Montréal.
Pour combler la deuxième lacune de recherche, une méthodologie est proposée pour effectuer un audit nocturne de l'éclairage routier en collectant des mesures de luminosité sur les routes et aux carrefours afin d'identifier les emplacements avec un éclairage discontinu. Les études antérieures utilisant des mesures d'éclairage reposaient sur des méthodes incohérentes et compliquées pour la collecte de données. La méthodologie proposée dans cette thèse fournit une méthodologie uniforme qui peut être appliquée à n'importe quel site pour collecter des données d'éclairage nocturne. La méthodologie est appliquée à Montréal et une analyse statistique des données historiques des accidents montre que les emplacements avec des niveaux d'éclairage plus élevés augmentent le risque d'accident cycliste grave la nuit.
La troisième lacune de recherche abordée dans la thèse est l'analyse du comportement des cyclistes à des endroits où il existe une discontinuité du réseau cyclable. En adoptant la méthodologie proposée, deux paires de sites, un site avec discontinuité et un site de contrôle, sont sélectionnées à Montréal. L’analyse approfondie du comportement des cyclistes nécessite de grandes quantités de données microscopiques, c’est-à-dire des trajectoires des usagers de la route à une échelle temporelle fine. À cette fin, des techniques de vision par ordinateur et des méthodes de regroupement de trajectoires sont appliquées aux données vidéo. Ainsi, un outil d'analyse vidéo automatisé est adopté pour extraire les trajectoires des usagers de la route et grouper les trajectoires cyclistes similaires pour comparer les mouvements des cyclistes traversant les discontinuités du réseau cyclable comparées à leursaux sites de contrôle respectifs. La méthode fournit des informations microscopiques précieuses sur les mouvements des cyclistes qui peuvent être
appliquées à n'importe quel site pour évaluer le comportement des cyclistes. Les résultats de cette étude indiquent une plus grande variation du nombre de manœuvres et des vitesses des cyclistes aux endroits du réseau cyclable avec discontinuité par rapport aux sites de contrôle. Enfin, les implications sur la sécurité des cyclistes aux sites avec discontinuité sont étudiées en utilisant des mesures substituts de la sécurité (MSdS) en adoptant une méthode probabiliste (PMSdS) pour prédire les positions futures des usagers de la route. Les deux paires de sites de discontinuité et de contrôle de Montréal sont encore analysées dans une étude de cas. De plus, les temps de collision sont calculés pour les interactions cycliste-véhicule et résumés par manœuvre cycliste pour identifier les manœuvres spécifiques à risque aux sites avec discontinuités. Cette nouvelle approche basée sur les mouvements n'a pas été utilisée dans la littérature pour l'analyse de la sécurité des manœuvres cyclistes. Cette approche fournit un outil utile pour identifier les mouvements exacts importants pour la sécurité des cyclistes. Les résultats montrent que les sites avec discontinuités présentent un plus grand nombre de mouvement dangereux des cyclistes comparé aux sites de contrôle. Au site avec discontinuité où l'emplacement de la piste cyclable change d'un côté de la route à un autre, les cyclistes qui commencent et finissent dans l'aménagement cyclable aux extrémités opposées du carrefour ont les temps à la collision les plus bas.
En résumé, cette thèse comble les lacunes de la littérature en définissant et proposant des indicateurs de discontinuité du réseau cyclable et en évaluant leurs effets sur la performance du réseau cyclable, le comportement et la sécurité des cyclistes. Les résultats de toutes les études de cette thèse confirment l'importance d'inclure des indicateurs de discontinuité dans la planification et l'évaluation des réseaux cyclables. L'absence de ces indicateurs dans les étapes actuelles de planification et d'évaluation fournit une image partielle de la qualité d'un réseau et de l'expérience cycliste et laisse les agences de transport incapables de bien traiter les effets des discontinuités sur les cyclistes. Les informations obtenues grâce aux études sur le comportement et la sécurité des cyclistes aideront les planificateurs et les responsables municipaux à prendre des décisions plus éclairées et à améliorer la conception des points de discontinuité dans les réseaux cyclables afin d'éliminer les mouvements dangereux et d'accommoder tous les cyclistes en sécurité.
ABSTRACT
Cycling is widely considered to be the riskiest mode of transport since collisions with vehicles are more likely to result in serious injuries or even death than other road users except pedestrians. Given its many environmental and social benefits, cities are encouraging cycling as an affordable mode of transport and are expanding their cycling infrastructure. While cities are aiming to increase cycling mode share, their alarming safety statistics have compelled transportation researchers and planners as well as city officials and decision makers to invest resources in designing, implementing and improving the cycling network to safely accommodate cyclists. Improving the cycling network to increase cycling mode share and safety relies on detailed quantitative information on performance indicators. One of the dimensions of cycling network analysis is its continuity. Network continuity provides a set of possible routes that are connected and accessible to all road users. However, cycling networks are usually implemented on the already existing road network, which results in locations where there are changes in road and cycling network characteristics. These changes are interruptions in the cycling network, also referred to as discontinuities. Despite the many infrastructural, traffic and environmental measures studied in cycling literature, the systematic definition of cycling network discontinuities has been overlooked. In this dissertation, four research gaps have been identified in cyclist behaviour and safety literature as well as cycling network performance studies: the definition and presentation of cycling network discontinuity indicators, the effects of road lighting discontinuities on nighttime cyclist safety, the cyclist behaviour and safety analysis at discontinuity locations in the cycling network. To address the first gap, different categories of discontinuity measures are proposed and defined, where there are 1) intrinsic changes in the cycling network (end of cycling facility, change in cycling facility type, change in cycling facility width, change in cycling facility location on road, change in pavement condition, change in road lighting, change in road grade, closure/rerouting of cycling facility due to construction or maintenance), 2) changes to the road network (change in road class, change in number of road lanes, intersections) and traffic characteristics (change in traffic volume, change in traffic speed), and 3) other changes (driveways, bus stops, parking allowed on road). Moreover, an automated methodology is proposed that can be applied to any area using its georeferenced cycling network data to identify and quantify infrastructural discontinuities along the cycling network. The methodology is applied to a case study of four North American cities, to compare their discontinuity levels in a uniform and systematic way. The areas under study are
ranked based on two cycling network discontinuity indicators from worst to best as: Portland, Vancouver, Washington D.C., and Montréal.
To close the second research gap, a methodology is proposed to perform a nighttime road lighting audit collecting illuminance measurements at an intersection or link level to identify locations with discontinuous lighting. Past studies using illuminance measurements relied on inconsistent and cumbersome methods for collecting data. The proposed methodology in this dissertation provides a uniform methodology that can be applied to any area to collect nighttime illuminance data. The methodology is applied to case study locations in Montréal and a statistical analysis of historical accident data showed that locations with higher illuminance levels are associated with an increase in the chance of a severe cyclist accident at nighttime.
The third research gap addressed in the dissertation is the analysis of cyclist behaviour at locations where there is a cycling network discontinuity. Adopting the proposed methodology, two pairs of discontinuity and control sites are selected in Montréal. The in-depth analysis of cyclist behaviour requires large amounts of microscopic data, i.e. road user trajectories at a fine temporal scale. To this end, computer vision techniques and trajectory clustering methods are applied to video data. Hence, an automated video analysis tool is adopted to extract road user trajectories and cluster similar cyclist trajectories to compare the movements of cyclists traveling through the cycling network discontinuity compared to a control site. The methodology identifies valuable microscopic information on cyclist movements that can be applied to any location to evaluate cyclist behaviour. Results from this study indicated a higher variation in number of cyclist maneuver and speeds at locations of cycling network discontinuity compared to their control site. Finally, the safety implications of discontinuity locations on cyclists is studied using surrogate measures of safety (SMoS) adopting a probabilistic method (PSMoS) of predicting future positions of road users. The two pairs of discontinuity and control sites from Montréal are further analysed in a case study. Time-to-collision (TTC) is computed for cyclist-vehicle interactions and summarised per cyclist maneuver to identify the specific risky maneuver cyclists make at discontinuity locations. This novel movement-based PSMoS approach has not been adopted in literature for the safety analysis of all cyclist maneuvers. The approach is a useful tool to identify the exact movements that influence the safety of cyclists. Results show that the discontinuity locations have a higher number of unsafe cyclist motion patterns compared to their control sites. At the discontinuity site where the physically separated cycling facility location changes from one side of the road to another, cyclists
who originate and end in the cycling facility on the opposite ends of the intersection have the lowest TTC.
In Summary, this dissertation closes the gaps in literature by defining and proposing cycling network discontinuity indicators and evaluating their effects on cycling network performance, cyclist behaviour, and safety. Results of all the studies in this dissertation confirm the importance of including discontinuity indicators in the planning and evaluation of cyclist networks. The lack of these indicators in current planning and evaluation stages provides a partial image of the quality of a cycling network and cycling experience and leaves transportation departments unable to fully address the effect of discontinuities on cyclists. The information obtained from the cyclist behavior and safety studies will help planners and city officials make better informed decisions by improving the infrastructural design of the cycling network discontinuity locations to eliminate unsafe movements and safely accommodate all cyclists.
TABLE OF CONTENTS
ACKNOWLEDGEMENTS ... III RESUME ... IV ABSTRACT ... VII TABLE OF CONTENTS ... X LIST OF FIGURES ...XVII LIST OF ABBREVIATIONS ... XXI GLOSSARY ... XXIII LIST OF APPENDICES ... XXV
CHAPTER 1 INTRODUCTION ... 1
1.1 Overview ... 1
1.1.1 Cyclist Behaviour Studies ... 2
1.1.2 Cyclist Safety Studies ... 3
1.1.3 Research Gaps ... 5
1.1.4 What are Discontinuities ... 5
1.1.5 Important Definitions ... 7
1.2 Research Objectives ... 9
1.3 Contributions ... 10
1.4 Thesis Structure ... 11
CHAPTER 2 LITERATURE REVIEW ... 13
2.1 Cyclist Preference Studies ... 14
2.1.1 Overview of Findings ... 14
2.1.2 Specific Findings on Possible Discontinuity Measures ... 15
2.2.1 Overview of Findings ... 16
2.2.2 Specific Findings on Possible Discontinuity Measures ... 17
2.2.3 Movement-Based Safety Studies ... 23
2.3 Cycling Network Performance ... 26
2.3.1 Main Cycling Network Performance Indicators ... 27
2.3.2 Common Connectivity and Continuity Indicators ... 28
CHAPTER 3 METHODOLOGY OVERVIEW ... 30
3.1 Obtain required datasets ... 30
3.2 Initial Dataset Processing ... 32
3.3 Discontinuities Characterization Method ... 32
3.3.1 Methodology to Identify Infrastructural Discontinuities ... 33
3.3.2 Automated Method to Identify Infrastructural Discontinuities ... 34
3.4 Data Collection and Processing ... 34
3.4.1 Road Lighting Audit and Data Processing ... 34
3.4.2 Video Data Collection at Discontinuities ... 35
3.4.3 Video Data Processing ... 41
3.5 Behavioural and Safety analysis at discontinuities ... 45
CHAPTER 4 ARTICLE 1: EVALUATING AND COMPARING THE CYCLING NETWORK CONNECTIVITY OF FOUR CITIES USING DISCONTINUITY INDICATORS47 Abstract ... 48
4.1 Introduction ... 49
4.2 Background ... 50
4.3 Methodology ... 54
4.3.1 Defining Discontinuity Indicators ... 54
4.3.3 Identifying Discontinuities ... 56
4.3.4 Results Analysis and Visualization ... 58
4.4 Case Study in Four Areas ... 58
4.4.1 Dataset Standardization ... 59 4.4.2 City Descriptions ... 59 4.4.3 Montréal ... 60 4.4.4 Vancouver ... 60 4.4.5 Portland ... 61 4.4.6 Washington D.C. ... 61
4.4.7 Cycling Facility Type Distributions ... 63
4.5 Results and Discussion ... 63
4.6 Conclusion ... 68
Acknowledgments ... 69
References ... 69
LINK BETWEEN CHAPTER FOUR AND FIVE ... 73
CHAPTER 5 ARTICLE 2: ROAD LIGHTING EFFECTS ON BICYCLE AND PEDESTRIAN ACCIDENT FREQUENCY: CASE STUDY IN MONTRÉAL ... 74
Abstract ... 75
5.1 Introduction ... 76
5.2 Earlier Studies ... 78
5.3 Methodology ... 79
5.3.1 Identification of Required Data and Data Preparation ... 80
5.3.2 Select the Data Collection Area ... 81
5.3.3 Illuminance Data Collection ... 81
5.4 Montréal Case study ... 83
5.4.1 Data Collection and Preparation ... 83
5.4.2 Empirical Results ... 88
5.5 Conclusion ... 92
Acknowledgements ... 93
References ... 93
LINK BETWEEN CHAPTER FIVE AND SIX ... 97
CHAPTER 6 ARTICLE 3: ANALYSING CYCLIST BEHAVIOUR AT CYCLING FACILITY DISCONTINUITIES USING VIDEO DATA ... 98
Abstract ... 99
6.1 Introduction ... 100
6.2 Background ... 101
6.2.1 Factors Affecting Cyclist Behaviour ... 101
6.2.2 Analysis Methods ... 102
6.3 Methodology ... 103
6.4 Site Selection ... 104
6.5 Video Data Collection and Processing ... 104
6.5.1 Cyclist Behaviour Analysis ... 106
6.6 Experimental Results for Cyclist Behaviour ... 107
6.6.1 Site Description ... 107
6.6.2 Change in Cycling Facility Type ... 109
6.6.3 Change in Facility Side ... 113
6.7 Discussion ... 117
6.8 Conclusion ... 118
References ... 119
LINK BETWEEN CHAPTER SIX AND SEVEN ... 125
CHAPTER 7 ARTICLE 4: IS THAT MOVE SAFE? CASE STUDY OF CYCLIST MOVEMENTS AT INTERSECTIONS WITH CYCLING DISCONTINUITIES ... 126
Abstract ... 127
7.1 Introduction ... 128
7.2 Review of SMoS Assessment Methods ... 130
7.3 Methodology ... 133
7.3.1 Site Selection and Video Data Collection ... 133
7.3.2 Video Data Preparation and Analysis ... 135
7.3.3 SMoS Computation ... 136
7.4 Case Study ... 137
7.4.1 Descriptive Analysis: Change in Cycling Facility Location on Road ... 137
7.4.2 Descriptive Analysis: Changes in Cycling Facility Type ... 142
7.4.3 Comparison of All Sites ... 145
7.5 Conclusion ... 147
Acknowledgments ... 149
Author Contribution Statement ... 149
References ... 149
CHAPTER 8 DISCUSSION ... 153
8.1 Overview ... 153
8.2 Cycling Network Discontinuities ... 154
8.3 Cyclist Behaviour and Safety at Discontinuities ... 156
CHAPTER 9 CONCLUSION AND RECOMMENDATIONS ... 159
9.2 Objectives and Contributions ... 160
9.3 Research Findings ... 161
9.4 Research Limitations and Recommendations ... 163
9.5 Direction of Future Work ... 164
BIBLIOGRAPHY ... 166
APPENDICES………..192
Appendix A – Site Selection and Parameter Values……….192
Appendix B – Article 5: Method for Road Lighting Audit and Safety Screening at Urban Intersections………..…194
Appendix C – Article 6: A Methodology to Quantify Discontinuities in a Cycling Network – Case Study in Montréal boroughs………...………..220
LIST OF TABLES
Table 1-1 Discontinuity categories and measures (before normalization) ... 9
Table 4-1 List of variables used in the main cycling network performance evaluation methods .. 52
Table 4-2 Types of discontinuities and examples of indicators (before normalization) ... 55
Table 4-3 Description of the road and cycling network of the selected cities ... 60
Table 4-4 Discontinuity indicators of the four cities ... 63
Table 5-1 Descriptive statistics of all the variables for the 1422 links ... 88
Table 5-2 Estimated coefficients for the nighttime bicycle accident frequency model ... 90
Table 5-3 Estimated coefficients for the nighttime pedestrian accident frequency model ... 91
Table 6-1 Site description ... 108
Table 6-2 Speed and acceleration statistics at the discontinuity and control sites ... 111
Table 6-3 Speed and acceleration statistics at the discontinuity and control sites ... 115
Table 7-1 Summary of motion patterns with interactions ... 141
Table 7-2 Summary of motion patterns with interactions ... 144
Table B. 1 Average Illuminance of Each Approach in a Sample Intersection ... 210
Table B. 2 Effects of Exogenous Variables on Accident Risk and Average Illuminance ... 214
Table C. 1 Quantifying discontinuity indicators ... 229
Table C. 2 Coverage and discontinuity indicators of the cycling networks for three Montréal boroughs (the worst performer for comparable indicators is highlighted in bold) ... 238
LIST OF FIGURES
Figure 1-1 Methods of road user behaviour and safety analysis ... 2
Figure 1-2 Cycling facility types (Google Maps: Montréal) ... 8
Figure 2-1 TTC curve ... 19
Figure 2-2 Safety pyramid (adapted from (Hyden, 1987)) ... 20
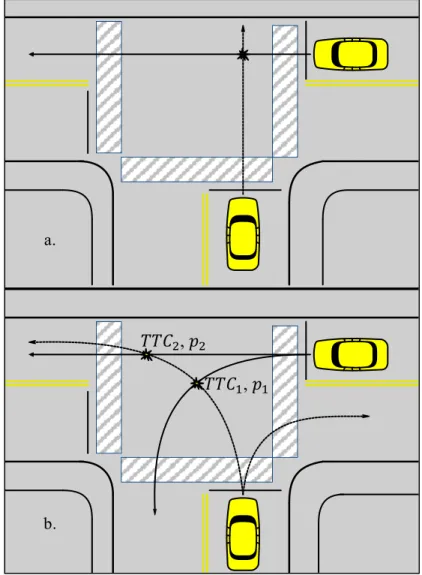
Figure 2-3 a. Traditional motion prediction method assuming constant speed and direction, b. probabilistic motion prediction method using observed motion patterns ... 22
Figure 2-4 Right and left turning movements ... 24
Figure 3-1 Methodology overview ... 31
Figure 3-2 Camera setup for video recording ... 36
Figure 3-3 Change in cycling facility side discontinuity: Maisonneuve boulevard and Ste-Catherine street (Google Maps) ... 37
Figure 3-4 Continuous facility: Maisonneuve boulevard and Prince Albert street (Google Maps) ... 38
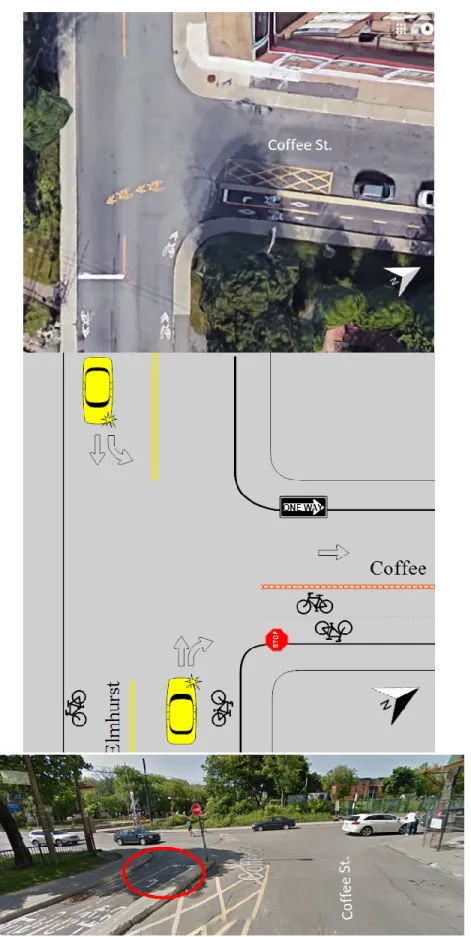
Figure 3-5 Change in cycling facility discontinuity: Coffee street and Elmhurst avenue (Google Maps) ... 39
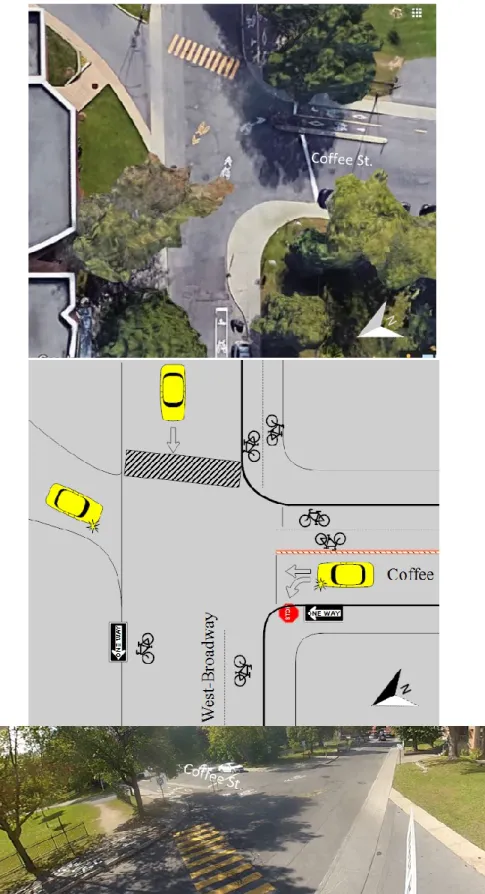
Figure 3-6 Continuous cycling facility on all legs: Coffee street and West Broadway street (Google Maps) ... 40
Figure 3-7 a. Distorted frame, b. frame corrected for distortion ... 42
Figure 3-8 Mask to delineate the areas for detection and tracking (the area in black is not processed) ... 42
Figure 3-9 Points selected to convert image to world space ... 43
Figure 3-10 a. Three cyclist trajectories tracked overlaid over the video frame, and b. converted to world coordinates overlaid over the aerial view image ... 44
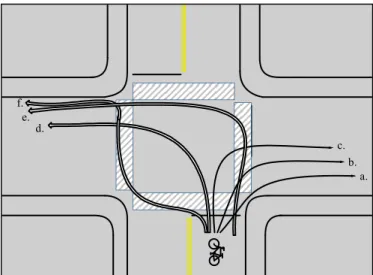
Figure 3-11 a. Tracked features over a cyclist, and b. grouped cyclist features ... 45 Figure 3-12 a. Cyclist trajectories, and b. cyclist motion patterns (origins marked in red circle) . 46
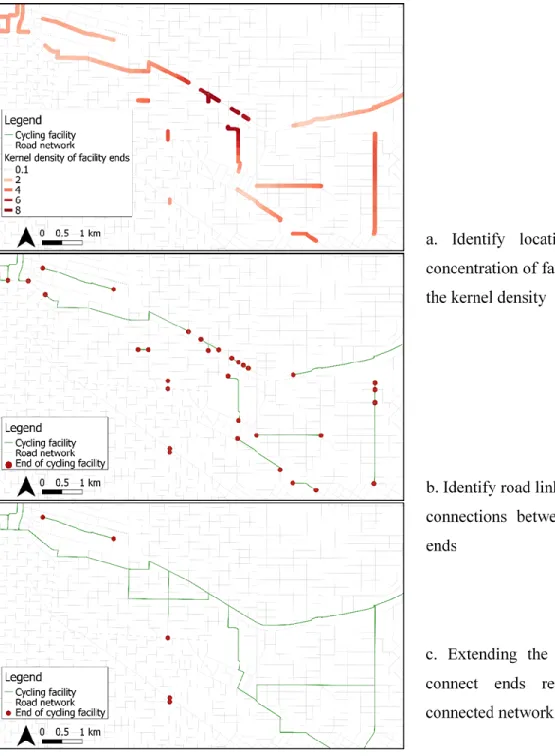
Figure 4-1 Discontinuity identification methodology using a geographic analysis tool ... 57
Figure 4-2 Road and cycling networks ... 62
Figure 4-3 Cycling facility class distribution and cycling network coverage for each city ... 63
Figure 4-4 End of cycling facility density ... 64
Figure 4-5 Change in cycling facility type density ... 65
Figure 4-6 Improving the connectivity of the cycling network by connecting the cycling facility ends ... 67
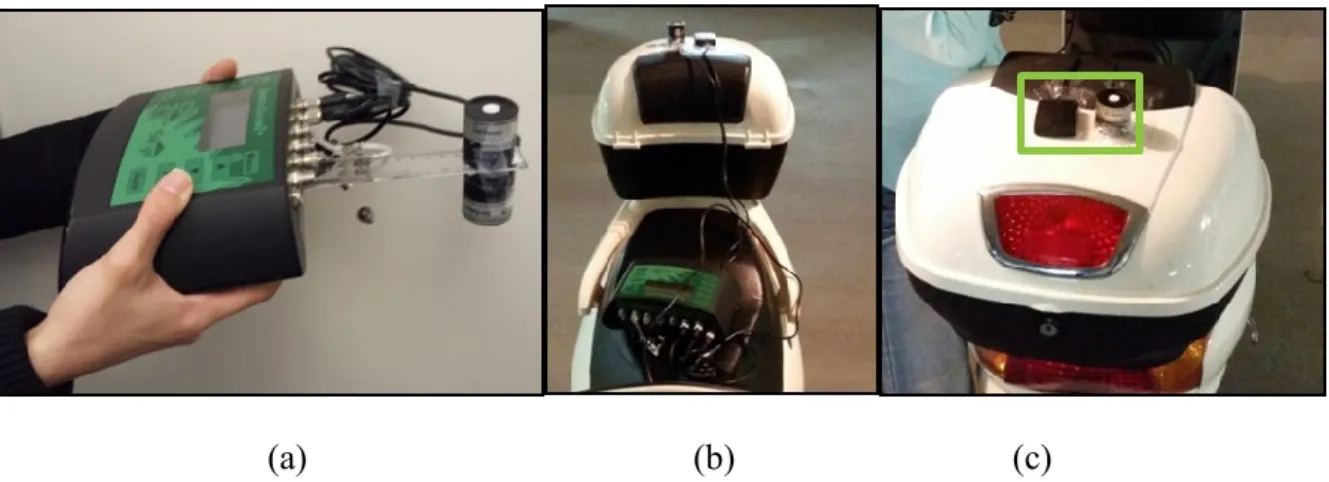
Figure 5-1 a. Data logger and sensor held by the data collector; b. and c. illuminance sensor and GPS mounted on electric scooter ... 82
Figure 5-2 Map of the Island of Montréal with a heat map of the nighttime bicycle and pedestrian accident frequency ... 85
Figure 5-3 Selected road network for illuminance data collection in downtown Montréal ... 86
Figure 5-4 Buffer around road links to include all point illuminance measurements related to each link ... 87
Figure 5-5 Substandard lighting shown in red and standard lighting shown in blue representing the non-uniform lighting of links ... 89
Figure 6-1 Overview of the main methodology steps ... 105
Figure 6-2 Cyclist motion patterns (represented by their prototype trajectories) for the change in cycling facility type discontinuity ... 112
Figure 6-3 Cyclist motion patterns (represented by their prototype trajectories) for the change in cycling facility side discontinuity ... 116
Figure 7-1 Some possible right and left turning movements ... 130
Figure 7-2 Methodology overview ... 133
Figure 7-3 Aerial view of the a. Maisonneuve and Ste. Catherine discontinuity, and b. Maisonneuve and Prince Albert control site ... 134
Figure 7-4 Aerial view of the a. Coffee and Elmhurst discontinuity, and b. Coffee and West
Broadway control site ... 135
Figure 7-5 Cyclist motion patterns under study at the a. site with discontinuity, and b. the control site (origins marked with a red circle) ... 138
Figure 7-6 Cyclist motion patterns under study with cyclist-vehicle interactions with a collision course at the a. discontinuity location, and b. control site (origins marked with a red circle) ... 140
Figure 7-7 Boxplot of TTC15 per motion patterns under study at the a. discontinuity, and b. control site ... 141
Figure 7-8 Cyclist motion patterns under study at the a. site with discontinuity location, and b. control site (origins marked with a red circle) ... 142
Figure 7-9 Boxplot of TTC15 per motion patterns under study at the a. discontinuity, and b. control site ... 145
Figure 7-10 Boxplot of TTC15 of interactions affected by the discontinuity per location ... 146
Figure 7-11 Cumulative distribution function of TTC15 of cyclists-vehicle interactions under study ... 146
Figure 7-12 Cumulative distribution function of TTC15 of cyclists-vehicle interactions under study ... 147
Figure B. 1 Data collection sheet ... 206
Figure B. 2 Map of selected intersections with risk variation ... 209
Figure B. 3 Map of the collected illuminance measurements of a sample intersection ... 210
Figure B. 4 Risk distributions among intersections with standard and non-standard lighting ... 211
Figure B. 5 Average intersection illuminance as a function of PI: (a) arterial – arterial (14 %), (b) arterial – collector (18 %), (c) arterial – national (14 %), and (d) collector – national (12 %). 42 % of the intersections are not represented in these plots ... 212
Figure C. 1 End of cycle track where cyclists wishing to continue through the intersection must move to the right hand side of the lane with cars moving in the opposite direction (Google
images, Montréal: Maisonneuve and St. Catherine) ... 224
Figure C. 2 Montréal cycling facilities ... 232
Figure C. 3 Illustration of different bicycle network discontinuity measures ... 233
LIST OF ABBREVIATIONS
AADT Average annual daily trafficBCI Bicycle compatibility index
BEQI Bicycle environmental quality index BLOS Bicycle level of service
BS Bike score
BSIR Bicycle safety index rating BSL Bicycle stress level
CI Copenhagenize index
DST Deceleration to safety
EB Empirical Bayes
FHWA Federal highway administration
FQRNT Fonds de recherche du Québec - Nature et technologies GIS Geographic information system
GNSS Global navigation satellite system GPS Global positioning system
GT Gap time
IES Illuminating engineering society KS Kolmogorov–Smirnov test KW Kruskal–Wallis test
LCSS Longest common subsequence LTS Level of traffic stress
NB Negative binomial model OL Ordered-logit model
PET Post-encroachment time
PSMoS Probabilistic surrogate measures of safety ROC Risk of collision
SMoS Surrogate measures of safety SRID Spatial reference identifier
TA Time to accident
TCT Traffic conflict technique TTC Time-to-collision
GLOSSARY
Accident: traffic event involving a collision of a road user with another road user or object resulting in property damage or bodily harm, or non-collision event such as running off the road or roll over. Collision course: situation of two or more road users with a non-zero probability of colliding in the near future.
Discontinuity: interruptions and changes in the cycling network: end of cycling facility on the road.
Heat-map: a representation of data in the form of colors per cell representing spatial units of a given size over an area based on an attribute of each cell.
Historical accident data: ensemble of accident records gathered by police, ambulance services, or insurance companies, containing information about accidents such as location, time, type, cause(s), environmental factors, road users involved, injury severity levels, etc.
Homography: a mathematical coordinate transformation between two planes used to project positions in image (video) space to world space, and back.
Image space: the coordinate space used to represent data on the projected plane of the camera’s field of view.
Interaction: the relationship between two road users within a certain distance and time. Lux: unit of illuminance measured as the intensity of light as perceived by the human eye. Maneuver (movement): the movement of a road user on the road at the microscopic level. Motion pattern: group of similar trajectories, represented by an actual trajectory.
Motion prediction: the process of generating future positions at a given instant, based on their positions up to that instant.
Post-encroachment time: a measure of the difference in arrival time at a crossing zone of two road users with overlapping trajectories.
Safety: refers to the absence of bodily harm, risk of damage or injury for all road users.
Severity: level of closeness to accident measured by injury levels (minor injury, major injury and fatal), or by temporal and spatial proximity to collision point (SMoS thresholds).
Surrogate measure of safety: a non-accident measure used to describe the safety and severity of an interaction.
Time-to-collision: the time remaining for two road users on a collision-course if their movements remain unchanged.
Traffic conflict technique: a non-accident-based method for traffic safety estimation based on traffic conflicts with the basic hypothesis that “accidents and conflicts originate from the same type of processes in traffic and a relation between them can be found” (Laureshyn, 2010).
Traffic conflict: an interaction in which two or more road users approach each other in time and space to such an extent that there is a possibility of collision if their movements remain unchanged (Hyden, 1987).
Trajectory: a series of points in space and time defining the movement of a road user, typically at regular time steps, for example if extracted from video.
LIST OF APPENDICES
Appendix A – Site Selection and Parameter Values ... 192 Appendix B – Article 5: Method for Road Lighting Audit and Safety Screening at Urban
Intersections ... 194 Appendix C – Article 6: A Methodology to Quantify Discontinuities in a Cycling Network – Case
CHAPTER 1
INTRODUCTION
1.1 Overview
The strive to achieve sustainable transport mobility has lead researchers, city officials, planners and policy makers to invest in research, developments and publicity campaigns to promote non-motorized transport modes. As a result, cycling has gained popularity and attention due to its environmental, social, economic and personal benefits which include reductions in the emissions of pollutants and greenhouse gases, reduced traffic congestion, improved health, reliability and affordability (Boyle, 2005; Sallis, Frank, Saelens, & Kraft, 2004; Sener, Eluru, & Bhat, 2009). An impediment to these efforts and benefits, is the alarming rate of road traffic injuries which is ranked as the number one cause of death among individuals aged 15 to 29 years (World Health Organization, 2015). In 2013, the World Health Organization estimated a total of 50 million traffic-related injuries and 1.25 million road traffic fatalities, 49 % of which were vulnerable road user deaths (World Health Organization, 2015). In 2016, Canadian road accidents accounted for 1,898 fatalities and 160,315 injuries, where 17.6 % and 2.5 % of fatalities were pedestrians and cyclists respectively (Transport Canada, 2017).
This lack of safety has been identified as one of the reasons for low cycling mode share in many regions (Dill & Gliebe, 2008). In North America, despite the extensive implementation and expansion of cycling networks, most short-distance trips are taken with private cars (J. Pucher & Renne, 2003). Cycling as a mode of transport ranges from 1.4 % of all trips in the United States, to over 30 % in the Netherlands and Denmark, while Canada has one of the lowest cycling rates of only 2 % (European Cyclists’ Federation, 2014; J. Pucher & Buehler, 2008; Statistics Canada, 2016).
Low cycling mode share and low safety levels for cyclists have motivated researchers to investigate and better understand cyclist’s behaviour, safety, and interaction with other road users. Cyclist behaviour and safety can be studied at the macroscopic or microscopic levels as shown in Figure 1-1. Cyclist behaviour varies widely at the macroscopic level, in particular in terms of mode and route choice (see (Casello & Usyukov, 2014; Sener et al., 2009)) or cycling volume (see (J. Pucher & Buehler, 2006)). The macro-level safety studies focus on a city or area, typically based on the total number of accidents. The microscopic level corresponds to the operational and tactical levels,
which encompass the road user maneuvers and choice of location on the road (see (Fu, Beitel, et al., 2018; Twaddle, 2017; van Haperen et al., 2018)). Microscopic safety has been studied at an intersection or link level, using accident data, unsafe events and behavioural observations (Gerstenberger, 2015; Wanvik, 2009a).
Figure 1-1 Methods of road user behaviour and safety analysis
Cyclists behaviour and safety has also been observed to change in different conditions such as seasons, in summer compared to winter (Nosal & Miranda-Moreno, 2014), weather conditions (Ahmed, Rose, & Jakob, 2013; Helbich, Böcker, & Dijst, 2014), nighttime compared to daytime (Yan, Ma, Huang, Abdel-Aty, & Wu, 2011), and riding through a cycling facility compared to riding on shared roads (J. A. Pucher, 2000). Mode and route choice studies investigate factors that influence these choices, and safety assessments evaluate the causes behind road accidents. This information is then used by city officials, researchers and planners to design, implement and improve cycling infrastructure that aims to attract road users to switch to active modes of transport and safely accommodate cyclists.
1.1.1 Cyclist Behaviour Studies
Behavioural studies have relied on stated and revealed preference survey data such as local and national transport surveys (Santos, McGuckin, Nakamoto, Gray, & Liss, 2011; M. Stinson & Bhat,
Macroscopic level
(Mode and Route Choice Studies) (Intersection and Link Level) Microscopic level
Factors influencing mode and route choice Factors influencing safety Behavioural Studies Safety Studies
Statistical Analysis Descriptive Analysis Stated Preference Surveys Revealed Preference Surveys Historical Accident Data Surrogate measures of Safety
2003), on-site or video observational data (Copenhagenize Design Co., 2017), and positional data such as Global Navigation Satellite Systems (GNSS) collected from cyclists (Dhakar & Srinivasan, 2014; Hood, Sall, & Charlton, 2011). Analysis methods include the descriptive presentation of results or the use of statistical models to investigate the unobserved effect of exogenous variables on cyclist behaviour, usually expressed in terms of discrete choices, by using Multinomial Logit, Nested Logit, and Mixed Multinomial logit models (Bovy, Uges, & Hoogendoorn-Lanser, 2003; Casello & Usyukov, 2014; Sener et al., 2009). Macroscopic analysis at the mode and route choice levels using stated and revealed preference surveys have identified poor objective and perceived safety of cyclists as a reason for the low cycling mode share (Dill & Gliebe, 2008; Ehrgott, Wang, Raith, & van Houtte, 2012; Garrard, Rose, & Lo, 2008), as well as the lack of cycling facilities along their route (Dill & Gliebe, 2008; Mitra, Ziemba, & Hess, 2017). Statistical analysis of cyclist route choice has also indicated a preference for routes with a cycling facility (Hood et al., 2011; Sobhani, Alizadeh Aliabadi, & Farooq, 2018) as well as low traffic volumes, lower traffic speed, minimal parking, and fewer stop signs (Sener et al., 2009). These studies help identify factors that affect behaviour and perception, that either encourage cycling or cause concern for some cyclists.
1.1.2 Cyclist Safety Studies
Historical accident data are widely used for safety studies and are obtained from police and hospital reports, or insurance companies. Descriptive and statistical analyses of accident frequency or injury severity are conducted to identify and understand causes of accidents to better propose and implement counter-measures. Statistical frameworks for accident frequency and injury severity adopt negative binomial, ordered logit, Bayesian logistic regression, etc. Studies of bicycle accident injury severity have evaluated the effect of weather conditions, road lighting, time of day, vehicle speed, age and gender (Kim, Kim, Ulfarsson, & Porrello, 2007; Rodgers, 1995). Results show that higher vehicle speeds, middle-aged and older male cyclists, and nighttime accidents had a higher likelihood of resulting in fatal accidents.
Although historical accident data provide a means to study safety, waiting for accidents to happen to diagnose safety is reactive and hardly ethical. To perform a safety assessment, many accidents at the same, and different locations must be collected to investigate the factors and causes of accidents. The problem with this reactive approach is that accidents are few in numbers, and there are usually not enough accidents at the same location to evaluate its safety. Studies commonly
compile the number of accidents that occur in the span of five to ten years, which is problematic since infrastructural, traffic and environmental changes could have occurred during the study period. Another shortcoming of using accident data is that there is major underreporting of accidents and a lack of detail on the process of the accident (Alsop & Langley, 2001; Amoros, Martin, & Laumon, 2006). The reporting of cyclist accidents is even more prone to bias and varies across countries depending on the type of accident, type of vehicle involved, and level of severity (Shinar et al., 2018).
The shortcomings related to accident data, as well as its reactive nature, have lead to the introduction of more proactive approaches, where traffic is observed to identify critical interactions (traffic conflicts) between road users in order to predict the risk and severity of accidents. In 1977, Amundsen and Hydén defined some of these unsafe situations as traffic conflicts where “two or more road users approach each other in time and space for such an extent that there is a risk of collision if their movements remain unchanged” (Amundsen & Hyden, 1977). The use of traffic conflicts has gained attention with countries developing traffic conflict techniques (TCT) to quantify safety using surrogate measures of safety (SMoS) without waiting for accidents to happen (e.g. (Hyden, 1987; Kraay & van der Horst, 1985; Sayed & Zein, 1999)). Studies have adopted the use of SMoS indicators such as time-to-collision (TTC), post-encroachment time (PET), gap-time (GT), deceleration-to-safety time (DST), etc. to evaluate vehicle, cyclist and pedestrian safety (Fu, Miranda-Moreno, & Saunier, 2018; Ismail, Sayed, Saunier, & Lim, 2010; Laureshyn, Goede, Saunier, & Fyhri, 2017; Zangenehpour, Strauss, Miranda-Moreno, & Saunier, 2016).
Traditional TCTs rely on the manual observation of traffic conflicts and an estimation of their severity based on approximate road user speed, evasive action and temporal nearness to accident (Hyden, 1987). To eliminate the long hours of on site observation, video recordings of the study site are manually observed for traffic conflict detection. However, the issues with manual observation include the cost of training observers, the reliability and consistency of the observer’s judgement, the interpretation and estimation bias and errors especially when observing long hours of video data (Sayed, Brown, & Navin, 1994). More recent approaches have combined image processing with data mining and computer vision techniques to automatically and more reliably detect road users and obtain road user trajectories, speed and interaction information from video data. These tools provide detailed and more accurate microscopic information on road user’s behaviour and safety, and significantly reduces the issues related to manual detection methods.
1.1.3 Research Gaps
A review of literature on cyclist route choice, accident and SMoS studies revealed a gap in systematically defining and identifying cycling network discontinuities and investigating microscopic cyclist behaviour and safety at these locations. The effects of infrastructure such as the presence of cycling facilities, the types of cycling facilities, the number and width of lanes, the presence of road lighting, the road class, the speed limits, etc. have been studied in the literature. However, locations where there are interruptions and changes in the infrastructure, where the infrastructure is not continuous, such as a change in road type, change in road lighting or change in cycling facility types along a cyclist’s route have not been extensively characterized or evaluated. These locations, referred to as discontinuities, have seen little consideration in either macroscopic or microscopic cyclist behaviour and safety studies. The only studies on some form of discontinuity had a limited definition of the variables and only a descriptive scope (Barsotti & Kilgore, 2001; Krizek & Roland, 2005; Sener et al., 2009).
1.1.4 What are Discontinuities
An ideal cycling network entails a riding experience without any added stress, safety concern, effort and mental workload, and allows for easy and timely access to destinations. It has been established that level of cyclist’s stress and comfort varies across different facility types, road classes, and other infrastructural factors (Hunt & Abraham, 2007; M. A. Stinson & Bhat, 2005). For example, an investigation of cyclist’s perceived safety among different cycling facility types indicated a range of comfort levels associated with different facility types (Jensen, Rosenkilde, & Jensen, 2007). This variation in perceived safety associated with each facility type is an indication that at locations where cycling facility types change, cyclists will undergo a change in comfort and safety perception. Since cyclists prefer to ride on a continuous cycling facility (Sener et al., 2009), interruptions such as frequent changes in cycling facility types, high levels of traffic volume and speed changes, and interruptions in the infrastructure along the cyclist’s path all result in increased mental workload, changes in stress and safety levels (Akar & Clifton, 2009; Blanc & Figliozzi, 2016; Vansteenkiste, Zeuwts, Cardon, Philippaerts, & Lenoir, 2014). These changes and interruptions along a cyclist’s path are called discontinuities. Discontinuities can occur at road links or intersections where the different infrastructure types “collide”, such as where a physically separated cycling facility turns into a designated roadway, or a local road changes to a collector
road type with higher traffic speeds and volume, or where roads have uneven lighting levels at nighttime. The transition between different cycling and road infrastructures follows little logic in design and may result in different road user behaviour and safety levels.
From a road lighting discontinuity perspective, nighttime safety studies have used indicators such as the presence or absence of road lighting, or performed a before-after road lighting installation study (Bruneau & Morin, 2005; J. D. Bullough, Donnell, & Rea, 2013; Donnell et al., 2010; Wanvik, 2009a; Yannis, Mitzalis, Kondyli, & Mitzalis, 2012). However, studies have not considered the effects of road lighting variations on safety. The study of discontinuous lighting requires the collection and evaluation of actual illuminance measurement to study its effects on nighttime safety.
Studies that have considered some form of cycling network discontinuities include a study evaluating cyclist preferences which identified discontinuous cycling facilities (presence of a cycling facility on less than 75 % of the cyclist’s route) and large changes in traffic flow as inconvenient (Sener et al., 2009). A cycling network evaluation study stated that the comfort of riding on dedicated cycling facilities may not compensate for the uncomfortable and high-stress points of discontinuity along the cyclist’s route (Mekuria, Furth, & Nixon, 2012). Although the effects of discontinuities on perceived safety are the focus of the mentioned studies, the microscopic behaviour and objective safety of cyclists at these locations have not been evaluated. To conduct such microscopic studies at discontinuities, detailed trajectory, speed and road user interaction data is required and can be obtained from automated video data analysis methods. The limited investigation of these fields in the literature and practice as well as the alarming rate of road fatality and injury and the low cycling mode share are the motivational factors behind this dissertation. The impact of two major types of infrastructural discontinuities are studied in this dissertation: road lighting discontinuities and cycling facility discontinuities. Three methodologies are proposed to perform a nighttime road lighting audit, an automated tool to identify discontinuities in cycling networks, and a movement-based approach to surrogate safety analysis. Behavioural and safety studies are conducted by applying the proposed methodologies to case studies in Montréal and other North American cities. The following section highlights the objectives of this dissertation.
1.1.5 Important Definitions
1.1.5.1 Cycling Facility TypesA cycling network is defined as the areas designed specifically for cyclists to ride. These include different cycling facility types that are categorised into four groups:
1. Physically separate cycling facility: these are cycling facilities that are physically separated from road traffic by a raised median or bollards, and the only interaction with other road users occurs at intersections, at locations where the separation disappears to allow for vehicles to access driveways, and where pedestrians cross the facility to access bus stops or cross the street. An example is shown in Figure 1-2 a.
2. Bike lane: the painted stripe lines on the road, without any physical separation, indicate the location where cyclists may ride. Interactions with other road users is at intersections, locations where vehicles and busses cross their path to access parking spaces or bus stops, and at an adjacent bus stop where passengers getting on or off the bus cross the bike lane. An example is shown in Figure 1-2 b.
3. Designated roadway: road paintings indicating where cyclists share the road with vehicles with no separation and in constant interaction with road users. An example is shown in Figure 1-2 c.
4. Off-road facility: facilities in areas such as parks that have no interaction with motor vehicles. An example is shown in Figure 1-2 d.
Figure 1-2 Cycling facility types (Google Maps: Montréal) 1.1.5.2 Cycling Network Discontinuities
The interruptions along a cyclist’s route can be quantified as discontinuity measures. Discontinuity measures can be used to evaluate an area’s cycling network performance, and a cyclist’s route choice and behaviour can be considered in relation to the number and type of discontinuities along a cyclist’s route. Cyclist safety studies can also be performed at locations with cycling network discontinuities to evaluate the effect of different discontinuities on safety.
Table 1-1 presents the categories of cycling network discontinuity types. Discontinuities are then quantified by normalizing the number of discontinuities depending on the study level. For a study at the level of an area (cycling network continuity of a city or region), the normalization factor can
a. b.
be the length of the cycling network in the area or the area’s surface, and at the level of a cyclist route (for example for a route choice study), the normalization factor is the cyclist’s route length. Table 1-1 Discontinuity categories and measures (before normalization)
Category Types of discontinuities
Intrinsic to Cycling Network
End of cycling facility
Change in cycling facility type Change in cycling facility width
Change in cycling facility location on road Change in road lighting
Change in pavement condition Change in road grade
Closure/rerouting of cycling facility due to construction or maintenance Traffic and
Road Network
Change in road class
Change in number of road lanes Change in traffic volume Change in traffic speed Intersections
Other
Driveways Bus stops
Parking allowed on road
1.2 Research Objectives
The general objective of this dissertation is to propose and systematically define cycling network discontinuities and evaluate cyclist behaviour and safety at discontinuities. The four specific objectives are the following:
Objective 1 Propose and define cycling network discontinuities and propose a methodology to identify and quantify them in any area using geospatial data
Objective 2 Perform a nighttime safety analysis to evaluate the effects of road lighting discontinuities on vulnerable road users’ safety
Objective 3 Perform microscopic cyclist behaviour analysis at points of infrastructural discontinuity in the cycling network using video data
Objective 4 Propose and apply movement-based safety analysis of cyclist at infrastructural discontinuities in the cycling network using video data and SMoS
1.3 Contributions
The objective of this dissertation is to close the gap in cycling network performance evaluations, cyclist behaviour and cyclist safety literature considering discontinuity locations. The first step is to propose and define cycling network discontinuities and then perform a link-level cycling safety using road lighting discontinuities (measured by illuminance uniformity), and perform a behavioural and safety analysis at infrastructural discontinuities along cycling facilities.
1. The first contribution includes the conceptual definition of discontinuity measures, the definition of indicators to measure discontinuities and the proposed and automated methodology to identify discontinuities in any cycling network using geospatial data. This methodology can be adopted by city planners and researchers to identify locations where cyclists are faced with interruptions in the cycling network. The methodology is applied to four North American cities (Montréal, Vancouver, Washington D.C., and Portland) to evaluate and compare cycling network performance using their discontinuity indicators. 2. The second contribution is a proposed methodology for nighttime illuminance data
collection at an intersection and link level that can be adopted by any area to identify discontinuities in road lighting for maintenance and safety analysis purposes. The collected data can then be used to evaluate whether road lighting meets the city standards, and to perform a nighttime safety study using accident data or SMoS.
3. The third contribution is the application of the proposed road lighting audit methodology to evaluate nighttime vulnerable road user safety at Montréal urban intersections and road links. This study is the first to collect nighttime illuminance levels at an intersection and link level to evaluate nighttime safety of cyclists and pedestrians.
4. The fourth contribution is the cyclist behaviour study at discontinuities compared to control sites. Video data collected at two discontinuity and two control sites showed that cyclists undertake a number of maneuvers with varied speeds at discontinuity locations compared to control sites, highlighting the importance of including network discontinuity indicators in road and cycling network performance rankings.
5. The final contribution of this dissertation is a novel movement-based safety evaluation of cyclist at discontinuities, where safety indicators are summarized per cyclist movement
(motion pattern) to be compared across movements and across discontinuity and control locations. Like contribution four, the outcomes of this study emphasise the importance of recognizing discontinuities as hotspots that must be included in network performance evaluation and safety studies. This approach also identifies the specific risky movements that can be used to design better counter-measure.
1.4 Thesis Structure
The following eight Chapters present the research developments to carry out the objectives of this dissertation. Chapter two is a review of the relevant research efforts focusing on discontinuities affecting cyclist behaviour and safety. Chapter three covers the general methodology to complete each objective. Chapter four is the first article which defines discontinuity measures and proposes a methodology to identify discontinuities in any cycling network using its geospatial data. The methodology is automated and made available in an open source repository (Nabavi Niaki, Bourdeau, Saunier, & Miranda-Moreno, 2018). This study has been submitted to the peer reviewed journal of Transportation part A, and recognized in a Montréal research project report for the Canadian Association of Physicians for the Environment (CAPE): Analysis of missing links in Montréal’s cycling network (Notebaert & Beitel, 2017).
Chapter five is the second article which proposed the methodology to collect illuminance data at a link level to perform nighttime safety evaluation of vulnerable road users using historical accident data. This article was presented at the 2016 peer reviewed conference: annual meeting of the Transportation Research Board and published in the 2016 Transportation Research Record journal of the Transportation Research Board volume 2555
The third article presented in Chapter six presents the microscopic behaviour study of cyclists at discontinuities using speed and maneuver analysis. This article was published in the 2018 peer reviewed journal of Transactions on Transport Sciences volume 9, issue 1.
Chapter seven, and the fourth article of this dissertation, presents the proposed maneuver-based surrogate safety analysis method. The method is applied to evaluate cyclist safety at discontinuities and control sites. This article is submitted to the peer reviewed conference: 98th annual meeting of
the Transportation Research Board, and the peer-reviewed journal of Accident Analysis and Prevention.
Chapter eight is a discussion of the contributions of this dissertation and its research findings. The dissertation is concluded in Chapter nine including the study limitations and recommendations. Appendix A elaborates on the case study site selection and parameter values used for analysis in chapters four, six and seven. Appendix B presents the methodology to collect nighttime road lighting levels at an intersection level. The safety analysis is performed using vehicle accident data. This article was presented at the 2014 peer reviewed conference: 93rd annual meeting of the
Transportation Research Board and published in the 2014 Transportation Research Record journal of the Transportation Research Board volume 2458. Appendix C covers the preliminary methodology extended in Chapter four, and focuses on comparing the cycling network discontinuity of three Montreal boroughs. The paper was presented at the 2016 peer reviewed conference: 95th Annual Meeting of the Transportation Research Board, Washington D.C., 2016
CHAPTER 2
LITERATURE REVIEW
The main goal of this dissertation is to enhance the understanding of cyclist behaviour and safety when there are interruptions and changes along the cycling network and to classify these interruptions as cycling network discontinuities. The review of relevant literature highlights the areas where these topics have been covered and from what perspective, and the research gaps that exist in this field. The scattered and partial use of cycling network discontinuities in cycling route choice, cycling safety and cycling network performance studies has motivated the efforts to systematically define and propose a methodology to identify these locations in any area (presented in Chapter four). In addition to the lack of a conceptual framework for identifying discontinuity indicators, there is a lack of microscopic behavioural and safety studies of cyclists at locations of cycling network discontinuities.
A limited number of studies have used different definitions of cycling network discontinuities in the context of cyclist behaviour (e.g. (Amini, Twaddle, & Leonhardt, 2016; Copenhagenize Design Co., 2017)), route choice (e.g. (Dill & Gliebe, 2008; Menghini, Carrasco, Schüssler, & Axhausen, 2010)), comfort (e.g. (Blanc & Figliozzi, 2016)), perceived safety (e.g. (Foster, Dill, & Clifton, 2015)), and actual safety (e.g. (Prati, Pietrantoni, & Fraboni, 2017; Zangenehpour et al., 2016)). However, the focus of these studies was not on the locations where there are changes in road, traffic, or cycling network characteristics, but rather the effects of the different road and traffic characteristic such as: road class (highway, arterial, collector and local), traffic speed (observed speed or posted speed limit categorised into different levels), traffic volume (range of high to low traffic volume), parking on road (allowed or not allowed), nighttime road lighting (presence of absence of lighting), pavement condition (range from condition quality or pavement type), and presence and type of cycling facility (physically separated, bike lane, designated roadway or off-road facilities) (Buehler & Dill, 2016; Dill & Gliebe, 2008; Hölzel, Höchtl, & Senner, 2012; Hunt & Abraham, 2007; Kang & Fricker, 2013; Kaplan, Vavatsoulas, & Prato, 2014; Menghini et al., 2010).
These studies have established that cyclists route choice, behaviour and safety are affected by the changes of characteristics in each category. Therefore, the conclusion can be drawn that if there is a variability of these measure along a cyclist’s route, it will affect his/her behaviour, safety and comfort. For example, studies have shown that riding on a high speed road reduces comfort and
safety, therefore locations along the cyclist’s route where a transition from low speed road to a high speed road will result in a change from comfortable and safe, to stressful and risky (Akar & Clifton, 2009; Buehler & Dill, 2016; Caulfield, Brick, & McCarthy, 2012; Habib, Mann, Mahmoud, & Weiss, 2014; Meghan Winters, Davidson, Kao, & Teschke, 2011). Another example is the effect of parking on cyclist’s perception of safety, where changes from no parking allowed, to parking allowed on the road will result in a change in the cyclist’s perceived and actual safety (M. Stinson & Bhat, 2003; Wilkinson, Clarke, Epperson, & Knoblauch, 1994). The results of these studies indicate that at these locations of change, cyclists experience stress and increased mental effort and will behave differently given their comfort and experience levels (Hunt & Abraham, 2007; Krizek & Roland, 2005; Vansteenkiste et al., 2014).
The following subsections focus on different cyclist study aspects (cyclist preference and safety) with specific infrastructural and traffic indicators that have been found to affect cyclists, that can be characterised as discontinuity indicators when there is a change from one variable category to another. Furthermore, relevant literature to cycling network evaluations are covered in the final subsection representing common performance indicators including connectivity and continuity.
2.1 Cyclist Preference Studies
2.1.1 Overview of Findings
In general, the analysis of cyclist behaviour around the world showed similarities between infrastructural preferences. For example, many cyclist’s stated and revealed preference studies indicated a preference for:
• roads with cycling facilities (Dill & Gliebe, 2008; Kang & Fricker, 2013; Menghini et al., 2010; Mitra et al., 2017; M. Stinson & Bhat, 2003),
• roads with fewer lanes, lower traffic volume and speed (Abraham, McMillany, Brownlee, & Hunt, 2002; Akar & Clifton, 2009; Antonakos, 1994; Caulfield, 2014; Chataway, Kaplan, Nielsen, & Prato, 2014; Dill & Voros, 2007; Foster et al., 2015; B. Landis, Vattikuti, & Brannick, 1997; J. Pucher & Buehler, 2008; Sener et al., 2009; Sorton & Walsh., 1994; Wilkinson et al., 1994; Meghan Winters et al., 2011), and
• roads without on-street parking (Sener et al., 2009; M. Stinson & Bhat, 2003; Wilkinson et al., 1994).
Among roads with a cycling facility, cyclists have demonstrated a preference for:
• physically separate and off-road cycling facility types over bike lanes and designated roadways (Akar & Clifton, 2009; Antonakos, 1994; Aultman-Hall & Adams, 1998; Broach & Dill, 2016; Broach, Dill, & Gliebe, 2012; Buehler & Dill, 2016; Foster et al., 2015; Gössling, 2013; Høye, Fyhri, & Bjørnskau, 2015; Kang & Fricker, 2013; B. Landis et al., 1997; Wardman, Tight, & Page, 2007; Wendel-Vos, Droomers, Kremers, Brug, & Van Lenthe, 2007; Meghan Winters & Teschke, 2010), and
• wider bike lanes with greater separation from traffic (Z. Li, Wang, Liu, & Ragland, 2012; Monsere, McNeil, & Dill, 2012).
Other attributes affecting cyclists travel route preference include:
• travel time and road gradient (Broach, Gliebe, & Dill, 2011; M. A. Stinson & Bhat, 2005), • road class type (Bai, Liu, Chan, & Li, 2017; Broach et al., 2011; Dill & Gliebe, 2008; Kang
& Fricker, 2013; M. A. Stinson & Bhat, 2005),
• path length, and turning vehicle volume (Broach et al., 2011), • intersection density (B W Landis et al., 2003),
• traffic signals and stop signs (Ayres & Kensington, 2015; Boudart, Liu, Koonce, & Okimoto, 2015), and
• pavement condition (Bíl, Andrášik, & Kubeček, 2015; Hölzel et al., 2012; M. A. Stinson & Bhat, 2005).
Although the preference for some of these infrastructural and traffic indicators have been established as early as the 1970’s (Feilden, 1975; Lott, Tardiff, & Lott, 1978), the locations of changes from one type to another have not explicitly been characterized as cycling network discontinuities, and have not been specifically studied.
2.1.2 Specific Findings on Possible Discontinuity Measures
A stated preference survey conducted in Edmonton, Canada, on a sample of 1,128 cyclist observations indicated that cyclists with less experience and lower comfort levels are more sensitive to traveling on mixed-traffic routes and prefer riding on bike lanes and physically separated cycling facilities, and that sensitivity to trip duration varies substantially per cycling facility type (Hunt & Abraham, 2007). A statistical analysis (binary logit model) of stated
preference survey data from 3,145 individuals who are mostly experienced cyclists (91 % of data) indicated a preference for routes with a cycling facility (especially bike lane and physically separated cycling facility), routes with low volume traffic, no on-street parking, smooth pavement and continuous cycling facility (cycling facility along entire route with no interruption, although the types of interruption are not defined) (M. Stinson & Bhat, 2003). Moreover, a descriptive analysis of 162 observations from GPS collected data in Portland by Dill and Gliebe indicated that both frequent (cycling more than 5 days a month) and infrequent cyclists (cycling less than 4 days a month), rank their top three route choice preferences as routes that minimize distance, avoid high traffic roads, and have a bike lane (Dill & Gliebe, 2008). In this study, cyclists are generally observed to ride on roads with cycling facilities compared to no facility, and among those cyclists traveling on the road with no facility, a higher preference was observed for local streets with low traffic volumes (Dill & Gliebe, 2008). Blanc et al. studied the data obtained from a smartphone application collecting route and perception information and concluded that separate cycling facilities increase cyclist comfort, and arterial road type as well as high volume vehicular traffic especially heavy vehicles decreases the comfort and safety perception of cyclists (Blanc & Figliozzi, 2016). A survey conducted by Foster et al., also found that physically separated cycling facilities are generally more comfortable compared to other types of on street cycling facilities (Foster et al., 2015). Although the cyclists’ sensitivity to different road, cycling facility and traffic characteristics is recognised, discontinuity indicators have been overlooked in these studies.
2.2 Cyclist Safety Studies
2.2.1 Overview of Findings
Cycling safety studies have identified a set of infrastructural, traffic and other variables that affect cyclist safety using historical accident or SMoS data. Based on literature, the network infrastructural and traffic variables that improve cyclist safety include:
• presence of dedicated cycling facility (physically separated cycling facility, bike lane, and off road facility type) (Kaplan et al., 2014; Lusk et al., 2011; Lusk, Morency, Miranda-Moreno, Willett, & Dennerlein, 2013; Reynolds, Harris, Teschke, Cripton, & Winters, 2009; Teschke et al., 2012; Thomas & De Robertis, 2013; Wan, Kamga, & Liu, 2018; Zangenehpour et al., 2016),