Dionne: Canada Research Chair in Risk Management, HEC Montréal and CIRPÉE Wang: Associate Professor, Department of Insurance, Tamkang University, Taipei, Taiwan
Cahier de recherche/Working Paper 11-21
Does Opportunistic Fraud in Automobile theft Insurance Fluctuate
with the Business Cycle ?
Georges Dionne Kili C. Wang
Abstract:
We analyze the empirical relationship between opportunistic fraud and business cycle. We find that residual opportunistic fraud exists both in the contract with replacement cost endorsement and the contract with no-deductible endorsement in the Taiwan automobile theft insurance market. These results are consistent with previous literature on the relationship between fraud activity and insurance contracting. We also show that the severity of opportunistic fraud fluctuates in the opposite direction to the business cycle. Opportunistic fraud is stimulated during periods of recession and mitigated during periods of expansion.
Keywords: Opportunistic fraud, replacement cost endorsement, no-deductible
endorsement, automobile theft insurance, business cycle
Does opportunistic fraud in automobile theft insurance fluctuate
with the business cycle?
1. Introduction
Insurance fraud has become an increasingly important issue throughout the world. Many
researchers have investigated this problem. Nonetheless, few studies have examined the
relationship between fraud and the surrounding environment.1 This paper fills this gap and investigates the impact of the environment on fraud from a macroeconomic standpoint. It
underlines the impact of the business cycle on insurance fraud. To our knowledge, insurance
fraud has never been directly linked to any macroeconomic factors in the literature.
Dionne (2000) provides many reasons for insurance fraud, such as changes in morality,
poverty, intermediaries’ behavior, insurers’ attitude, and nature of insurance contracts. Although it
has been pointed out that morality or poverty could affect insurance fraud,2 no studies have provided related empirical evidence. However, fraud has been associated with morality, and
morality has been linked to a country’s poverty level. In addition, the poverty level of society is
commonly linked to economic circumstances.
Dionne and Gagné (2002) find a particular pattern of claim timing in Quebec’s automobile
insurance contracts and conclude that opportunistic fraud is induced by the replacement cost
endorsement. Dionne and Gagné (2001) also show how insurance fraud is affected by the
deductible level in insurance contracts. Similarly, our contribution posits that opportunistic fraud
1 Boyer (2001) is one of the few researchers to discuss the impact of economic factors on insurance fraud,
specifically that of the tax scheme of the insurance benefit. See also Bates et al.’s (2010) study of health production efficiency.
2
Dionne and Gagné (2002) underline that poverty is a possible reason for fraud. In the theoretical model of Dionne, Giuliano, and Picard (2009), the moral cost of fraud is one of the factors that affect individuals’ decision to defraud.
is induced by the nature of the insurance contract, and further explores the impact of the business
cycle.
It is unclear whether the business cycle has a positive or negative impact on insurance fraud.
From the risk aversion standpoint, people could become more risk-averse and hesitate to play this
type of lottery by committing fraud when an economic recession reduces their wealth level.
Conversely, the morality standard could decrease when the economic situation worsens. The
marginal benefit from fraud could also increase while the wealth level decreases during a
recession, and the incentive to defraud could increase. Hence, competing predictions on the
relationship between the business cycle and insurance fraud are worth testing.
Insurance fraud is an increasingly important problem in Taiwan. In automobile theft
insurance, a significant line in the property-liability insurance market,3 the amount of fraud accounts for about 5% of total claims. It reached 150 million NT dollars in 2008.4 With the loss
ratio of auto theft insurance at more than 35% each year, fraud could be one of the reasons for
such a high loss ratio in this important business line. Further, the loss ratio fluctuates over time
and coincides with the business cycle.5
We have collected automobile theft insurance data from Taiwan’s largest property-liability
insurance company.6 Our monthly data span a long policy period, comprising policies written in 2000 to 2007, i.e. a study period of 96 policy months.7 We can thus test the relationship between
opportunistic fraud and the business cycle.
3
From 2000 to 2007, about 26.37% of private sedans were covered by theft insurance. The premium is over 40 billion NT dollars (about 1.33 billion US dollars) per year, and the growth rate is about 10% per year.
4 This is roughly equivalent to 5 million US dollars.
5 If we treat GDP as a proxy variable for the fluctuation of business cycle, we find that the loss ratio of automobile
theft insurance is significantly negative correlated with the level of GDP. We list the automobile theft insurance loss ratio of non-commercial vehicles and the GDP of Taiwan in Appendix A, from 1998 to 2009. The opposite
relationship between the loss ratio and GDP is apparent. The significant correlation coefficient is -0.98896.
6 This insurance company controls more than 20% of Taiwan’s automobile insurance market. 7
For all the contracts written from 2000 to 2007, we collect their complete claim records for the policy year. For example, the claim records of policies written in 2007 are extended to the dates in 2008.
We find a particular pattern of total theft claim timing linked to the replacement cost
endorsement. The month-by-month test8 indicates that unlike partial theft claims, total theft
claims under replacement cost endorsement contracts increase over time during the contract year.
This finding confirms that opportunistic fraud, rather than ex ante moral hazard, arises from the
replacement cost endorsement. Further, testing by each policy month during the policy year
points to another particular pattern of claim timing for opportunistic fraud induced by
no-deductible endorsement. The total theft claims of no-deductible endorsement are more
common during the early months of the contract year. This opportunistic fraud evidence can also
be separated from ex ante moral hazard.
Further, the empirical evidence affirms that opportunistic fraud fluctuates conversely with
the business cycle. The claim timing patterns for the two types of contracts mentioned above are
even more pronounced during a recession, which implies that a recession amplifies the incentives
for opportunistic fraud induced by contracts.
The paper is organized as follows. The next section analyses the empirical hypotheses. The
third section describes the data and the fourth section discusses the empirical methodology used
in this paper. The fifth section presents the empirical results. The final section concludes the
paper.
2. Hypotheses
Opportunistic fraud incentive is induced by the nature of the insurance contract.9 Two important contract types are replacement cost endorsement and no-deductible endorsement. We
8 In this paper, the periods have been reorganized according to policy periods. Hence, we test policy months instead
of calendar months.
9
Picard (2000) infers that the severity of insurance fraud ranges from build-up to planned criminal fraud. The opportunistic fraud we investigate in this paper is in the middle of the fraud spectrum. There are also many other contributions discussing the optimal contract design that could reduce the incentive to defraud. Crocker and Morgan (1998) theoretically investigate the optimal insurance contract under costly state falsification. Crocker and Tennyson (1999) empirically tested for the nature of the optimal insurance contract under costly falsification. Bond and Crocker (1997) and Boyer (2004) design the optimal insurance contract under costly state verification (see Derrig,
posit that the degree of incentive to defraud is also affected by the business cycle. In this section,
four hypotheses are proposed for the empirical tests. Before we explore the impact of the
business cycle, the claim timing pattern of opportunistic fraud induced by each contract is
identified.10
There are many factors explaining opportunistic fraud.11 On the demand side, maximizing their expected utility, each insured has a critical value of the probability of a fraud being
successful. The lower this critical value, the greater the insured’s incentive to commit fraud. One
can show that this critical value decreases when the difference between the vehicle’s replacement
cost and the vehicle’s market value increases near the expiration of the insurance contract.
Accordingly, the insured would consider opportunistic fraud near the contract’s expiration with
increasing probability. On the supply side, the probability of the insurer’s conducting an audit
also decreases near the contract’s expiration because the market value of the vehicle decreases
over time.12 Hence, as the theoretical model of Dionne and Gagné (2002) indicates, opportunistic fraud probability is higher near the expiration of the replacement cost endorsement.
We also infer the probability of opportunistic fraud under such an equilibrium model. On the
demand side, the individual’s expected utility model is similar to that of Dionne and Gagné
(2002). On the supply side, we modify their insurer’s audit probability to become flat over time.13
2002, and Picard, 2000, for reviews of the literature).
10
Identifying the existence of fraud under asymmetric information is an important aim in the literature. For example, Artis et al. (2002) adopt a new methodology to identify fraud by allowing the misclassification error in the existing method to separate fraudulent claims from honest claims.
11 Picard (1996) built an equilibrium model between the insurer and the insured to explain the successful fraud
probability in the market. Dionne and Gagné (2002) extended this model. The result is that auditing is not sufficient to deter fraud. Hence, the success probability of fraud does not correspond to the probability of non-audit.
12 The stringency of audit could affect the success probability of fraud, but it is not constant over time. Dionne,
Giuliano and Picard (2009) use red flags as the signals for conducting stringent audit in their optimal auditing strategy. Dionne and Gagné (2002) assume that the stringency of audit decreases near the expiration of the replacement cost endorsement.
13 We make this assumption because insurers in Taiwan do not, in practice, implement a particularly stringent audit
at the beginning of the contract. First, the market value of a vehicle does not vary as much as in Quebec from the beginning to the end of the overall policy period, because the contract length is only for one year, and the
The theoretical model under replacement cost endorsement is presented in Appendix B. The main
result is consistent with Dionne and Gagné (2002) in that the equilibrium fraud probability is
higher near the end of the policy year.
When we study opportunistic fraud induced by the replacement cost endorsement contract in
the empirical test, this contract is compared with the reference contract with both depreciation
and deductible. We treat the contract with deductible and replacement cost endorsement as a
high-coverage contract, and the reference contract as a low-coverage contract. A contract with
replacement cost endorsement reimburses the total value of the car evaluated at the beginning of
the contract period. The former exhibits the claim timing pattern described above, whereas the
latter does not. Hence, our first hypothesis:
Hypothesis 1: If the claims are induced by opportunistic fraud, individuals who choose a
replacement cost endorsement contract have a higher probability of filing a claim, and this
probability is even higher near the end of the contract period.
In addition, we examine incentives to defraud induced by the no-deductible endorsement
contract. Dionne and Gagné (2001) propose a theoretical model and empirically verify that the
design of the deductible would increase the incentive to build up a claim. However, this
conclusion cannot be applied directly to our research design because we investigate opportunistic
fraud rather than build-up. People putatively build up claims to exceed the deductible threshold in
the insurance contract after the event has occurred. Hence, the design of a deductible would
encourage the incentive to build up. If the event has not actually occurred, people would have a
greater incentive to invent fraudulent claims when there is no deductible designed in the contract.
The incentive of opportunistic fraud is therefore higher under a no-deductible endorsement. We
companies in Taiwan rely heavily on the mechanism of deductible design in the replacement cost endorsement and a more stringent depreciation rate in the no-deductible contract. There is actually no difference in the audit approach between the beginning and the end of the policy year as a whole.
derive this result in Appendix C. We also discuss the claim timing pattern for the contract with
depreciation in Appendix C. While the vehicle depreciation from the insurer’s indemnity is much
more stringent than that in the market, and when the incentive to cheat is large enough, the
insured would have a stronger incentive to organize opportunistic fraud at the beginning of the
contract period under a contract with depreciation. Hence, under a flat audit mechanism, the
equilibrium fraud probability is higher at the beginning of the policy year.
To identify opportunistic fraud induced by the no-deductible endorsement contract in our
empirical test, we compare this contract with the reference contract, which comprises both a
deductible and depreciation. The contract with depreciation and no-deductible endorsement is
thus a high-coverage contract, and the reference contract is a low-coverage contract. As shown in
Appendix C, the relative claim timing pattern is focused on the beginning months of the policy
year. Our second hypothesis is therefore:
Hypothesis 2: If the claims are induced by opportunistic fraud, individuals who choose the
non-deductible endorsement contract have a higher probability of filing claims. This relative
probability is even higher at the beginning of the contract period.
Although the main research problem is opportunistic fraud, we cannot deny that the former
parts of the above two hypotheses could also be the result of adverse selection. Under adverse
selection, high-risk individuals tend to purchase the two types of high-coverage contracts and
have a higher probability of making a claim. However, the claim would be equally distributed
among the twelve months. In contrast, only opportunistic fraud would create a particular pattern
in the timing of the claim during the months of the policy year. This characteristic enables us to
clearly rule out adverse selection. Hence, when the first and second hypotheses are empirically
It is important to distinguish opportunistic fraud from ex ante moral hazard.14 Opportunistic fraud results from an individual’s decision to invent a fraudulent claim or not. Ex ante moral
hazard arises from the decision to pay more or less attention to self-protection. Under the
replacement cost endorsement, ex ante moral hazard could be stronger near the end of the policy
year.15 Conversely, under the no-deductible endorsement contract, ex ante moral hazard could be stronger at the beginning of the policy year.16 Ex ante moral hazard thus has the same claim
timing pattern as opportunistic fraud.
Dionne and Gagné (2002) show that opportunistic fraud can be induced only when the
benefit from fraud is sufficiently large. They maintain that the benefit from fraud based on partial
theft is minor. The incentive to defraud through total theft is much stronger than that related to
partial theft. This difference in incentives provides an opportunity to distinguish opportunistic
fraud from ex ante moral hazard. Self-protection has an equal effect in terms of reducing the
probability of both total theft and partial theft, but fraud solely leads to a stronger incentive to file
a total theft claim. Accordingly, opportunistic fraud could emerge mainly based on the probability
of a total theft claim instead of a partial theft claim. Hence, our third hypothesis is to distinguish
opportunistic fraud from ex ante moral hazard.
Hypothesis 3: If the claim timing patterns in the first and second hypotheses emerge only in
relation to the total theft claim, opportunistic fraud exists rather than ex ante moral hazard. If the
14 In the literature, the consequences of ex ante moral hazard and fraud are often mixed. For example, when Weiss et
al. (2010) discussed the distortion effect of regulated insurance pricing, they mention that regulation could cause ex ante moral hazard because the safety investments of drivers may be diminished. This regulation could also cause fraudulent claims because the disincentive of filing fraudulent claims may also be reduced.
15 As described in Dionne and Gagné (2002), the benefits of prevention decrease over time under the replacement
cost endorsement. Hence, the presence of replacement cost endorsement reduces self-protection activities, increasing the probability of theft.
16 The depreciation rate used for the insurer’s indemnity is more stringent than that in the regular market. Hence, the
difference between the loss indemnity and the vehicle’s market value would be larger near the end of the year. This would give the insured more incentive to pay more attention to self-protection and to reduce the ex ante moral hazard near the end of the year. Accordingly, under a no-deductible contract, there is greater ex ante moral hazard at the beginning of the policy year.
above patterns also emerge relative to the partial theft claim, then ex ante moral hazard may
exist in the market, and we cannot conclusively determine whether opportunistic fraud exists.
Investigating the impact of the business cycle on opportunistic fraud is the second objective
of this research. Whether opportunistic fraud will fluctuate consistently or inversely with the
business cycle is unclear.
Regarding risk aversion, it has been accepted that most people are risk-averse and exhibit
decreasing absolute risk aversion. In an economic recession, people’s wealth decreases and they
become more risk-averse. This will make them more hesitant to adopt risky actions, including
fraud. Hence, the probability of opportunistic fraud could decrease during a recession.
Alternatively, because the individual’s wealth decreases during a recession, the increment of
utility from the benefit of fraud increases concomitantly. Furthermore, if recession reduces
individuals to the poverty level, they may feel they have much less to lose if they get caught
committing fraud. This may increase people’s likelihood of defrauding during a recession.
Fraud is highly related to an individual’s morality . Morality may also vary with wealth level.
Husted et al. (1999) argue that societal corruption is highly related to GNP per capita. They
provide empirical evidence that indirectly shows that individuals’ morality level is positively
related to their wealth. Dionne, Giuliano and Picard (2009) establish in a theoretical model that
moral cost is a factor that affects individuals’ decision to defraud. Therefore, from the standpoint
of morality, recession reduces the average wealth level. A lower wealth level could weaken
morality and reduce the moral cost of fraud, which raises the probability of fraud. Because our
fourth hypothesis encompasses two conflicting effects, we do not make a prediction on the sign
of the effect.
Hypothesis 4: Opportunistic fraud could be positively or negatively affected by the business
3. Data
Our data set includes all the characteristics of the insured and the insured vehicles, such as
the gender, age, marital status of the insured; the brand, age, size, registered area, usage purpose
of the insured vehicle; the information on the contract, such as coverage; the selling channel of
the contract; and the claim information for each policy. Regarding the claim information, we
collect not only the records on the claim amount and reason, but also the records on the date of
the claim. This could help identify the timing of the claim, specifically the policy month during
the policy period.
Further, we use the corresponding calendar date to investigate the impact of the business
cycle. Our policy data are reorganized by policy year, and the claim timing is described by policy
month, whereas the business cycle index is recorded by calendar year and calendar month.
Accordingly, because we investigate the relationship between business cycle and opportunistic
fraud for each policy month, we match the calendar date of the claim to the corresponding
calendar month in the monthly business cycle index.
The data examined comprise the policies written from 2000 to 2007 and their corresponding
claims until the end of 2008. This length of data allows us to match the monthly variation in the
macroeconomic business cycle index to test the relationship between opportunistic fraud and
business cycle. Hence we use the corresponding business cycle index of a potential claim’s
calendar month to measure the effect of the business cycle.
The business cycle index is the trend-adjusted monthly index of the composite coincident
index from January 2000 to December 2008. This index, obtained from the published data of the
Council for Economic Planning and Development of Taiwan, reflects the fluctuations of the
The total number of observations in our data set is 1,761,536. When we test whether
opportunistic fraud exists under the replacement cost endorsement, we use a sub-sample of
replacement cost endorsement contracts together with contracts with deductible and depreciation.
The number of observations in this sub-sample is 1,715,736. When we test whether opportunistic
fraud exists under no-deductible contracts, we use the sub-sample of no-deductible contracts plus
contracts with deductible and depreciation. The number of observations in this sub-sample is
1,170,012. Because we cannot observe the occurrence of partial theft for the contracts without the
endorsement of auto parts accessories, we can use only a smaller sub-sample of contracts with the
endorsement of auto parts accessories when we test the relationship between coverage and claim
timing for the partial theft case. This smaller sub-sample comprises 564,175 observations.
Observing the basic statistics of the variables in our empirical data can help us understand
the data characteristics and their representativeness. The variables are defined in Table 1. The
descriptive statistics for these variables are listed in Table 2. A total of 32.92% of theft insurance
policies involve replacement cost endorsement, and only about 2.48% of the policies have zero
deductible. About 40% of the policies are sold through dealer-owned agents.
Regarding the structure of the insured individuals, most of the insured (91.23%) are married,
between 30 and 60 years old (87.97%), and female (62.55%). As for the structure of the insured
vehicles, 64.27% of the insured vehicles have engine capacities equal to or less than 2000 c.c.,
and 39.29% of the insured vehicles are concentrated in the most popular brand in the market.
Concerning vehicle distribution across the registered areas, 47.95% are registered in the north,
27.84% in the south, and 2.29% in the east of Taiwan. 53.51% of the vehicles are registered in
cities.
About 20% of the vehicles are brand new, and more than 70% are less than four years old. A
characteristics indicate that people are more willing to purchase theft insurance for vehicles for
non-commercial use and for new vehicles.
4. Empirical methodology
The first empirical task in this paper is to identify whether opportunistic fraud exists in the
automobile theft insurance market in Taiwan. We test the evidence for fraud based on the timing
pattern of the conditional correlation between coverage and claims. The contract with high
coverage is defined as either the replacement cost endorsement or no-deductible contract. The
claim is further identified as the total theft claim and partial theft claim.
To test the conditional correlation between coverage and claims, we use a two-stage method
similar to the methodology for a conditional correlation analysis in Dionne, Gouriéroux and
Vanasse (2001). To identify the time pattern of the conditional correlation between coverage and
claim, we test their conditional correlation by policy month. Hence, in each model,17 we conduct
the following conditional correlation test on twelve pairs from the first policy month to the
twelfth policy month.
The two-stage method is as follows. In the first stage, we estimate the claim probability of
the j-th policy month for each policy by means of the Probit regression
) (
) 1 (
Probclaimjkit X1it X1it1jk , j1,...12, kt,p, i1,..n,
2007 ,... 2000 t (1)
17 When we identify the existence of opportunistic fraud, we test the conditional correlation between claim and
coverage under four models. In the first model, we test the conditional correlation between total theft claim and coverage of contract with replacement cost endorsement. In the second model, we test the conditional correlation between total theft claim and coverage of contract with no-deductible endorsement. In the third model, we test the conditional correlation between partial theft claim and coverage of contract with replacement cost endorsement. In the fourth model, we test the conditional correlation between partial theft claim and coverage of contract with no-deductible endorsement. When we identify the relationship between opportunistic fraud and business cycle, we test under two additional models. In the fifth model, we test the effect of the business cycle on the conditional correlation between total theft claim and the coverage of contract with replacement cost endorsement. In the sixth model, we test the effect of the business cycle on the conditional correlation between total theft claim and the coverage of contract with no-deductible endorsement.
where Prob() denotes the probability function, is the cumulative standard normal distribution function, i1 , ,n, denotes the observations. The observations represent an unbalanced panel from policy year 2000 to policy year 2007. k = t is for total claim and k = p is
for partial claim. X is the vector of explanatory variables that includes the characteristics of 1it
the insured and the insured vehicle, which are listed in Table 1. Some of the explanatory variables,
such as sex, age of insured, and age of the insured vehicle, are invariant during policy years.
Other explanatory variables could vary over policy years; these include registered area of vehicle,
marriage status, and policy year variable. 1jk is the corresponding parameter vector, and
jkit
claim is the variable identifying whether the insured claimed or not. claimjkit is defined by
policy month (j), from first policy month to 12th policy month of the whole policy year, for each
insured i. claimjkit 1 when insured i has filed a claim in j -th policy month of policy year t,
otherwise claimjkit 0.
In the second stage, we run the other Probit regression for the probability of purchasing a
high-coverage contract as:
)) ( ˆ ( )) ( ˆ , , 1 (cov Prob , , , , , , 2 2 2 jkit j l ec jkit j l c j l it jkit jkit it lit claim b o Pr claim X claim b o Pr claim X erage (2)
This regression is also based on the standard normal distribution used to estimate the
probability of purchasing high coverage. The variable coverage is a choice variable of the lit
insured; namely whether he or she purchased a high-coverage contract or not in policy year t.
There are two definitions of high coverage (l) in this paper: lR,ND, which denotes the replacement cost endorsement, and the no-deductible contract, respectively. The reference
it
X2 is the vector of explanatory variables that contains the same variables as in X1it. claimjkit
has been defined above, and Prob claimˆ ( jkit) is the estimated probability of claimjkit.
j l ec j l c j l, ,, ,, , 2 , ,
are the corresponding parameter vectors for the estimation under each policy
month j, and when we investigate the high-coverage contract as l=R or l=ND. The key estimated
coefficient used to test the problems of asymmetric information is c ,,l j. There is a significantly positive correlation between the l coverage and claim in j-th policy month if the estimated c ,,l j is significantly positive.
To disentangle opportunistic fraud from ex ante moral hazard, we test the conditional
correlation between coverage and total theft claim, and between coverage and partial theft claim.
Hence, the claim in the above two regressions is further defined according to total claim (k=t) or
partial claim (k=p). When we conduct the above test for the conditional correlation between
coverage and total theft claim, we can use the observations from the full sample. When we
conduct the above test for the conditional correlation between coverage and partial theft claim,
we can use only a sub-sample of insured who have also purchased the auto parts accessories
endorsement. Because we are estimating total theft claims, we test only for the existing effective
contracts in each policy month. In other words, the contracts for which total claims have been
filed are terminated and eliminated from our sample.
According to the first hypothesis, we test for the total theft claim (k=t) and replacement
endorsement (l=R). If the estimated c ,,l j, l=R in equation (2) is significantly positive only for
some j-th policy months near the end of the policy year, it indicates moral hazard instead of pure
adverse selection. Opportunistic fraud could be induced by the replacement cost endorsement.
endorsement (l=ND). If the estimated c ,,l j, l=ND in equation (2) is significantly positive only
for some j-th policy months occurring early in the policy year, this points to moral hazard instead
of pure adverse selection. Opportunistic fraud could thus be induced by the no-deductible
endorsement.
When the particular time pattern emerges, we distinguish opportunistic fraud from ex ante
moral hazard. According to the third hypothesis, we test the partial theft claim (k=p) for
replacement cost endorsement (l=R) as well as for no-deductible endorsement (l=ND). If
estimated c ,,l js in equation (2) for all twelve policy months (j1,...12) in the policy year are
insignificant, we can infer that the emerging claim timing patterns are evidence of opportunistic
fraud instead of ex ante moral hazard.
We now have to test the relationship between opportunistic fraud and the business cycle. We
can also test this relationship through a two-stage method. We keep the regression in the first
stage unchanged. We then add the business cycle index to the explanatory variables in the
regression of the second stage:
)) ( ˆ ( )) ( ˆ , , , 1 (cov Prob , , , , , , , , 2 2 2 jkit j l ec m jkit j l BC jkit j l C j l it jkit m jkit jkit it lit claim b o Pr Buscyc claim claim X claim b o Pr Buscyc claim claim X erage (3) m
Buscyc is the monthly business cycle index, which corresponds to each calendar month in
each year with a potential claim. In our paper, the claim records are ranged among 108 months
from January 2000 to December 2008, and are ranked from “0100” to “1208”.18 We match each of the claim dates in our sample to its corresponding calendar date, and find the corresponding
month for Buscyc . m Buscyc is introduced as an interaction term with m claimjki. The key
18
The first two codes of m represent the calendar month, and the second two codes of m represent the calendar year. For example, m=0100 is for the business cycle index of January 2000.
coefficients used to measure the relationship between opportunistic fraud and the business cycle
for contract l are BC ,,l js during some j-th policy months. According to our fourth hypothesis,
the opportunistic fraud rate could rise or decline with the recession according to either of the two
conflicting effects. If fraud is more severe in a recession, for high coverage contract representing
contracts with replacement cost endorsement, the BC ,,l js (l=R) in equation (3) should be
significantly negative only for those j-th policy months near the end of the whole policy year; for
high coverage contracts representing the no-deductible contract, the BC ,,l js (l=ND) in equation
(3) should be significantly negative only for those j-th policy months at some beginning months
of the policy year. This indicates that opportunistic fraud is more severe while the economy is in
a recession. Conversely, if the estimated BC ,,l js are significantly positive in the
above-mentioned policy months, this affirms that opportunistic fraud is more severe while the
economy is booming. Finally, if all the estimated BC ,,l js are insignificant, the business cycle has no impact on opportunistic fraud.
5. Empirical results
The first empirical task is to identify whether opportunistic fraud exists in the automobile
theft insurance market in Taiwan. We try to disentangle ex post moral hazard from adverse
selection and ex ante moral hazard.
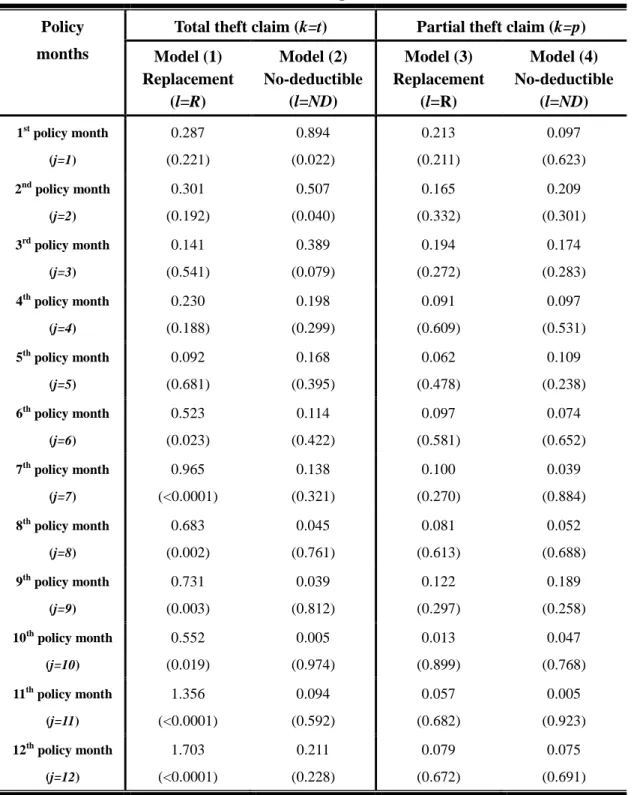
Table 3 shows that for total theft claims, the estimatedc ,,l js (l=R) are significantly positive
only after the sixth policy month of the contract in the subsample of replacement cost
endorsement contracts versus the reference contracts; the estimatedc ,,l js (l=ND) are
no-deductible endorsement contracts versus the reference contracts.19 The conditional
correlations between coverage and claims exhibit significant time patterns under both contracts
for total theft claims. The former finding is consistent with that of Dionne and Gagné (2002), and
supports our first hypothesis. The second finding sustains the particular condition in our second
hypothesis and its inference. Hence, these outcomes provide evidence only for the possible
existence of opportunistic fraud rather than adverse selection.
In the case of partial theft claims, all of the estimated c ,,l js are not significant in both
subsamples, meaning that the conditional correlations between coverage and partial theft claims
are all insignificant. These outcomes preclude the existence of ex ante moral hazard and confirm
the evidence of opportunistic fraud. Therefore, our third hypothesis is supported. All the
outcomes, which support the first to third hypotheses, confirm that opportunistic fraud is induced
by the two contract characteristics: replacement cost endorsement and no-deductible
endorsement.
Regarding the test associated with the business cycle, the empirical results of the estimated
coefficients of C ,,l j and BC ,,l j in the second stage are listed in Table 4.20 Because the test here is to identify the impact of the business cycle on opportunistic fraud, we need only test this
relationship for total theft claims.
19 There are 48 pairs of regressions when we test the conditional correlation between two dimensions of claim (total
theft claim as well as partial theft claim) and two dimensions of coverage (the coverage of contracts with
replacement cost endorsement as well as the coverage of contracts with no-deductible endorsement). It is redundant to report complete results for all 48 pairs of regressions. Hence, we display only 48 key estimated coefficients (c ,,l j) from the second-stage regression in Table 3, and report two examples of ensuing regression results in Appendix D.
20 There are 24 pairs of regressions when we test the relationship between business cycle and opportunistic fraud.
For similar reasons as before, it is redundant to report complete results for all 24 pairs of regressions. Hence, we display only the key estimated coefficients (C ,,l j and BC ,,l j) from the second-stage regression in Table 4, and report two examples of these coefficients in Appendix E.
Table 4 demonstrates that under replacement cost endorsement, all of the estimated BC ,,l js
(l=R) are negative and are significant only after the 10th policy month. The estimatedC ,,l js
retained their time pattern: they are significantly positive only for policy months near the end of
the first policy year. Under a no-deductible contract (l=ND), all the estimated BC ,,l js are still negative; they are significant only in the first two policy months. These outcomes mean that the
conditional correlation between coverage and claim is stronger when economic conditions are
deteriorating. The claim timing patterns for these types of contracts are reinforced by the business
cycle. Such empirical evidence is consistent with the hypothesis that opportunistic fraud
increases during a recession. The business cycle accentuates the timing pattern of the two
contracts.
6. Conclusion
The main goal of this paper was to investigate the impact of the business cycle on
opportunistic fraud. Few studies have associated the fraud problem with the surroundings, and
none have discussed the impact of the business cycle on the severity of fraud. We find that
opportunistic fraud is more severe during a recession.
We also test whether opportunistic fraud could be induced by different kinds of insurance
contracts. We confirm that there are particular time patterns for total theft claims induced by
replacement cost endorsement and no-deductible endorsement. We separate this evidence from
adverse selection. We also find that these particular claim timing patterns exist only in total theft
claims, as opposed to partial theft claims. This additional evidence serves to differentiate
opportunistic fraud from ex ante moral hazard. These conclusions corroborate the finding of
References
Artis, M., Ayuso, M., and Guillen, M., 2002, Detection of automobile insurance fraud with
discrete choice models and misclassified claims, Journal of Risk and Insurance 69: 325-340.
Bates, L. J., Mukherjee, K., and Santerre, R. E., 2010, Medical insurance coverage and health
production efficiency, Journal of Risk and Insurance 77: 211-229.
Bond, E. W., and Crocker, K. J., 1997, Hardball and soft touch: The economics of optimal
insurance contracts with costly state verification and endogenous monitoring costs, Journal
of Public Economics 63: 239-264.
Boyer, M. M., 2001, Mitigating insurance fraud: lump-sum awards, premium subsidies, and
indemnity taxes, Journal of Risk and Insurance 68: 403-436.
Boyer, M. M., 2004, Overcompensation as a partial solution to commitment and renegotiation
problems: the cost of ex post moral hazard, Journal of Risk and Insurance 71: 559-582.
Crocker, K. J. and Morgan, J., 1998, Is honesty the best policy? Curtailing insurance fraud
through optimal incentive contracts, Journal of Political Economy 106: 355-375.
Crocker, K. J. and Tennyson, S., 1999, Costly state falsification or verification? Theory and
evidence from bodily injury liability claims, in: C. Laberge-Nadeau and G. Dionne, eds.
Automobile Insurance: Road Safety, New Drivers, Risks, Insurance Fraud and Regulation
(Boston, Mass.: Kluwer).
Derrig, R., 2002, Insurance Fraud, Journal of Risk and Insurance 69: 271-287.
Dionne, G., 2000, The empirical measure of information problems with emphasis on insurance
fraud, in: Dionne, G., ed., Handbook of Insurance (Boston, MA: Kluwer Academic
Publishers).
Dionne, G., Giuliano, F., and Picard, P., 2009, Optimal auditing with scoring: Theory and
Dionne, G., Gouriéroux, C., and Vanasse, C. 2001, Testing for evidence of adverse selection in
the automobile insurance market: A comment. Journal of Political Economy 109(2):
444-455.
Dionne, G.. and Gagné, R., 2001, Deductible contracts against fraudulent claims: evidence from
automobile insurance, The Review of Economics and Statistics 83: 290-301.
Dionne, G.. and Gagné, R., 2002, Replacement cost endorsement and opportunistic fraud in
automobile insurance, Journal of Risk and Uncertainty 24: 213-230.
Husted, B. W., 1999, Wealth, culture, and corruption, Journal of International Business Studies
30: 339-359.
Picard, P., 1996, Auditing claims in the insurance market with fraud: The credibility issue,
Journal of Public Economics 63: 27-56.
Picard, 2000, Economic analysis of insurance fraud, in: Dionne, G., ed., Handbook of Insurance
(Boston, MA: Kluwer Academic Publishers).
Weiss, M. A., Tennyson, S. and Regan L., 2010, The effect of regulated premium subsidies on
insurance costs: an empirical analysis of automobile insurance, Journal of Risk and
Appendices
Appendix A: The relationship between Taiwan’s auto theft insurance loss ratio of non-commercial vehicles and GDP
Year Loss ratio GDP
1998 66.93 9,204,174 1999 62.67 9,649,049 2000 54.38 10,187,394 2001 56.64 9,930,387 2002 54.81 10,411,639 2003 49.55 10,696,257 2004 47.83 11,365,292 2005 45.87 11,740,279 2006 39.47 12,243,471 2007 35.72 12,910,511 2008 36 12,698,501 2009 36.83 12,512,678
Note: The yearly loss ratio data come from the Taiwan Insurance Institute. The yearly GDP data
come from the Directorate-General of Budget, Accounting and Statistics, Executive Yuan,
R.O.C. The unit of GDP is million NT dollars. We estimated the correlation coefficient
between the loss ratio and GDP for these twelve years. The correlation coefficient is
Appendix B: Opportunistic fraud under replacement cost endorsement
Assume that the consumer is risk-averse. The expected utility of an insured is equal to
) ( ) 1 ( ) ) ( ( A D g U W t h A W gU ,
where U is the utility function for the risk averse individual, W is the person’s wealth, not including the value of the vehicle, A is the market value of the vehicle at the beginning of the policy year, h(t) is the depreciation rate for the market value of the vehicle, which is an increasing function of time t, and t denotes the month of the policy year. is the discount rate when the fraudulent individual sells his vehicle on the black market, 0 1. D is the deductible specified in the contract. g is the probability of the fraud being successful.
The model assumes that the market value of the vehicle will be totally expropriated if the
fraudulent behavior of the individual is discovered by the insurance company. This causes the
wealth level of the fraudulent individual who is caught to be limited to W. The individual will defraud if
) ) ( ( ) ( ) 1 ( ) ) ( ( t h A W U W U g D A t h A W gU .
There exists a critical value of the probability (g~) at which there is indifference between being honest and dishonest:
) ) ( ( ) ( ) ~ 1 ( ) ) ( ( ~ t h A W U W U g D A t h A W U g .
Furthermore, this critical value of the probability of the fraud being successful is:
) ( ) ( ) ( ) ( ~ ) ( ) ( W U D A W U W U W U g t h A t h A .
The expected utility function of an individual who has a probability ( ) of engaging in fraudulent behavior can therefore be written as:
) ) ( ( ) 1 ( )] ( ) ~ 1 ( ) ) ( ( ~ [ t h A W U W U g D A t h A W U g EU .
The individual has a probability equal to one of engaging in fraud when the probability of the
fraud being successful is aboveg~. On the contrary, the individual has a probability equal to zero of engaging in fraud when the probability of the fraud being successful is below g~. In addition, there is a probability of fraud of between 1 and 0 when the probability of the fraud being
successful is equal to g~. To summarize, the probability of an individual engaging in fraud decreases with g~. As time increases: 2 ) ( ) ( ) ( ) ( )] ( ) ( [ )] ( )[ ( )] ( ) ( [ { ~ 2 W U D A W U D A W U W U W U dt g d t h A t h A t h A t h A ) ( } )] ( ) ( [ ) )( ( ) ( ) ( ) ( 2 t h W U D A W U W U t h A t h A t h A .
We restate the denominator (den) of the above equation as: ) ( ) (W () A D U W U den hAt , 2 ( ) ( ) ( ) 2 ( ) ( ) ( ) {[ ( ) ( )] ( ) ( ) [ ( ) ( )] ( )} '( ). A h t A A h t h t A A h t h t dg U W U W U W A D dt den U W A D U W U W h t
Because the incentive for an individual to engage in fraud is higher when
) ( ) ( ht A t h A AD
, the first set of square brackets is smaller than the second set in the above
equation, and the first derivative of the utility under W hAt AD
) (
is also smaller than the
corresponding derivative under W h(tA)
make the value inside the brackets negative. Moreover, h(t)0, hence the sign of the above equation ( dt g d~ ) is negative.
The above analysis infers that g~ will decrease with t, and that the probability will increase with t. Hence, the probability of individual () engaging in fraud is higher near the end of the policy year. If the audit probability of the insurance company is flat over the whole
Appendix C: Opportunistic fraud under the no-deductible contract
First, we examine whether the incentive of opportunistic fraud is higher under a
no-deductible endorsement.
We still assume the individual is risk-averse,
) ( ) 1 ( ) ) ( ) ( ( D g U W t k A t h A W gU .
Hence, the individual’s insurance contract is indemnified with depreciation. The depreciation
rate (k(t)) increases with time t. Furthermore, the depreciation rate from the indemnity of the insurance company (k(t)) is more stringent than that in the market (h(t)), i.e., k(t)h(t) and
) ( ) ( 2 2 () 1 ) ( 1 k t h t t h t
k t. The definitions of g , W, , and A are the same as those in the
model in Appendix B. The totally expropriated constraint is also the same as in Appendix B.
There exists a critical value of the probability (g~) of the fraud being successful at which there is indifference between being honest and dishonest:
) ) ( ( ) ( ) ~ 1 ( ) ) ( ) ( ( ~ t h A W U W U g D t k A t h A W U g .
Furthermore, this critical value of the probability of the fraud being successful is:
2 1 ) ( ) ( ) ( ) ( ) ( ) ( ) ( ~ W U D W U W U W U g t k A t h A t h A .
As the deductible increases:
0 ) ( ) ( ~ ) ( ) ( 2 2 1 U W D dD g d t k A t h A .
The above inequality means that the deductible increases, as does the critical value of the
probability of successful fraud, while the incentive to defraud decreases. Hence, people who
We also discuss the claim timing pattern for the contract with depreciation but without
deductible. The expected utility of an individual to defraud under such a contract is as follows:
) ( ) 1 ( ) ) ( ) ( ( g U W t k A t h A W gU .
There exists a critical value of the probability of the fraud being successful (g~) at which point the individual is indifferent between being honest and being dishonest:
) ) ( ( ) ( ) ~ 1 ( ) ) ( ) ( ( ~ t h A W U W U g t k A t h A W U g .
Furthermore, this critical value of the probability of the fraud being successful is:
) ( ) ( ) ( ) ( ~ ) ( ) ( ) ( W U W U W U W U g t k A t h A t h A .
The expected utility function of an individual who has the probability ( ) of engaging in fraud is therefore expressed as follows:
) ) ( ( ) 1 ( )] ( ) ~ 1 ( ) ) ( ) ( ( ~ [ t h A W U W U g t k A t h A W U g EU .
The individual has a probability of 1 of engaging in fraud when the probability of the fraud
being successful is above g~. On the contrary, the individual has a probability of 0 of engaging in fraud when the probability of the fraud being successful is below g~. Finally, the individual has a probability of fraud of between 1 and 0 when the probability of the fraud being successful equals
g~. To summarize, the probability of the individual’s engaging in fraud decreases withg~. As time increases: 2 ) ( ) ( ) ( ) ( ) ( )] ( ) ( [ ))] ( ) ( ( )[ ( )] ( ) ( [ ~ 2 2 W U W U t k t h W U W U W U dt g d t A t A t k A t h A t k A t h A t h A )] ( ) ( [ ) ( ) )( ( ) ( ) ( ) ( ) ( 2 W U W U t h W U t k A t h A t h A t h A .
We restate the denominator of the above equation as den U(W () k(At)) U(W)
t h
A
2 2 2 ( ) ( ) ( ) 2 ( ) ( ) ( ) ( ) ( ) ( ) 1 {[ ( ) ( )] ( )( ( ) ( )) ( ) [ ( ) ( )] ( )( ( ))}. A A A A A h t h t k t h t k t A A A A h t k t h t h t dg U W U W U W h t k t dt den U W U W U W h t
Here, the first set of square brackets is smaller than the second set of square brackets and the
first derivative of the utility function under () k(At) t h
A
W is smaller than the first derivative of
the utility under W h(tA). However, the term ( ( ) ( ))
2 2 () ) ( h t kt k t A t h A
could be higher than the
term (h(t)2h(t))
A , which makes the value inside the brackets ambiguous. If the value of is
large enough so that:
) ( ) ( ) ( )] ( ) ( [ ) ( )] ( ) ( [ 2 2 ) ( ) ( ) ( ) ( ) ( ) ( ) ( ) ( t h t k W U W U W U W U W U W U t h A t k A t k A t h A t h A t h A t k A t h A ,
the above condition will make the sign of
dt g d~
positive. This condition is especially true when
the depreciation for the indemnity provided by the insurance company is much higher than the
depreciation in the market, i.e., k(t) h(t) and ()2k (t) h(t)2h(t)
A t
k
A .
The above inference implies that while the vehicle depreciation from the insurer’s indemnity
is much more stringent than that in the market, if the incentive to cheat is large enough (the
discount on vehicles sold on the black market (1) is not too high), g~ will increase with t, and will decrease with t. Hence, the probability of individual ( ) engaging in fraud will be higher at the beginning of the contract period. If the probability of the insurance company
conducting an audit remains flat over the whole of the policy year, the equilibrium rate of fraud
may also be higher at the beginning of the policy year.
Lastly, we discuss the relative claim timing pattern for the contract with depreciation and
We consider the impact of timing on the incentive induced by the no-deductible endorsement.
In other words, we consider the impact of t on dDd~g . Let H dDdg~,
2 2 2 1 2 1 1 1 3 ( ) ( ) 2 1 2 ( ) 1 ( ) 2 ( ) ( ) ( ) ( ) ( ) ( )( ( )), A A h t k t A h t dH U R U R h t k t dt U R U R h t where R W kAt D t h A () () 1 , 2 h(t) A WR . The sign of this derivative is ambiguous.
Because the term before the plus sign is negative, the term after the plus sign is positive, and the
net value of these two terms are uncertain. Hence, if the term before the plus sign is larger than
the latter , the above equation is negative. This means that the degree of critical value of fraud
probability decreases from month to month during a policy year. In other words, the degree that
no-deductible endorsement contracts create a relatively higher incentive to defraud decreases
over time. This corresponds to the second part of our second hypothesis, which states that the
probability of fraud (for no-deductible endorsement contracts) is higher at the beginning of the
Appendix D: Complete empirical results of the 12th policy month of Model (1), and the 1st policy month of Model (2)
Variables
12th policy month in model (1) 1st policy month in model (2)
1st stage 2nd stage 1st stage 2nd stage Estimate P-value Estimate P-value Estimate P-value Estimate P-value
Intercept -17.253 0.890 -0.481 <.0001 -18.772 0.845 -0.561 <.0001 clm_hat 0.121 0.063 1.972 0.001 clm_1 1.703 <.0001 0.894 0.022 sexf -0.065 0.087 0.129 <.0001 -0.138 <.0001 0.226 0.008 marria_ 0.067 0.290 -0.288 <.0001 -0.037 0.547 0.087 0.001 age1 4.402 0.001 -0.812 0.036 3.379 0.995 -7.157 0.001 age2 4.241 0.003 -0.398 0.293 3.085 0.995 -6.724 <.0001 age3 3.957 0.007 -0.193 0.596 2.852 0.996 -6.411 <.0001 age4 3.978 0.007 -0.228 0.534 2.883 0.996 -6.472 <.0001 age5 -0.997 0.999 0.312 0.252 2.809 0.996 -6.231 <.0001 carage0 0.673 0.011 0.164 <.0001 0.285 <.0001 -0.768 <.0001 carage1 0.377 0.002 0.339 <.0001 0.257 <.0001 -0.340 0.032 carage2 0.233 0.004 0.340 <.0001 0.256 <.0001 -0.454 0.004 carage3 -0.032 0.771 0.265 <.0001 0.200 0.006 -0.361 0.004 carage4 0.171 0.070 0.160 <.0001 0.157 0.045 -0.300 0.002 city 0.100 0.009 -0.303 <.0001 0.083 0.041 -0.169 0.001 north -0.143 0.003 0.931 <.0001 -0.295 0.000 0.565 0.002 south 0.045 0.340 -1.298 <.0001 -0.089 0.055 0.162 0.004 east -0.327 0.093 -1.283 <.0001 -0.060 0.591 0.345 <.0001 tramak_n -0.021 0.943 0.776 <.0001 -5.230 0.988 10.338 0.001 tramak_f -0.058 0.386 -0.468 <.0001 -0.094 0.178 0.086 0.149 tramak_h 0.176 0.003 -0.172 <.0001 0.204 <.0001 -0.469 <.0001 tramak_t -0.081 0.073 1.205 <.0001 -0.056 0.254 -0.094 0.008 tramak_c 0.180 0.006 -0.209 <.0001 0.079 0.228 -0.200 0.021 catpcd_1 0.356 0.014 0.798 <.0001 0.022 0.820 -0.617 0.003 catpcd_2 0.457 0.023 -0.548 0.003 0.307 0.023 -0.334 0.019 vehcc_s -0.031 0.879 -0.237 0.147 -0.028 0.879 -0.512 0.008 channel_D -0.002 0.913 -0.688 0.006 -0.007 0.801 -0.341 0.011 channel_R -0.082 0.213 0.439 0.012 -0.069 0.277 0.397 0.010 channel_T 0.019 0.233 -0.511 0.006 0.013 0.201 -0.486 <.0001
channel_L -0.071 0.308 -0.398 0.017 -0.054 0.429 -0.217 0.020 channel_F 0.009 0.879 -0.487 0.021 0.011 0.711 -0.610 0.005 channel_A -0.121 0.137 -0.508 0.010 -0.175 0.168 -0.113 0.042 y_2000 0.217 0.781 -1.021 <.0001 0.303 0.500 0.998 <.0001 y_2001 0.268 0.645 1.130 <.0001 0.191 0.712 0.716 <.0001 y_2002 0.277 0.598 -1.044 <.0001 0.301 0.511 0.823 <.0001 y_2003 0.262 0.523 -1.211 <.0001 0.198 0.698 0.645 <.0001 y_2004 0.227 0.618 1.037 <.0001 0.288 0.516 0.811 <.0001 y_2005 0.213 0.790 -1.002 <.0001 0.192 0.689 0.930 <.0001 y_2006 0.298 0.433 -0.581 <.0001 0.411 0.322 0.752 <.0001 Hausman test 2.83 1.97 2.07 1.33
Note : In model (1), we estimate the conditional correlation between total theft claim and the contract coverage replacement cost endorsement.
In model (2), we estimate the conditional correlation between total theft claim and the contract coverage no-deductible endorsement.
We applied the Hausman test and did not reject the random effect model. The computed chi-square statistics are reported in the table.
Appendix E: Complete empirical results of the 12th policy month of Model (1’), and the 1st policy month of Model (2’)
Variables
12th policy month in model (1’) 1st policy month in model (2’)
1st stage 2nd stage 1st stage 2nd stage Estimate P-value Estimate P-value Estimate P-value Estimate P-value
Intercept -17.253 0.890 -0.875 <.0001 -18.772 0.845 -0.766 <.0001 clm_hat 2.836 0.524 5.448 0.481 clm_1 15.000 0.025 9.276 0.018 clm*Buscyc -0.148 0.038 -0.093 0.016 sexf -0.065 0.087 0.011 <.0001 -0.138 <.0001 -0.861 0.421 marria_ 0.067 0.290 -0.537 <.0001 -0.037 0.547 -0.190 0.536 age1 4.402 0.001 -12.562 0.145 3.379 0.995 22.629 0.362 age2 4.241 0.003 -11.727 0.907 3.085 0.995 21.096 0.436 age3 3.957 0.007 -10.872 0.644 2.852 0.996 19.963 0.489 age4 3.978 0.007 -10.929 0.670 2.883 0.996 20.050 0.484 age5 -0.997 0.999 2.345 0.921 2.809 0.996 20.099 0.491 carage0 0.673 0.011 -1.394 <.0001 0.285 <.0001 1.296 0.550 carage1 0.377 0.002 -0.907 <.0001 0.257 <.0001 1.101 0.573 carage2 0.233 0.004 -0.720 <.0001 0.256 <.0001 1.133 0.562 carage3 -0.032 0.771 0.007 <.0001 0.200 0.006 1.028 0.505 carage4 0.171 0.070 -0.609 <.0001 0.157 0.045 0.494 0.677 city 0.100 0.009 -0.425 <.0001 0.083 0.041 0.415 0.517 north -0.143 0.003 1.472 <.0001 -0.295 0.000 -1.507 0.508 south 0.045 0.340 -0.594 <.0001 -0.089 0.055 -0.554 0.430 east -0.327 0.093 -0.011 <.0001 -0.060 0.591 -0.389 0.458 tramak_n -0.021 0.943 0.868 <.0001 -5.230 0.988 -34.947 0.997 tramak_f -0.058 0.386 -0.038 <.0001 -0.094 0.178 -0.477 0.521 tramak_h 0.176 0.003 -1.222 <.0001 0.204 <.0001 1.230 0.440 tramak_t -0.081 0.073 0.940 <.0001 -0.056 0.254 -0.445 0.332 tramak_c 0.180 0.006 -0.491 0.017 0.079 0.228 0.387 0.502 catpcd_1 0.356 0.014 0.836 <.0001 0.022 0.820 -0.745 0.002 catpcd_2 0.457 0.023 -0.620 <.0001 0.307 0.023 -0.869 <.0001 vehcc_s -0.031 0.879 -0.125 <.0001 -0.028 0.879 -0.238 <.0001 channel_D -0.002 0.913 -0.701 0.001 -0.007 0.801 -0.544 0.002
channel_R -0.082 0.213 0.537 0.007 -0.069 0.277 0.312 0.011 channel_T 0.019 0.233 -0.562 0.007 0.013 0.201 -0.076 0.065 channel_L -0.071 0.308 -0.427 0.010 -0.054 0.429 -0.297 0.114 channel_F 0.009 0.879 -0.672 0.006 0.011 0.711 -0.581 0.003 channel_A -0.121 0.137 -0.629 0.005 -0.175 0.168 -0.267 0.218 y_2000 0.217 0.781 -1.345 <.0001 0.303 0.500 0.839 <.0001 y_2001 0.268 0.645 1.394 <.0001 0.191 0.712 0.764 <.0001 y_2002 0.277 0.598 -1.907 <.0001 0.301 0.511 1.011 <.0001 y_2003 0.262 0.523 -1.720 <.0001 0.198 0.698 0.876 <.0001 y_2004 0.227 0.618 1.007 <.0001 0.288 0.516 0.882 <.0001 y_2005 0.213 0.790 -1.609 <.0001 0.192 0.689 0.988 <.0001 y_2006 0.298 0.433 -0.425 <.0001 0.411 0.322 1.032 <.0001 Hausman test 2.83 2.05 2.07 1.98
Note : In model (1’), we estimate the conditional correlation between total theft claim and the contract coverage replacement cost endorsement.
In model (2’), we estimate the conditional correlation between total theft claim and the contract coverage no-deductible endorsement.
We applied the Hausman test and did not reject the random effect model. The computed chi-square statistics are reported in the table.
Table 1 Definitions of variables Variable Definition
claim_jkit
A variable that equals 1 when policy-holder_i has filed a k-type theft claim in the j-th month during the policy year t, j=1 to 12, k=t or p, (t means total theft, and p means partial theft), and 0 otherwise.
cvrgcd_H A variable that equals 1 when the theft insurance contract has a replacement cost endorsement, and 0 otherwise.
cvrgcd_HH A variable that equals 1 when the theft insurance contract is a no-deductible contract, and 0 otherwise.
sexf A variable that equals 1 if the insured is female, and 0 otherwise. marria_ A variable that equals 1 if the insured is married, and 0 otherwise.
Age2025 A variable that equals 1 if the insured is between the ages of 20 and 25, and 0 otherwise.
age2530 A variable that equals 1 if the insured is between the ages of 25 and 30, and 0 otherwise.
age3060 A variable that equals 1 if the insured is between the ages of 30 and 60, and 0 otherwise.
age6070 A variable that equals 1 if the insured is between the ages of 60 and 70, and 0 otherwise.
ageabove70 A variable that equals 1 if the insured is over 70 years old, and 0 otherwise. carage0 A variable that equals 1 when the car is under one year old, and 0
otherwise.
carage1 A variable that equals 1 when the car is one year old, and 0 otherwise. carage2 A variable that equals 1 when the car is two years old, and 0 otherwise. carage3 A variable that equals 1 when the car is three years old, and 0 otherwise. carage4 A variable that equals 1 when the car is four years old, and 0 otherwise. city A variable that equals 1 when the owner of the car lives in a city, and 0
otherwise.
North A variable that equals 1 when the car is registered in the north of Taiwan, and 0 otherwise.
south A variable that equals 1 when the car is registered in the south of Taiwan, and 0 otherwise.
east A variable that equals 1 when the car is registered in the east of Taiwan, and 0 otherwise.