HAL Id: dumas-00413147
https://dumas.ccsd.cnrs.fr/dumas-00413147
Submitted on 3 Sep 2009HAL is a multi-disciplinary open access
archive for the deposit and dissemination of sci-entific research documents, whether they are pub-lished or not. The documents may come from
L’archive ouverte pluridisciplinaire HAL, est destinée au dépôt et à la diffusion de documents scientifiques de niveau recherche, publiés ou non, émanant des établissements d’enseignement et de
Lessening bus journey times on congested road
infrastructures: micro-modelling methodology. Case
study in the region of Liverpool, United Kingdom
Gaël Thorrignac
To cite this version:
Gaël Thorrignac. Lessening bus journey times on congested road infrastructures: micro-modelling methodology. Case study in the region of Liverpool, United Kingdom. Business administration. 2008. �dumas-00413147�
LESSENING BUS JOURNEY TIMES ON
CONGESTED ROAD INFRASTRUCTURES:
MICRO-MODELLING METHODOLOGY
CASE STUDY IN THE REGION OF LIVERPOOL, UNITED KINGDOMGaël THORRIGNAC
Master professionnel Transports Urbains et Régionaux de Personnes
Memoir defended on September 5th, 2008
Examiners: Patrick Bonnel (LET, ENTPE) Sonal Ahuja (Mott MacDonald)
Publication data form
[Entitled of Diploma]Master Degree Diploma in Urban and Regional Passenger Transport Studies
[Supervision by authorities]
- Université Lumière Lyon 2
- Ecole Nationale des Travaux Publics de l'Etat (ENTPE)
[Title]
Lessening bus journey times on congested road infrastructures: micro-modelling methodology.
[Subtitle]
Case study in the region of Liverpool, United Kingdom.
[Author]
Gaël Thorrignac
[Members of the Jury (name and affiliation)]
Patrick Bonnel (Laboratoire d’Economie des Transports, ENTPE) Sonal Ahuja (Mott MacDonald Ltd)
Christine Buisson (LICIT, ENTPE)
[Place of training]
Mott Mac Donald Ltd, Birmingham office Canterbury House
85 Newhall Street
Birmingham B3 1LZ, United Kingdom
[Summary]
Within the framework of their Local Transport Plan (LTP), a five-year transport programme running until 2011, authorities of the British Metropolitan County of Merseyside are seeking for ways to provide their territory with a safer, more reliable and more sustainable transport network. The key target is to mitigate congestion on the strategic road infrastructures, through a significant lessening of global journey times. In that purpose, elaborate microsimulation models are required to be built for eleven representative roads of the county, allowing to carry out relevant traffic testing and further analyses.
This document deals with one of the key routes’ modelling process: the A552 corridor of Birkenhead, one of Liverpool’s neighbouring cities. It depicts precisely the utter building methodology which was has been used to lead to a reliable and highly detailed model, from the preliminary context study to the final model validation, and allows to observe how meticulous and painstaking the procedure must be.
The work’s ultimate aim reckons bus users in particular: a range of options and scenarios testing will be subsequently achieved, to find out possible improvements regarding bus journey times. These tests, that will be reviewed through later reports, will be made possible thanks to the model considered in this document.
[Key Words]
Micro-modelling Model building
Transport demand estimation Model calibration/validation Data analysis
Distribution statement :
- Paper : [yes / no]* - Electronic : [yes / no]*
(* Scratch the useless mention)
Declassification date : non-confidential
Fiche bibliographique
[Intitulé du diplôme]Master Professionnel Transports Urbains et Régionaux de Personnes (TURP)
[Tutelles]
- Université Lumière Lyon 2
- Ecole Nationale des Travaux Publics de l'Etat (ENTPE)
[Titre]
Réduire les temps de parcours des bus sur routes congestionnées : méthodologie de micro-modélisation.
[Sous-titre]
Etude de cas dans la région de Liverpool, Royaume-Uni.
[Auteur]
Gaël Thorrignac
[Membres du Jury (nom et affiliation)]
Patrick Bonnel (Laboratoire d’Economie des Transports, ENTPE) Sonal Ahuja (Mott MacDonald Ltd)
Christine Buisson (LICIT, ENTPE)
[Nom et adresse du lieu du stage]
Mott Mac Donald Ltd, Birmingham office Canterbury House
85 Newhall Street
Birmingham B3 1LZ, United Kingdom
[Résumé]
Dans le cadre de leur Plan Local de Transport (PLT), un programme de cinq ans destiné aux transports courant jusqu’en 2011, les autorités du comté métropolitain britannique de Mersyside recherchent des solutions visant à doter leur territoire d’un réseau de transport plus sûr, plus fiable et plus durable. L’objectif principal est de parvenir à maîtriser la congestion, au moyen d’une baisse significative des temps de parcours globaux. Dans cette optique, des modèles de microsimulation doivent être élaborés pour onze routes représentatives du comté, afin de pouvoir procéder aux tests de trafic et aux analyses nécessaires.
Ce document est dédié au processus de modélisation de l’une des routes clés : le corridor de l’A552 de Birkenhead, une des villes voisines de Liverpool. Il décrit précisément toute la méthodologie employée en vue de parvenir à un modèle fiable et hautement détaillé, depuis l’étude de contexte préliminaire jusqu’à la validation finale du modèle, et permet d’observer à quel point la procédure doit être minutieuse et soignée. Le but ultime de ce travail concerne les usagers de bus en particulier : une série de tests basés sur différentes options et scénarios sera achevée ultérieurement, afin de déterminer les améliorations possibles concernant les temps de parcours des bus. Ces tests, qui seront passés en revue au travers de rapports subséquents, seront réalisables grâce au modèle considéré dans ce document.
[Mots clés]
Micro-modélisation Construction de modèle
Estimation de la demande de transport Calibrage/validation de modèle Analyse de données
Diffusion :
- papier : [oui/non]* - électronique : [oui/non]*
(* : Rayer la mention inutile)
Confidentiel jusqu'au : non confidentiel [Date de publication] [Nombre de pages] [Bibliographie (nombre)]
Acknowledgements
I would like to thank the whole of the Birmingham Integrated Transport office staff for their friendly welcome, their pleasant presence and their continuous support.
A special thank to Sonal Ahuja, for allowing me to experience this very enriching opportunity in United Kingdom, for the trust and the support.
And, obviously, a particular thank to the entire modelling team of the office for its support, its patience, and its unceasing good humour.
Summary
Publication data form ... 3 Fiche bibliographique ... 5 Acknowledgements... 7 Introduction... 11 Part 1. The metropolitan county of Merseyside: geographical, political, demographic, and economic specificities... 151.1. A sub-national territory with scattered political governance ...15
1.2. Economic growth and expected demographic regeneration echoing local attractiveness ...17
1.3. The Wirral Metropolitan Borough and its core Birkenhead...20
Part 2. Transport systems and travelling behaviours across the Birkenhead area... 26
2.1. Transport infrastructures and services ...26
2.2. Heavy transport demand and domination of the car...29
2.3. Road transport system limitations ...34
Part 3. Modelling the network with the microsimulation package ... 40
3.1. VISSIM: a robust microsimulation tool...40
3.2. The model building process ...41
3.3. Limitations of the procedure...68
Part 4. Estimating the transport demand for the model ... 72
4.1. Transport network reproduction in VISUM ...72
4.2. Creation of trips evaluation matrices...79
4.3. Calibration of the pre-matrices, and calibration/validation of the VISSIM model ...89
4.4. Limitations of the process ...100
Conclusion ... 104
Table of contents ... 111 Table of figures and illustrations... 113 Table of appendices ... 117
Introduction
This document is reporting on the work carried out within the framework of a project ordered by the metropolitan county of Merseyside, United Kingdom. This political and geographical entity, which includes five metropolitan boroughs adjoining the River Mersey Estuary in the North West part of England embraces, according to the mid-2006 Office of National Statistics (ONS) estimates, more than 1,400,000 inhabitants. Its core, the city of Liverpool, is a major economic centre gathering about 400,000 dwellers and constituting an agglomeration area of about 800,000 inhabitants. These characteristics make Liverpool one of the five most populated cities of the United Kingdom and a part of the ten most important urban areas of the country along with London, Birmingham, Manchester, Leeds, and Glasgow.
Merseyside decision-makers have to deal with the recent Government’s Public Service Agreement (PSA), published in 2004 for the 2005-2008 period. This fundamental agreement implements new objectives for all strategic public services such as education, health, defence, environment, justice, culture, and obviously transport. The Government’s commitment is basically aimed at providing services able to sustain economic growth, while seeking to improve their efficiency and, when relevant, make them more respectful to the environment.
Each Department of the Government has received specific instructions related to its field of intervention. The Department for Transport (DfT) has hence encouraged the authorities of the main urban areas to introduce a Local Transport Plan (LTP) that must be applied locally, on counties, boroughs and urban agglomerations scales. The first global recommendation expressed by the government entity regarding these LTP is to make journeys more reliable on the strategic road network.
Merseyside, following the Government’s policies, has also published a five year Local Transport Plan which is running until 2011 : this £230m delivery programme of transport investment and service improvements aims to give Merseyside a safer, sustainable, efficient and integrated transport network, accessible to all users. The partnership, whose plans include all available means of transport within the local territory (cars, buses, trains, motorcycles, bikes, pedestrians) includes the submission of new plan to the Government every five years. Thus Merseyside’s general vision of transport system for the future is “a fully integrated safe transport network, which supports economic and social regeneration and ensures good access for all, and which is operated to the highest standards to protect the environment and ensure quality of life”.
Among the huge amount of factors which determine whether a transport system is reliable or not, the road congestion monitoring takes up a privileged place in the eyes of Merseyside authorities. A network penalized by unceasing saturation
deterioration of the quality of life in the area when considering, in the middle of other undesired consequences, the rise of green house gases rejected in the atmosphere in situation of saturated traffic.
Given these congestion mastery preoccupations, the central variable that will be used throughout the study will be the journey times. Journey times, either considered globally for all the users of the network, or at the scale of defined users classes (motorists, public transport users, motorcyclists, cyclists, pedestrians) inform in a very relevant way of the saturation level on the road infrastructures. They represent an inescapable lever within the framework of implementing policies aimed at allowing more fluid trips in a more effective and reliable network.
The journey times are obviously expected to be as low as possible in the context of the Merseyside LTP’s congestion monitoring purpose. But from the last twenty years, according to diverse local and national statistics, the number of trips made within and around the area has been rising significantly, car ownership and use has been progressing linearly, while travelled distances have been increasing in certain areas of the county, resulting in a global traffic rise on the main roads. Travel demand is reaching, and probably going beyond the major transport infrastructures’ maximum capacity. Therefore current global journey times are no longer deemed satisfying enough to cope with the new reliability and effectiveness recommendations.
The main target of the Liverpool area LTP is then to reduce journey times for all users of the road infrastructures. A national congestion target has then been set over the LTP period, which applies to the country’s ten largest urban areas. The target is a measure of average person journey time on a number of selected highway routes within the areas. In Merseyside, eleven routes were selected to represent the area’s most congested infrastructures. As part of the current LTP, journey times on the eleven routes are monitored and reported on annually. The Dft requires each urban area to demonstrate how the target was to be met, and detailed models are hence being built for the key routes in order to allow for testing of the most effective means of influencing journey times, in case of varying and unpredictable traffic changes.
The report will be focusing on one of these key routes, whose model has to be built in its entirety to be able to respond to the study’s objectives. This route is the 4.2 km (2.6 miles) long main corridor of the Wirral’s District city of Birkenhead, located in one of the five districts the Merseyside perimeter holds. The infrastructure, designated as A552 in the UK road nomenclature, joins Birkenhead and its agglomeration, the second most populated in Merseyside after Liverpool’s (more than 300,000 inhabitants from the latest ONS Census in 2001), to the Liverpool area.
The document will be markedly dealing with one specific user class among the totality of the infrastructure’s users: public transport passengers. The corridor is currently crossed by a consequent number of bus services, allowing their patronage
District statistics, how regular has been the drop-off slope of bus services use in the area from the last twenty years, while the car modal part increased exponentially.
The likely last decades’ bus travel times enhancements and loss of competitiveness against other means of transport, correlated with the substantial traffic and congestion rises on major roads, are obviously not the only reason of the slumping plebiscite of public transport. But attempting to reduce global bus journey times, crucial criterion of the bus services’ effectiveness, could allow making public transport trips much more attractive in the eyes of their current and potential users.It is important to remain considering the huge potential demand which exists for these services, a demand that needs to be better still encouraged by providing competitive performances. This issue constitutes then a particular stake of the project, whose purpose is ultimately to try to demonstrate how bus journey times can be affected to become decreasingly long, even on a congested infrastructure, in order for Merseyside decision-makers to finally know their range of relevant actions.
To allow carrying out the appropriate traffic testing, and achieving all necessary analyses regarding buses operations, the study area needs to be meticulously reproduced with relevant tools. The virtual replication of real and complex interactions between different vehicle types is indeed possible, through a highly thorough procedure, supposed to lead finally to a valid and trustful microsimulation.
This document will hence be exclusively devoted to the various stages that have ended at the Birkenhead corridor model’s validation. It will be reviewing the whole methodology used from the very first stage to the last one: all building steps, necessary databases, assumptions decided and justifications. It will also pay a constant attention to the local context within which the study takes place. The ultimate objective is to demonstrate how such a replication can be made reliable enough to cope with the elaborate forthcoming testing (whose description will not be included in this work, as they will be the subjects of subsequent reports to deliver once all eleven routes’ models will be achieved).
The document will be divided into four parts. The first will be situating the study in its geographical environment, and focus on Merseyside’s geographical, political, economic and demographic characteristics. The second will be dealing exclusively with the different transport systems available over the Birkenhead area, and will be pointing out its dwellers’ global behaviours regarding transport. As for the third and fourth parts, these chapters will be concerning the utter model building procedure: part three will be focusing on the virtual reproduction stages carried out in the microsimulation software, when part four will be describing precisely the transport demand estimation that will be used in the model over the subsequent testing.
Part 1. The metropolitan county of Merseyside: geographical, political,
demographic, and economic specificities
The metropolitan county of Merseyside is one of the five counties comprised in the North West region of the United Kingdom, along with Cheshire, Cumbria, Greater Manchester and Lancashire (Map 1). This region is the third most populated amongst the country’s twelve areas with 6,853,200 inhabitants1, after the South East (8,237,800)
and London (7,512,400) regions. Its density of population (475 persons per square kilometre) is the second highest, far from London’s 4,758/km² huge rate.
Map 1: Merseyside and the North West region of the United Kingdom
Sources: http://www.autoindustry.com, http://www.conferences-uk.org.uk
In this part of the document, Merseyside territory and population will be depicted, as well as its governance system and economic characteristics. The District of Wirral which houses the city of Birkenhead, core place of the study, will be particularly observed.
1.1. A sub‐national territory with scattered political governance
In the United Kingdom, counties are the second tier of the sub-national geographical split, after the regions. Each region is divided into several counties whose types can be either metropolitan or non-metropolitan. Only six metropolitan
200 km N
counties are numbered in the country, constituting a largely underrepresented group in the midst of all the bodies as they cover the main urban areas of the national territory (e.g. Liverpool, Manchester, Leeds or Birmingham, whereas London is covered by the Grater London region).
As far as Merseyside is concerned, its surface area embraces five districts, also called metropolitan boroughs: Liverpool, Knowsley, St Helens, Sefton and Wirral (Map 2).
Map 2: The Merseyside territory
Source: www.britishservices.co.uk
Even though Merseyside is existing as a geographically delimited territory, created in 1974 after the publication of the Local Government Act of 1972 and still registered in law, the area is nowadays devoid of political authority: its former executive arm, the Merseyside County Council, has been abolished in 1986 along with all other county councils under the Margaret Thatcher’s Government. Most of the county’s functions have then been transferred to the metropolitan boroughs, making them unitary authorities managing the local public life as part of a one-tier administration (replacing the former two-tier system, with the county council sharing its functions with the district councils). The remaining county-level services, like police, fire and rescue, or waste treatment, are now taken over by a joint-board administration shared by councillors from the five districts. Public transport organization and development are also still administered on the Merseyside scale, with the Merseyside Passenger Transport Authority managing the local public transport brand: the Merseyside Passenger Transport Executive (MPTE, or
Birkenhead Liverpool Kirkby St Helens Southport WIRRAL LIVERPOOL KNOWSLEY ST HELENS SEFTON N 5 km
1.2. Economic growth and expected demographic regeneration echoing
local attractiveness
In their latest economic review2, Merseyside political actors are delighted to
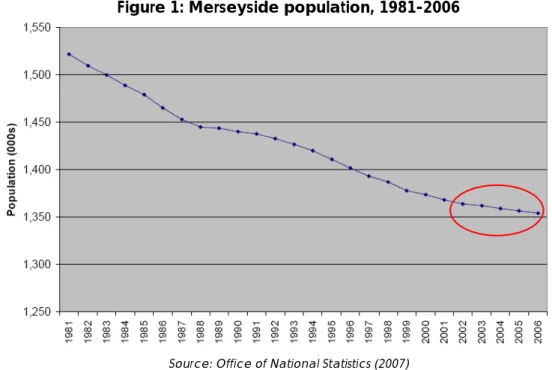
claim the county currently shows evidences of growth and investment. Key indicator of economic vitality, Merseyside population has again maintained a very slight decrease in 2006 from the ONS mid-2006 estimates, consolidating hopes of a long-term demographic improvement in this county embracing presently 1,353,600 dwellers (Figure 1). After the late 20th century’s consequent outflows, which have
seen population total plummet from 1,718,000 in 19713 to 1,368,000 in 2002 and
reflect local economic weaknesses, current statistics evidence regional attractiveness has been showing steady signs of progression since then. This emigration decline is actually led by a substantial rise of the young working age population (according to the ONS, working age population refers to men aged 16 to 64 and women aged 16 to 59), especially the 20-24 age-band, expressing the ongoing interest from students and young workers towards the Liverpool region.
Figure 1: Merseyside population, 1981-2006
Source: Office of National Statistics (2007)
2 Merseyside Economic Review 2007: Summary Report, The Mersey Partnership, Liverpool,
The age-bands whose quantity has been slumping the most significantly are the under-15 and, in a much more consequent way, the 30-39. The outflows observed for this people are expected to be offset by the important working age population’s arrivals, but local authorities are nevertheless concerned about knowing how to preclude the exodus of the 30-39, which have dropped by 11% between 2003 and 2005. In comparison, the North West region experienced a 9% decrease for this age-class over the same time period. This figures suggest people are rather massively leaving Merseyside at certain career or life points, seeking for still more attractive regions for professional or private purposes.
This issue does not darken the global positive observations regarding Merseyside’s economic situation, all the more since its Gross Value Added (GVA, equivalent to the Gross Domestic Product plus the difference between taxes and subsidies on products) has grown by 5.6% from 2003 to 2004, reaching £16.1bn according to the authorities. Just beneath the North West region (5.7% growth) and the United Kingdom (5.9% growth) performances, the Liverpool region’s figure shows the gap separating Merseyside from the rest of the country is more narrow than it has ever been, mainly due to a very strong 2000-2003 period (disappointingly followed by a reversal this very recent years). And the individual output, the GVA per head, has even grown as much as the UK’s one (5.5% between 2003 and 2004, to hit £12,448) and marginally faster than the North West’s one (5.4%). These encouraging values result from the range of Merseyside and its districts decision-makers’ policies intended to attract firms and investors, which have been conducted from several years.
As far as the employment is concerned, Merseyside still shows itself fairly competitive: even though it has risen by 0.3% from late-2005 to late-2006, the unemployment rate was maintained at a low level of 4.1% at the end of 2006. As the next figure shows, Merseyside experienced a regular slumping unemployment rate over its efficient 2000-2004 period before observing slightly higher figures from then on (Figure 2). But the current unemployment situation remains anyway conspicuously better than the 2000 one.
Figure 2: Merseyside unemployment rate, 2000-2006
Merseyside unemployment rate is actually equivalent to roughly 37,000 persons. Its 4.1% figure remains appearing less competitive than North West (2.7%) and UK (2.5%) statistics, which still provides local political actors with the same stakes regarding the Liverpool region’s economic efficiency.
Local employment statistics also show evidences of Merseyside’s economic vitality (Figure 3): still reflecting the narrowing gap between the river Mersey districts one the hand, and the North West region and the UK on the other hand, figures show a local working age population in employment increasingly high, reaching 68.2% in 2005 (compared to the 67.3% count of 2003) when the UK rate fell slightly to 74.3 % and the North West’s one was maintained in the vicinity of 72.6 %. And the economic rate, which reckons the working people added to those unemployed but seeking work and available to work (and also the students having paid employment), amongst all working age persons, attains 73.1% in Merseyside, close to the North West’s 76.5% and the UK’s 78.3%. This allows Merseyside authorities reveling in the fact they are managing to bring levels of economic activity vibrancy up to the national figures.
Figure 3: Employment and economic activity Rates, 2006
Source: Office of National Statistics (2007)
In terms of employments and people gatherings, the county’s major area is the city of Liverpool and its suburbs: 436,100 inhabitants are grouped within the Liverpool borders according to the ONS’ 2006 estimates, and about 816,000 dwellers in the whole Liverpool Urban Area (which includes the contiguous built-up area beyond Liverpool on the eastern side of the river Mersey, in the Boroughs of Knowsley, Sefton, St Helens and even the outer-Merseyside District of Haydock). In the city of Liverpool, whose most representative age class are the 15-29 (23%), the 30-44 (22%), and the 45-59 (17%), it emerges that roughly 97% of the persons are living in households (against only 3% in communal establishments) and are sharing a relatively stretched urban space.
(15%), manufacturing (11%) and education (10%). Its £5.6bn4 GVA is the first in
Merseyside, and its GVA per head experienced the fastest growth within the county in increasing by 5.7% from 2003 to 2004. Liverpool represents now 125% of the Merseyside average GVA per head and 103.6% of the North West average.
1.3. The Wirral Metropolitan Borough and its core Birkenhead
As the study is particularly focused on the area of the Birkenhead city, it is incumbent upon this report to draw the local demographic and economic trends.
As mentioned before, the District of Wirral, despite an indisputable geographical closeness to the Liverpool Urban Area, is not considered as a member of this urban area. The River Mersey flow between these domains creates two distinct geographical spaces with their proper economic and socio-demographic statistics (Map 3).
Map 3: The Wirral territory and the neighbouring city of Liverpool
Source: http://maps.live.com
Wirral population bore a fast slump over the end of the 20th century, in the same
proportions as the whole Merseyside county but like Merseyside, the drop seems now slowing and leveling off with apparent signs of improvements (Figure 4). The descending population slope is indeed more smooth in the recent years than in the 90’s, and even if the last two years’ disappointing ONS figures have thwarted hopes
Ellesmere Port
N 3 km
of a short-term progression, a more populated future is still expected on a longer time period.
Figure 4: Wirral population, 1981-2006
Source: Office of National Statistics (2007)
With its current 311,200 inhabitants, Wirral represents 23% of Merseyside population. When compared with the other boroughs of the county, the Birkenhead district, despite the regular persons outflows, yet appears as the second most inhabited of Merseyside after Liverpool and its 2005-2006 decrease rate is actually situated in the middle range of the global county’s values (Table 1).
Table 1: Population - Merseyside district’s comparison, 2005-2006 Year Wirral Merseysid
e Liverpoo l Sefton St Helens Knowsle y 2005 312,000 1,367,400 447,500 280,900 176,200 149,400 2006 311,000 1,353,600 436,100 277,500 177,600 151,300 % change 2005-2006 -0.4% -1.2% -2.6% -1.26% 0.79% 1.26%
Source: Office of National Statistics (2007)
Concerning local output, Wirral’s GVA per head reached £9,891 in 2004, 58% of the UK’s one. With this statistic the borough appears the less productive in Merseyside, all the more since it showed the lower rate of growth between 2003 and 2004 with 4.7% (Table 2). But it is to remind that GVA figures are workplace based rather than residence based: if Wirral has significant out-commuting, which is likely to happen regarding the noteworthy amount of employment opportunities within and
around Merseyside, the economic wealth generated by these residents who work in other boroughs is captured there, rather than in their home location.
Table 2: GVA per head - Merseyside district’s comparison Growth
2003-2004 Value 2004
Indexed to UK
Liverpool 5.7% £15,530 91
East Merseyside (Knowsley & St
Helens) 5.5% £11,676 68
Sefton 5.6% £11,321 66
Wirral 4.7% £9,891 58
Merseyside 5.5% £12,448 73
Northwest 5.4% £14,994 88
Source: Office of National Statistics (2007)
The number of economically active people in Wirral, i.e. the total of persons aged 16 and over who are either in employment or unemployed, progressed by over 8,000 from 1999 to 2005 (however nearly 6,000 were lost between 2004 and 2006). Wirral maintained constantly a greater percentage of the number of economically active people compared to the Merseyside average over this period (Table 3).
Table 3: Economically active people in Wirral, March 99-December 2006 Period Wirral Wirral (%) Merseyside Merseyside
(%) Mar 99 - Feb 00 132,000 71.4 560,000 69.6 Mar 00 - Feb01 138,000 74.6 572,000 79.6 Mar 01 - Feb 02 140,000 75.2 575,000 70.9 Mar 02 - Feb 03 137,000 73.9 578,000 71.2 Mar 03 - Feb 04 145,600 77.3 585,000 72.0 Jan 04 - Dec 04 146,100 77.3 589,000 72.7 Jan 05 - Dec 05 144,800 76.2 592,300 73.1 Jan 06 - Dec 06 140,300 73.9 607,600 73.4
Source: Office of National Statistics (2007)
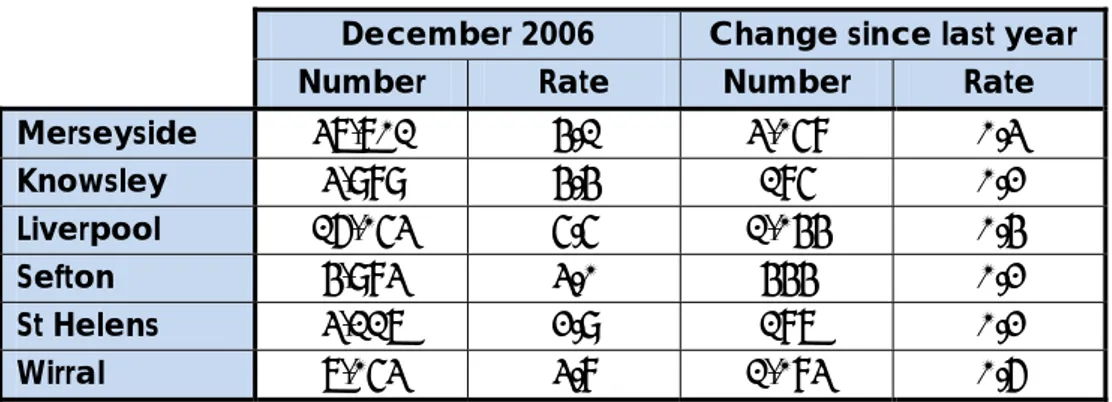
With an employment rate of 71.7% among the working age persons, Wirral is the second most active borough in the county after St Helens, and is situated higher than Merseyside’s 68.2%. Its unemployment rate was at 3.8% at the end of 2006, it has known a substantial 0.6% rise between 2005 and 2006 which prevents it from reaching the most effective districts in this domain now (Table 4).
Table 4: Unemployment rates - Merseyside district’s comparison December 2006 Change since last year
Number Rate Number Rate
Merseyside 37,701 4.1 3,058 0.3 Knowsley 3,989 4.4 185 0.2 Liverpool 16,053 5.5 1,044 0.4 Sefton 4,983 3.0 444 0.2 St Helens 3,117 2.9 187 0.2 Wirral 7,053 3.8 1,083 0.6
Source: Office of National Statistics (2007)
Nonetheless, as far as the earnings are concerned, Wirral still shows the highest median level of gross weekly earnings in Merseyside at £362, a 2.5% enhancement between 2005 and 2006 (while Liverpool knew the fastest growth in the county regarding this figure with a 6.9% surge over this period). A newsworthy observation is that whereas Wirral has a higher income than the Merseyside by residence, it doesn’t by workplace. This may reflect that Wirral has residents who commute to outside districts for employment and for higher income employment.
The next figure (Figure 5) illustrates the household income distribution amongst people living in the borough, and its evolution within the past 15 years. It evidences that the part of highest revenue households (over £30,000 a year) has skyrocketed since 1991, up to more than a quarter at the end of 2006 against a 5% in the early 90’s. On the contrary, the lowest income part (up to £5,000 a year) has consequently decreased to less than 15% in 2006, while the middle range revenues have been more randomly changed during this time interval.
Figure 5: Household income in Wirral
Birkenhead, Wirral’s most populated town, is the major gathering place of residences, employments and shops in the borough. From the last official counts (ONS Census 2001), it encompassed 83,729 dwellers but its population total is likely to be a few less now when considering the structural emigration both endured by Wirral and Merseyside. The city borders are located on the Wirral Peninsula along the west bank of the River Mersey, only 3 km (1.9 miles) on the opposite side from the centre of Liverpool. Birkenhead forms, within the contiguous built-up area linking neighbouring towns along the eastern side of Wirral, the Birkenhead Urban Area as defined by the ONS. This sector includes important cities like Wallasey (58,700 inhabitants), Prenton (14,400 inhabitants), Bebington (13,700 inhabitants), Rock Ferry (13,700 inhabitants), the outer-Wirral Ellesmere Port (64,100 inhabitants) and many other Wirral towns making the total population of the perimeter hit 319,675 persons from the ONS 2001 Census. In Merseyside no other conurbation, apart from the Liverpool Urban Area, is larger than the Birkenhead one which was even ranked 22nd in the UK largest conglomerations according to the 2001 Census.
Facilitated by its geographical position, the city of Birkenhead is famous as a centre node for ship building and as a seaport. It has received a successful heritage from the last decades’ strong port-related industries and today’s Wirral docks, established at a short distance from the town center, result from a deep modernization that has allowed the city to create international links with other harbour-cities. In the meantime Birkenhead, as well as other members of the urban area, diversified its industrial structure to make the local economy fit to the continually changing world, thus its activity nowadays include pharmaceuticals, engineering, chemical, food, and allied trades and soap manufacturing industries. Wirral authorities are then at present enraptured to point out new enterprises are flourishing and businesses are prospering in this "peninsula of opportunity".
This depiction of the Birkenhead area and its surrounding environment, an economically healthy place managed by local authorities greedy for attracting firms, people, employments, and making growth surge even better, lead to think persons exchanges may be significant between Wirral’s largest city, its neighbouring Liverpool Urban Area, and obviously other domains inside Merseyside and the UK. This will be gone into thoroughly in the second part of this report, which will predominantly focus on the local mobility behaviours and the provided transport systems that are supposed to match up to the mobility demand.
Synthesis:
¾ Merseyside, an administrative and territorial division of the UK which transferred most of its functions to its five metropolitan boroughs.
¾ A demography in the heart of a structural slump in the county, even though hopes of a regeneration light up Wirral and the other district’s future.
¾ An evidenced economical attractiveness, mirroring steady output growth, low-maintained unemployment rate, and high employment rates
¾ Birkenhead, core of a large urban area stretched over an extensive territorial space, facing Merseyside’s main conurbation of Liverpool, and major mover of Wirral’s economy.
Part 2. Transport systems and travelling behaviours across the
Birkenhead area
This chapter will allow knowing more about how the sundry means of transport inside and around Birkenhead are shared across the territory, and how they are used. It will also point the difficulties related to road congestion which have led authorities to seek for measures supposed to enhance the transport system’s reliability.
2.1. Transport infrastructures and services
Before seeking to understand people’s travelling habits, a preliminary definition of all transport possibilities supplied to the population around the studied place appears essential. As far as Birkenhead and its surrounding sector are concerned, many options appear to be offered as part of the local trips: road infrastructures with more or less large capacities, motorways, public transport services (buses, underground trains, and ferries) within Birkenhead borders on the one hand, and between the city and its proximity on the other hand, and lastly walk and cycle.
The following Figure 6 illustrates the main road network passing through Birkenhead and linking the city to the closest Wirral and Mersyside territories.
Source: http://maps.live.com
The main infrastructure regarding traffic capacity is the M53 motorway, which crosses Wirral from the north to the south and provides with high speed travel options to the Birkenhead Urban Area cities along the peninsula. This equipment starts its route from Wallasey’s bounds in the northern urban area’s extremity, over the exit slip roads of the Liverpool Kingsway Tunnel, then passes round the west of Birkenhead offering diverse approaches to the town and its suburbs, and finally passes Wirral borders to hit the Chester motorway network (providing accesses to the Cheshire County and the north Wales).
The M53, which allows Birkenhead and Wirral to be effectively connected to the most populated places of Merseyside and UK, is relieved locally by several A-roads (i.e. most strategic non-motorway infrastructures by UK’s nomenclature) that provide sharper access to the cities of the territory. Hence Birkenhead benefits from many A-roads joining the town centre to the motorway or to other cities of the urban area, among which the A552, subject of this study, is part. These equipments are themselves relieved by roads from another sub-category, the B-roads (less strategic and even more local than the A category), and both A and B-roads possess variable capacities depending on their locations in the network.
As far as sustainable transport means are concerned, the area appears at first sight to get a mass-supply in a quantitative point of view. Bus lines typify the major public transport option within the framework of trips around the Birkenhead Urban Area, with 108 different services (to qualify though, as several services actually use identical routes but are distinguished because they are operated by different private companies or run over different time periods) covering a consequent part of the
M53 A552 A4 A5029 A5088 A5030 A553 N 1.5 km A502
local generators and also standing for a strategic way to narrow down geographical inequalities between people’s residential locations (as well as income differences, when reckoning all dwellers can’t afford travelling by car). Some of the bus services are only urban, namely internal in Birkenhead, when others are interurban and allow to travel from the central city to the neighbouring towns. The routes which come under the scope of this study (i.e. those running on the A552) will be depicted precisely in the following chapter of the document.
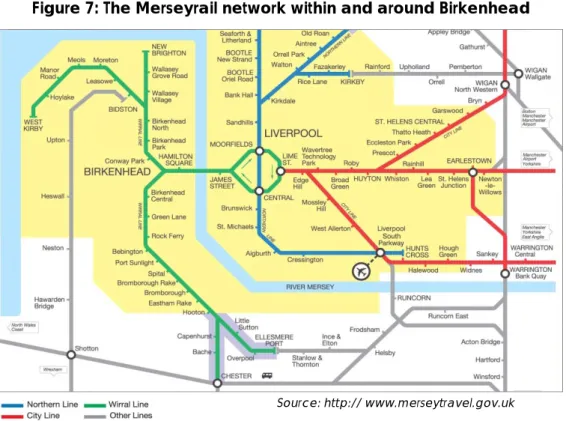
Birkenhead and Wirral are besides equipped with the Merseyrail system, an underground commuter train network centred on Liverpool which serves the major cities of Merseyside and even outside the county (Figure 7). Situated on the Wirral line, Birkenhead embraces six Merseyrail stations within its borders, of which one (Birkenhead Central) is located at the eastern extremity of the A552 when the others are scattered on a north/south direction to cross the urban area’s cities along the Wirral peninsula.
Figure 7: The Merseyrail network within and around Birkenhead
Birkenhead’s particular geographical situation allows moreover its inhabitants and visitors to travel by ferry on the River Mersey. The service, called Mersey Ferries River Explorer Cruise, provides journeys from Seacombe at the very eastern tip of Wirral (closed to the Birkenhead town centre) to join Liverpool banks within ten minutes, and runs early mornings and evenings seven days a week. It stands for an option, in the midst of the customary transport means, for work and leisure-related trips between the Wirral peninsula and Liverpool.
And finally, the usual “environmentally-friendly” modes (walk, cycle) obviously stand for relevant transport possibilities in the area. Yet, if walkways are frequently set up along city streets, cycle path seem to be much less conspicuous in the road landscape: apart from short spaces marked on the ground in front of several traffic lights, supposed to keep cars and bikes fairly distant on junctions edges, there are actually no path especially dedicated to cyclists in Birkenhead and its outskirts. Bike-users are nevertheless permitted to use bus lanes but safety appears more uncertain in this situation, and ultimately cycle looks like the less facilitated transport means among all sustainable modes across the Birkenhead Urban Area.
2.2. Heavy transport demand and domination of the car
The whole of transport possibilities being now presented, it is to appreciate how people use these infrastructures and services in their everyday life. In that purpose several data will be mobilized and tallied with each other, by minding the fact they have been created by different entities with their own methodologies, and at different times. Many of them concern the entire Wirral district territory but as pointed out before, Birkenhead and the Birkenhead Urban Area constitute an overwhelming part of Wirral both in terms of population and economic activity. The information related to the whole Wirral can then be easily considered as pertinent for the scope of this study which focuses on the city of Birkenhead.
Hence the Wirral Countywide Travel Survey, conducted at three to four year intervals since 1987/1988, provides with handy results about people’s travel habits on a typical weekday. It includes all trips (i.e. movements accomplished from a specific origin to a specific destination, between a given departure time and a given arrival time, and whatever the number of different transport means used) made by people aged more than five inside the borough. The latest achievement of this survey, carried out in 2005/2006, firstly evidences that the most common daily number of individual trips made in Wirral is two (Appendix 1, page 106): 50% of the persons encompassed in the survey sample travel two times a day, an average that has always been the typical figure from 20 years and that is increasingly over-represented, when 17% move four times, 9% move three times, and less than 2% move only one time. The part of individuals who claim they don’t travel has been in regular decrease from the first survey, falling from 13% in 1987/1988 to only 8% in
comparison of household incomes and number of daily trips among people of the Merseyside counties (Appendix 2, page 106): the more households earn, the more they get around, and as Wirral has the highest average earnings level within the county, its dwellers were actually expected to move substantially.
The Wirral Countywide Travel Survey shows moreover that the predominant purposes of Wirral trips in 2005/2006 (Appendix 3, page 107) are shopping (22%), work (20%), and leisure activities places (17%) from home, these travel origins and destinations being constantly over-represented in the trip possibilities midst. As far as work trips are concerned in particular, origins and destinations of outflows and inflows from and to Wirral can be knows thanks to the ONS national census, achieved once every ten years, which captures details of all persons’ travel to work and thus brings highly valuable travel data. The latest census in 2001 allowed first to know 84% of the inflow in direction of Wirral is internal: only 16% come then from outside, which may mirror the Birkenhead borough’s lack of job opportunities and places able to generate a consequent number of work trips from diverse origins, and shows a relative deficit of attractiveness compared to other boroughs like Liverpool. The external inflow is mainly originated from Wirral’s closest areas (Figure 8): Ellesmere Port and Neston represent 28% of this remaining percentage (4.5% of overall total), when Liverpool produces 18% (2.9% of total), the neighbouring Wales 11% (1.4%), Chester 8% (1.3%) and the remainder is scattered in other further locations.
Source: ONS Census 2001
As expected, much more work journeys are undertaken by Wirral inhabitants into places located outside the Birkenhead district: among the outflow total from Wirral, only 68% are internal and remains inside the district when nearly one third are leaving the local perimeter. The favourite outside-Wirral work destination (Figure 9) is by far Liverpool with 43% of non-internal journeys (13.8% of overall total), followed by Ellesmere Port and Neston with 16% (5.12%), Chester with 8% (2.56%), and other less important sectors. It is to point out that the Greater Manchester, more distant from Birkenhead and Wirral than all Merseyside districts, attracts more work trips than each of these districts apart from Liverpool.
Figure 9: Wirral as an origin for travelling to work, 2001
Source: ONS Census 2001
Concerning travelled distances in particular, statistics allow to witness work trips distances were increasingly long between 1991 and 2001 (Table 5), with a doubled proportion of 10 km-to-30 km (16.1 miles to 48.3 miles) journeys between these two dates (which corresponds to a shift from one tenth of the trips to one fifth), a tripled part of over-30 km (48.3 miles) journeys, whereas shorter trips fell significantly as the less-than-2 km (3.2 miles) tilted from 30% to 19% and the 2 km-to-10 km (3.2 miles to 16.1 miles) from 58% to 54%. These longer trips may eventually mirror effective updating of the transport infrastructures and services between the 90’s and the early-21st century, as it is often observed that the faster trips are globally made (thanks to
the infrastructures and services improvements), the more important travelled distances are. This conversion from higher speeds into longer distances could then be applying in the Wirral case, even if no specific study has been achieved to confirm this statement.
Table 5: Wirral distance travelled to work by workplace, 1991/2001 comparison
Year Less than 2 km (1.2 miles) 2 km - 10 km (1.2 - 6.2 miles) 10 km - 30 km (6.2 - 18.6 miles) Over 30 km (18.6 miles) (43%)
Source: ONS Census 1991 and 2001
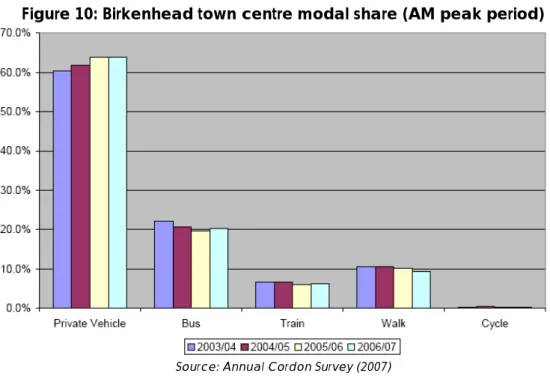
As for the modal share, the diverse available data evidence an irresistible progression of the car amongst Wirral trips over the last years and decades, and a linear decrease of well-nigh all sustainable modes use (bus, walk, cycle). The Wirral Countywide Travel Survey shows this trend peculiarly for the whole borough (Appendix 4, page 107), with a car modal part (drivers and passengers included) that skyrocketed from 48% in 1987-1988 to 65% in 2005-2006, whereas bus-services use fell from 15% to 9% between this two decades. In the same time, walk trips tumbled to only 22% in 2005-2006 when they were 30% twenty years ago, and bike journeys were even more marginalized than they had been before. Finally, train is the only sustainable transport mean whose part was leveled off between the first and the last survey, but it still stands for less than 3% of the total Wirral trips. When considering transport modes split inside the borders of Birkenhead, whose figures can be observed with the help of the Annual Cordon Survey (commissioned by the Merseyside Local Transport Plan Coordination Group on an annual basis) which counts flows entering the town centre during an AM peak period (namely 07:30 to 09:30) on a typical weekday, the evolution is nearly the same (Figure 10): the percentage of private vehicles drew near to two third in 2006-2007 after a slight but regular increase from 2003/2004, and the part of buses fell by 2% to one fifth of the city trips (a percentage by far higher than for the whole Wirral anyway). In the meantime walk trips remained at a very low level (around 10% only), bike trips became well-nigh totally absent (which is not very surprising due to the lack of cycle tracks that has been mentioned before), and trains patronage kept a 6% part thanks to the underground services.
Figure 10: Birkenhead town centre modal share (AM peak period)
This increasing car plebiscite is reflecting Wirral’s high level of car ownership: even if Merseyside has an historically lower level than many of the other UK areas, Wirral households have a more important car ownership rate than in the four other boroughs of the county. The Birkenhead borough’s 70% average of households possessing at least one vehicle or more is fairly similar to the North West region one (Appendix 5, page 108). Likewise, Wirral’s motorization rate figure shows, in time, a growing part of households owns two, three or more vehicles when a lowered part possesses zero or one (Appendix 6, page 108).
When reminding the transport network includes roads (motorway, A and B-roads) which have variable absorption capacities, this high transport demand, and especially this high car-based transport demand, is likely to represent strong threats to the whole transport system reliability, what the next section of this chapter is going to confirm.
2.3. Road transport system limitations
The Birkenhead Urban Area and the Metropolitan Borough of Wirral are experiencing increasingly high trip requirements in contexts of upward car ownership, car use and travelled distances, and downward sustainable mass-transport modes use. The first consequence is not surprising and is observed along the main road network: traffic is growing steadily. The figure reputed the most robust to evidence this trend has been carried out by the DfT, whose estimated traffic flows for the 1993-2005 period (Figure 11) show transport infrastructures have inescapably known a regular surge of their visiting in all Merseyside districts. Wirral appears to have endured the highest growth rate compared to the other areas, with a more than 25% traffic rise from 1993 to 2005 whereas Merseyside’s rate is under 20% over this period.
Source: Department for Transport (2006)
Flows are expected to grow even higher in Wirral in the next two decades, according to DfT’s TEMPRO factors based on the year 2006 (Appendix 7, page 109) that evidence the borough could bear a new 15% increase by 2021 compared to 2006.
Therefore this increasing traffic is closely correlated to the second consequence of the previous observations: congestion is getting more and more problematic across the urban area network and its neighbouring sectors. This can be easily noticed thanks to ITIS Holdings consultancy data (Figure 12), which uses satellite vehicle tracking information to show the factors of difference between free flow traffic conditions (i.e. traffic performances in perfect circulating conditions, namely during an off-peak period taken here as 8:00 PM - 9:00 PM), and the morning peak hour (taken as weekday 8:00 AM - 9:00 AM time interval). If Liverpool appears the most penalized by congestion (and particularly on the A and B-roads that lead to the city centre), with factors of differences often above 1.4 between free flow and peak hour traffic conditions, the Birkenhead area doesn’t show encouraging performances: nearly all the main A-roads joining Birkenhead to the rest of the peninsula present factors of differences comprised between 0.5 and 1.8, like the A41 on the eastern side of the peninsula, the A552 in the middle of the territory, the A553 on the north, or the A540 on the western side. One of the most congested urban infrastructure is the A552, logically chosen as the corridor which will be tested within the scope of the traffic monitoring for the Birkenhead case in this project. The A552 stands indeed for a very representative road regarding traffic difficulties that are supposed to be fought as part of the Merseyside LTP.
Source: ITIS tracking data (2008)
When looking at journey times on the eleven select routes of the Merseyside LTP (Figure 13), it is noteworthy to see the Birkenhead A552 corridor easily reaches the five most congested infrastructures regarding journey times per mile achieved. Collected by the Mott MacDonald Merseyside Information Service (MIS), these data are obtained by recording travel times for all vehicles on several strategic points of the routes (Appendix 8, page 109, illustrates the Birkenhead corridor recording), and evidence an average of more than 4 min is necessary to accomplish one mile on the Birkenhead route (slightly above the baseline average) , when 5 minutes 30 sec are necessary on the panel’s worst infrastructure in Crosby, and 3 min on Everton Valley which is the best route among the eleven study cases.
Figure 13: Merseyside congestion indicators, corridors baseline data A552
A540 A553
3 km A41
Source: Mott MacDonald Merseyside Information Service (MIS)
Wirral surveys show that if inhabitants don’t systematically consider congestion as a real problem every day (Appendix 9, page 110), above all on the routes outside the city centres, they massively think traffic conditions became globally worse over the recent years (Appendix 10, page 110) and a very marginal proportion claims it got better.
Finally, Appendices 11 and 12 (page 111) evidence other concerns regarding the whole Wirral road transport system performances which, if they are not exclusively attributable to congestion, are inescapably partly affected by it: Appendix 11 shows pollution concentrations for Nitrogen Dioxide from all sources, although transport (and obviously clogging) is a significant contributor for these pollutants. The impact of transport on pollution can be clearly seen along the M53 and A41 corridors and the Birkenhead town centre (industrial uses on the eastern side of the borough create as for them, the non-transport pollution that is clearly shown on the map). Appendix 12 illustrates the killed or seriously injured (KSI) people along the Wirral road infrastructures (which are obviously not systematically originated in congestion, but it is acknowledged that potential traffic jams generally stand for further threats on road safety). The figure proves authorities have been bearing difficulties to fight against road safety uncertainties from the past fifteen years, with KSI figures constantly wobbling between 150 and 200 persons per year when the target is to reach only 100 in 2010.
The trends pertaining to travel behaviours in the Birkenhead Urban Area on the one hand and more globally in Wirral on the other hand, and the arising congestion issues brought up so far don’t allow to expect an optimistic future for the road transport reliability if nothing is done, and may lead to harmful consequences regarding regional competitiveness, quality of life and environment that would evidently not be desired in the context of anticipated economic growth and prosperity for the area. Better still, sustainable modes’ global decline in the sector,
trips authorities generally wish to fulfill in UK and around the world. But in the Wirral case, bus customers’ downward loyalty has to be compared to the performances bus services provide: as part of saturated traffic conditions, road public transport performances can only be poor if no effort is undertaken to bring them acceptable for usual and potential sustainable transport patronage.
That is within the framework of this multi-stakes context the local LTP is playing a crucial role: the testing which will be carried out on the Birkenhead A552 corridor, one of Wirral’s most jammed urban route, must permit to find out pertinent solutions to Wirral clogging problems and consider the road traffic with much more enthusiasm for the next years. In that purpose the latest microsimulation tool, VISSIM 5.0, will be used by modelling the entire A552 corridor before proceeding, afterward, to the testing. The next part of this document will then meticulously depict the different modelling steps, by minding the usual limitations of such a methodology
Synthesis:
¾ A dense road network organized around the M53 motorway and the A and B-roads.
¾ An seemingly increasing transport demand for twenty years, led by an upward attraction for car, and strongly linked to Liverpool especially for the outflows from Wirral.
¾ Regular traffic and congestion growths on the main road infrastructures, notably on the A-roads, and a still expected increase for the next decades.
¾ A transport reliability, a local economic competitiveness, a quality of life and environment, and a public transport patronage that are threatening to deteriorate even more in the future if no action is undertaken.
¾ The A552, one of Wirral’s most jammed route, which stands for a representative infrastructure in the borough regarding traffic issues, and on which this study will focus exclusively within the scope of the microsimulation model building.
Part 3. Modelling the network with the microsimulation package
Once it will have allowed to be acquainted with VISSIM, the microsimulation software through which subsequent testing will be achieved regarding congestion monitoring, this chapter will be describing all the modelling process that is supposed to reproduce the A552 corridor as realistically as possible. This building contains several limitations, that will be rigorously pointed out at the end of this section.
As revealed previously, the A552 appears to be one of the most saturated road infrastructure within the Wirral territory and is representative of the jam problems bore by the borough. It is therefore expected to be very appropriate as part of this project and may allow to deliver pertinent results.
3.1. VISSIM: a robust microsimulation tool
Existing software resources to model the proposed improvements have been investigated. For the scope and level of detail of this study, which is fairly high, a microsimulation modelling package was recommended. Then Mott MacDonald has carried out research of the market place and concluded the VISSIM microsimulation package is the one that provides the best balance between simulation sophistication, user control, and graphical output. One of the latest version of the software, VISSIM 5.0 (the last release before the recent VISSIM 5.1 updating), will be used for this project.
VISSIM is a sophisticated mathematical model which allows for an individual and disaggregate traffic reproduction, with a strong visual interface. Its assignment model provides with the possibility of replicating users route choices on the network. The software possesses an inbuilt flexible motorist, pedestrian and cyclist’s “behaviour algorithm” whose variables can be altered to match up local conditions and achieve testing wherever the place of the study. It is able to replicate advanced signal timings on controlled junctions, not only for motorized road users but also for pedestrians thanks to pedestrian demand programs. A VISSIM model can hence be used, among other things, to survey the impact of policies on pedestrians and their responses to the environment.
The software is also a robust dynamic traffic assignment tool, that can model route choices of all road users (motorists, heavy goods vehicles and light goods vehicles drivers, cyclists, motorcyclists, pedestrians), set up users responses to intelligent route guidance systems (speed limitations, variable parking places,…) and reproduce parking choices explicitly. Moreover, VISSIM is able to model precisely the operations of public transport, such as scheduled based arrivals, loading and unloading of passengers, dwell times, and the relations between passenger demand
converted into three-dimensional animations which are relevant for presentation purposes, especially for secular users.
The key benefits of using a VISSIM microsimulation strategy are the possibility to take into account, with large adjustment possibilities, traffic composition, priority rules, driving attitudes, traffic lights positions, pedestrian crossings, bus routes, stop locations, junction delays, queue lengths, and many other inescapable components of usual traffic conditions. Specific detailed operations of public transport such as bus priority rules can be easily modelled, which will prove to be useful in the context of this project, but VISSIM can also examine wider effects of transport policies on the whole of the users, and even on the society: the models can indeed be used to evaluate benefits and costs to all users of the system in a integrated way and the outputs can be linked to economic and environmental impact of the schemes.
Therefore the VISSIM microsimulation model of the A552 corridor congestion monitoring will allow for the most detailed study regarding the impact of design interventions on the network and on its various users. As all transport modes (cars, buses, heavy and light goods vehicles, cycles, motorcycles and pedestrians) need to be included in the model within the scope of a congestion monitoring study such as this project, as they are central to the traffic operations in any clogged infrastructure. The interdependency between all these modes will be taken into account, the impact of a particular user class on the others’ performances being measurable in an integrated way.
All these benefits expounded so far, which establish the VISSIM package as the most suitable tool for this study, are expected to offset the consequent investment required to collect the necessary data and to build the model in its entirety, whose long process is described in the next section.
3.2. The model building process
The model building stage is a meticulous process, which requires time and rigour as it affects crucially the whole output results and evidently the analyses following from these results. Due to the importance of this project, it is mandatory to exclude any error that may hinder the improvement testing, and it is strongly recommended to justify clearly each of the assumptions which are used through the progress.
The following steps will hence we depicted in this section of the chapter, pointed out in the chronological order they are operated according to this project’s strategy: spatial delimitation of the network’s section to model and selection of the simulation time period, roads and roads connectors reproduction, nodes and turns shaping, definition of the traffic composition, desired speed distributions, reduced
coding, specification of the traffic production and attraction points, and finally data collection points localization.
3.2.1. Spatial delimitation of the network’s section to model, and selection of the
simulation time period
Prior to the first steps of the A552’s virtual building in VISSIM, it is required to mark off with precision the exact perimeter of the corridor that will be embraced in the model. As portrayed before, the A552 route starts from the Birkenhead city centre, on the eastern side of the peninsula, and joins the M53 motorway in the middle of the territory. The infrastructure actually ends in the town of Woodchurch, which is laid over the western side of the M53 very closed to Birkenhead, and the total length of the A-road is approximately 6.7 km (4.2 miles). But in the context of the study, this very western section of the equipment, as well as its very eastern part which communicates with the A553, A554 and A5030 will not be modelled (Figure 14) as they are not concerned by congestion, contrary to the central part: the VISSIM-modelled route will therefore start from the exit of the Argyle Street/Borough Road roundabout junction in the east, and end just before the Woodchurch Road/M53 roundabout junction in the west. It will be finally 4.2 km (2.7 miles) long and its eastern extremity will include all trips coming from or going to the Birkenhead city centre or Liverpool (as it leads directly to the Mersey Tunnel) when the eastern extremity will encompass all connections with the M53, Woodchurch and other cities located in the west of Birkenhead.
Figure 14: Included and excluded portions of the A552 to model in VISSIM
Source: http://maps.live.com
It is besides obvious the model has to take into account all the trips entering
M53 A5030 A554 Excluded Excluded Included A553 A552 N 800 m
marginal part of the total movements, as any vehicle joining the modelled track of the A552 enters in conflict with the others and affects the global traffic performance. Thus these roads, amid which many are just linking residential areas to the corridor, will be added to the simulation with their length being partially modelled as they will only be used to attract and generate traffic from and to the corridor. The total perimeter of the network that will be virtually reproduced can then be seen in Figure 15.
Figure 15: Perimeter of the network to reproduce
Source: http://maps.live.com
It is to notice the modelled portion of the A552 includes another A-road which crosses it perpendicularly in the north eastern area, close to the Birkenhead town centre: the A5029 is indeed connected via the Exmouth Street, that links the A552 to the A553 further in the north of the city. This infrastructure will be the only modelled
Exmouth St Borough Duckpond Whetstone Ball’s Rd North Storeton Borough Woodchurch Prenton Hall Grange Rd Holm Ln Wilmer Rd Woodchurch North b d South b d N 800 m Argyle
adjacent road to include a signalised junction on its route (Exmouth Street/Oxton Road/Grange Road West) as this junction controls a consequent traffic coming from various points of the sector in the proximity of the A552. All others A552’s bordering streets don’t take in any signalised intersection close to the corridor.
The corridor mainly provides accesses to the numerous residential areas of the sector, which cover the well-nigh totality of the territory that will be virtually reproduced. Notable trip generators are then very few along the infrastructure (most are supposed to be outside the network, as Figure 16 shows): only the two commercial areas roughly located around each of the two route’s extremities can be considered as markedly attractive within the selected network. The first one is laid near the junction Woodchurch Road/Duckpond Lane, it includes several medium-size shops and provides important parking capacities. The second one is the imposing Pyramid commercial complex situated around the Argyle Street/Borough Road roundabout junction at the network’s very eastern area: the building and its high-capacity parking take up a very large place in this sector, and the equipment is seemingly the first attraction point located along the A552.
The main outer-perimeter production and attraction points are, as for them, expected to be mainly found in the Birkenhead city centre (to which the A552 provides direct access in the east), Liverpool (accessed via the Mersey Tunnel, to which the A552 is connected), western Wirral (reachable thanks to the corridor in the west), and further territories accessed via the M53 to which the corridor is linked.
Figure 16: Supposed main trip generators within and outside the corridor
Source: http://maps.live.com
As far as the time period for the simulation is concerned, this project will follow DfT’s recommendations to model corridors for an AM and a PM peak period (when congestion is at its highest level), as traffic movements vary throughout the day and the network has to be able to cope with these unbalanced trips. But unlike the
A552 Commercial area Pyramid commerc ial complex Birkenhead city
center Liverpool city
Further south territories Further north territories Western Wirral N 800 m
unnecessarily as huge input data would have to be defined (transport demand still fluctuates within these intervals, and demand estimation processes would be extended too much), this study’s strategy is to select only one-hour AM and PM periods in which traffic hits the highest peak. By referring to the Wirral traffic profile (Figure 17), it appears flows are at maximum at 8:00 in the morning and 17:00 in the afternoon, thus the model can follow from these data: the simulation will be proceeded for 8:00 - 9:00 and 17:00 - 18:00 time periods, with fifteen-minutes pre-peak intervals before each period to allow for reproducing free flow traffic conditions as well. Then demand will have to be estimated for only four time intervals (7:45 - 8:00, 8:00 - 9:00, 16:45 - 17:00 and 17:00 - 18:00) and the model will include all the most representative traffic conditions.
Figure 17: Wirral traffic profile (Monday to Thursday)
Source: Mott MacDonald Merseyside Information Service (2007)