ESA ESRIN/Contract No. 19402/05/I-LG
“To provide earth observation based services and encourage partnerships in monitoring Global Food Security and related environmental processes, by concerting efforts to bring data and information providers together, in order to assist stakeholders, nations and international organizations to better implement their policies towards sustainable development”
Service Operations Report
SENEGAL 2007
Deliverable Reference: S6
Author(s): Josefien Delrue, Massimo Barbieri, Bernard Tychon, Louis Kouadio, Antoine Denis Version: 5.0
GMES Service Element
Service Operations Report SENEGAL 2007
5.0, 17 March 2008
Project Deliverable: S6_SEN ESRIN Contract No. 17067/03/I-LG
Author(s): Josefien Delrue, Massimo Barbieri, Bernard Tychon, Louis Kouadio, Antoine Denis
Page 2 of 47
Signatures
Author(s) : Josefien Delrue, VITO Massimo Barbieri, SARMAP Bernard Tychon, ULG Louis Kouadio, ULG
Antoine Denis, ULG
Reviewer(s) : Patrizio Vignaroli, FCS Lieven Bydekerke, VITO Approver(s) :
Issuing authority : VITO
Change Record
Release Date Pages Description of Change Editor(s)/Reviewers(s)
5.0 17.03.2008 First version B. Tychon, ULG
L. Kouadio, ULG A. Denis, ULG M.Barbieri, Sarmap J. Delrue, VITO
List of acronyms
AGRHYMET Application en Agrométéorologie et Hydrologie Opérationelle AMS AgroMetShell
AP Agricultural Productivity
AVHRR Advanced Very High Resolution Radiometer
BA Bassin Arachidier
CA Cultivated Area
CED Crop Emergence Date
CFSAM Crop and Food Supply Assessment Mission
CILSS Comité Inter-états pour la Lutte contre la Sécheresse au Sahel CSE Centre de Suivi Ecologique
CSSWB Crop Specific Soil Water Balance
CY Crop Yield
DAPS Direction de l’Analyse, de la Prévision et des Statistiques DDS Data Dissemination Service
DMP Dry Matter Productivity
EC European Commission
EO Earth Observation
EoC Extent of Cultivation
EOS Earth Observing System
ESA European Space Agency
ETAi, ETAv, ETAf, ETAr, ETAt
Evapotranspiration à différents stades phénologiques (respectivement à la phase initiale, phase végétative, floraison, récolte) et sa valeur totale en fin de cycle
ETP Evapotranspiration potentielle
EU European Union
EVI Enhanced Vegetation Index
FAO Food and Agricultural Organization of the United Nations fAPAR Fraction of Absorber Photosynthetically Active Radiation FEWS Famine Early Warning System
FR Full Resolution
GIEWS Global Information and Early Warning System GLC2000 Global LandCover for the year 2000
GMES Global Monitoring for Environment and Security GMFS Global Monitoring for Food Security
GS Growing Season
GSE GMES Service Element
GTP Groupe de Travail Pluridisciplinaire Horz Peak – Sdat
IndexNormal,
IndexLatest Indices de satisfaction en eau en fin de cycle JRC Joint Research Institute
MAM Modèle agrométéorologique
MARS Monitoring Agriculture with Remote Sensing
MERIS Medium Resolution Imaging Spectrometer Instrument
MIR Middle Infrared
MODIS Moderate Resolution Imaging Spectroradiometer
GMES Service Element
Service Operations Report SENEGAL 2007
5.0, 17 March 2008
Project Deliverable: S6_SEN ESRIN Contract No. 17067/03/I-LG
Author(s): Josefien Delrue, Massimo Barbieri, Bernard Tychon, Louis Kouadio, Antoine Denis
Page 4 of 47 PAR Photosynthetic Active Radiation
Peak Décade à laquelle le NDVI atteint son maximum Pluvio_I,
Pluvio_D, Pluvio_MS, Pluvio_L
Cumul pluviométrique respectivement au stade Initiation, Végétation, Floraison-fructification, et au stade de maturation
Pval Valeur du NDVI à Peak
R² Coefficient de corrélation
R²cv Coefficient de corrélation en validation croisée RMSE Root Mean Square Error (erreur quadratique moyenne)
RR Reduced Resolution
RRSU Regional Remote Sensing Unit
SADC Southern Africa Development Community Sdat Décade de début de saison agricole
SPOT Système Probatoire de la Terre Sval Valeur du NDVI à Sdat
TM Thematic Mapper
TOAVI Top of Atmosphere Vegetation Index UNEP United Nations Environment Programme
USAID United States Agency for International Development VAM Vulnerability Assessment and Mapping
Vert Pval – Sval
VGT Vegetation (sensor on board SPOT 4/5) VPI Vegetation Productivity Indicator WDEFi, WDEFv,
WDEFf, WDEFr, WDEFt
Déficit en eau à différents stades phénologiques (respectivement à la phase initiale, phase végétative, floraison, récolte) et sa valeur totale en fin de cycle
WEXi, WEXv, WEXf, WEXr, WEXt
Excès en eau à différents stades phénologiques (respectivement à la phase initiale, phase végétative, floraison, récolte) et sa valeur totale en fin de cycle
WFP World Food Programme
WHC Water Holding Capacity (capacité de teneur en eau)
Contents
1. EXECUTIVE SUMMARY... 6
2. INTRODUCTION... 7
3. SERVICES... 8
3.1.SERVICES DELIVERED AND SERVICES AGREED IN THE SLA ... 8
3.2.DATA ACQUISITIONS & PROCUREMENTS... 8
3.3.DELIVERY MECHANISM... 9
3.4.ANOMALIES AND PROBLEMS... 9
3.5.CUSTOMER COMPLAINTS & RESOLUTION... 9
4. EXTERNAL & COMMON INFRASTRUCTURE... 9
4.1.GENERAL... 9
4.2.POTENTIAL IMPROVEMENTS... 10
5. STANDARDS ... 10
ANNEX I: EARLY WARNING SERVICES... 11
ANNEX II: AGRICULTURAL MAPPING PRODUCTS AT LOCAL SCALE... 12
ANNEX IV: CALIBRATION FIELD SURVEY (IN FRENCH) ... 30
GMES Service Element
Service Operations Report SENEGAL 2007
5.0, 17 March 2008
Project Deliverable: S6_SEN ESRIN Contract No. 17067/03/I-LG
Author(s): Josefien Delrue, Massimo Barbieri, Bernard Tychon, Louis Kouadio, Antoine Denis
Page 6 of 47
EXECUTIVE SUMMARY
GMFS (Global Monitoring for Food Security) is a GMES Service Element (GSE) project, part of the ESA contribution to the EU / ESA GMES (Global Monitoring for Environment and Security) Programme. GMFS aims to establish an earth observation based operational service for crop monitoring to support food security decision makers and EU policy objectives.
The aim of this document, as expressed in the statement of work is to: - Evaluate the operations planned versus the services agreed - Review the external infrastructure
- Review issues and experiences with relation to adopted standards
The aim of the document is to give a complete report of all activities executed by the service partners to deliver agricultural monitoring services to the Centre de Suivi Ecologique (CSE) in Senegal for the 2007 growing season.
At the moment when this report is produced only the EoC product, The DMP product and part of the crop yield product have been delivered to the CSE. Other product are still to be delivered, an exception is made for the CEP product for Senegal 2007. During progress meeting 8 at Frascati, Italy it has been decided that this product was more a research product than a operational service and that it will not be delivered to the e nd users.
The data has been delivered via FTP, email, DDS or direct handover during field visits to CSE.
Deleted: For the 2007 growing season it had been agreed with CSE that GMFS delivers the following services and products:
1. INTRODUCTION
GMFS (Global Monitoring for Food Security) is a GMES Service Element (GSE) project, part of the ESA contribution to the EU / ESA GMES (Global Monitoring for Environment and Security) Programme. GMFS aims to establish an earth observation based operational service for crop monitoring to support food security decision makers and EU policy objectives.
The aim of this document, as expressed in the statement of work is to: - Evaluate the operations planned versus the services agreed - Review the external infrastructure
- Review issues and experiences with relation to adopted standards
The aim of the document is to give a complete report of all activities executed by the service partners to deliver agricultural monitoring services to the Centre de Suivi Ecologique (CSE) in Senegal for the 2007 growing season.
The GMFS service network currently consists of 12 European partners with different fields of expertise. These partners agree in principle to the GMFS “Open Partnership Protocol” (ESA deliverable S4), and are committed to jointly undertake activities and provide services in support of Food Security Early Warning Systems.
GMFS provides four different types of services which are: (i) Early Warning Activities; (ii) Agricultural mapping and (iii) Crop yield assessments, (iv) support to FAO/WFP Crop and Food Supply Assessment Missions (CFSAM).
Chapter 1 – 5 give a synoptic and general overview of the services delivered with respect to what was agreed in the SLA, standards, delivery mechanisms, data acquisitions and infrastructure. Technical and operational details are provided in ANNEX I - IV.
Deleted: Page Break Services agreed in the sla
GMES Service Element
Service Operations Report SENEGAL 2007
5.0, 17 March 2008
Project Deliverable: S6_SEN ESRIN Contract No. 17067/03/I-LG
Author(s): Josefien Delrue, Massimo Barbieri, Bernard Tychon, Louis Kouadio, Antoine Denis
Page 8 of 47
2. SERVICES
2.1. Services delivered and services agreed in the SLA
Within the SLA the following Products were agreed uponProduct Name Description Coverage Frequency Code
Vegetation Productivity
Indicator (VPI) Current assessment of vegetation/crop state based on to historical time series
Senegal 10-daily VPI_SEN_07 Dry Matter Productivity
(DMP)
Non-water limited Dry matter productivity integrates meteo data and is a measure for standing biomass. Image data used is MERIS RR or FR
Senegal 10-daily / monthly
DMP_SEN_07
Crop emergence date Emergence of crops/vegetation,
based on SAR data Senegal August 2007 CED_SEN_07 Cultivated area Cultivated area over selected,
localized areas based on SAR data
Local December
2007 CA_SEN_07 Extent of cultivation Extent of the cultivated areas at
country level, based on SAR and optical data.
Senegal December 2007
EoC_SEN_07 Agricultural Productivity Qualitative assessment of
potential productivity in the cultivated areas (High – low productivity)
Senegal December
2007 AP_SEN_07 Crop Yield Estimated and forecasted crop
yield by main crop type at country level Senegal Forecast: 2 to 3 times from August 2007 CY_SEN_07
Of this list the EoC product, The DMP product and part of the crop yield product have been delivered to the CSE. Other product are still to be delivered, an exception is made for the CEP and AP product for Senegal 2007. During progress meeting 8 at Frascati, Italy it has been decided that theCEP product was more a research product than a operational service and that it will not be delivered to the end users. The AP is calculated from the VPI and EoC. Since the latter are part of the delivered services, the user can easily compute the AP. Therefore the AP is no longer provided by GMFS to the user.
Delivery dates for the products produced once per growing season are listed below
Product Name Delivery date
Crop emergence date No delivery planned Cultivated area 5 March 2008 Extent of cultivation 19 December 2007 Agricultural Productivity No delivery planned Crop Yield 05 February 2008
Next to these services the GMFS partnership provided the CSE with nation wide monthly composites of fAPAR images based on MERIS FR. The partnership uses these image in the up scaling process from CA to EoC. CSE is provided with these images for evaluation and testing purposes.
2.2. Data acquisitions & procurements
This section summarizes the data used for generating the above listed products. In the appendices the detailed list of data used can be found for each individual service line. The following data was procured:
Formatted: English (U.S.) Formatted Table Deleted: Product Name Deleted: is
Deleted: Deleted: 
Deleted: Service not included in the SLA
- ASAR AP Data (41 scenes)
- MERIS FR data (6 monthly fAPAR composites used, each composite is produced from around 18 MERIS FR scenes)
- SPOT-VEGETATION
- SPOT-4 data (12 scenes used)
- Meteo data - Fieldwork data
- NOAA GAC data, obtained from FAO
The meteo data was provided in kind by the Senegal Meteorological Department (DMN) and CSE. ULg / CSE carried out a field campaign between 2 and 19 September 2007 (see Annex IV). The validation field survey carried out by DAPS upon request of GMFS during the months of August and September is described in the validation report.
Data ordering responsible partners are: - ASAR data: SARMAP
- MERIS FR data SPOT4 data orders: VITO - Fieldwork: ULG
ASAR data was ordered using the bulk ordering mechanism developed by ESA to provide GMFS with the necessary EO data.
For MERIS FR ESA created an FTP site where the MERIS FR L1 full scenes can be downloaded
2.3. Delivery mechanism
Three main delivery mechanisms have been used: - email
- ftp site (ftp://ftp.gmfs.info)
- personal hand over during field visits - DDS
2.4. Anomalies and problems
At the time of writing the report the CA (cultivated area) and part of the CY (crop yield) are not yet delivered to the end user. Products will be delivered January 2008.
2.5. Customer complaints & resolution
During PM8 in Frascati Italy it was mentioned that VPI data was sometimes arriving late at CSE. In the mean while VPI processing chain has been updated and improved, so that VPI data are received earlier at CSE.
GMES Service Element
Service Operations Report SENEGAL 2007
5.0, 17 March 2008
Project Deliverable: S6_SEN ESRIN Contract No. 17067/03/I-LG
Author(s): Josefien Delrue, Massimo Barbieri, Bernard Tychon, Louis Kouadio, Antoine Denis
Page 10 of 47 The VPI images are equally provided to CSE through the DDS system installed at the centre (in collaboration with the ESIT project).
3.2. Potential improvements
N/A.4. STANDARDS
The GMFS service network maintains an in-house database which is standardized in the following matter:
- projection: geographic, WGS84 or UTM 28 N - image formats: raw binary, geoTIFF - GIS data formats: Shapefiles - Maps: PDF files
ANNEX I: EARLY WARNING SERVICES
The following early warning products have been delivered to CSE: i. Vegetation Productivity Indicator; ii. the Dry Matter Productivity Indicator
Delivery of the VPI indicator
VPI’s are produced and delivered in a completely automatic way. The user is notified by email after the product has been produced. The email contains a quicklook image of the product and the image itself is available for download from the ftp server at ftp://ftp.gmfs.info/SEN/VPI.
The VPI images are provided in flat binary format along with an IDRISI and ENVI header. In case of Senegal the images are provided in the UTM 28 N projection system. The VPI is also sent through the DDS system and can be received locally. This is done in synergy with the ESIT project. The VPI images have been delivered starting from dekad 15 and is continued throughout the year.
Delivery of the DMP indicator
DMP indicators are based upon MERIS FR images and have been produced on a monthly basis instead of a ten-daily basis. The images itself are made available through the GMFS ftp site at
ANNEX II: AGRICULTURAL MAPPING PRODUCTS AT LOCAL SCALE
Methodology
Figure 1 illustrates the methodology applied. Two complementary parts should be distinguished, namely the optical and the SAR one. Key features derived from these independent sources are integrated in a rule based classifier. While Optical features are primarily related to spectral based behaviour inferred from single acquisitions (in the best case from bi-temporal acquisitions enabling also the generation of thematic classes), SAR time-series allow the derivation of temporal based features, which are characteristics for cultivated areas.
Spectral and temporal based features and spectral classes constitute the fundamental input parameters (which may vary from country to country) of the rule based classifier.
Outcome
Figures 2 to 5 give an overview of different products generated. The final Crop Area map is illustrated in Figure 4.
Figure 2: ASAR HH multi-temporal mosaic (red: August 2007 - green: September 2007 - blue: October 2007).
GMES Service Element
Service Operations Report SENEGAL 2007
5.0, 17 March 2008
Project Deliverable: S6_SEN ESRIN Contract No. 17067/03/I-LG
Author(s): Josefien Delrue, Massimo Barbieri, Bernard Tychon, Louis Kouadio, Antoine Denis
Page 14 of 47 Figure 3: Greenness index (b/w frames draped onto the ASAR multi-temporal mosaic) generated
GMES Service Element
Service Operations Report SENEGAL 2007
5.0, 17 March 2008
Project Deliverable: S6_SEN ESRIN Contract No. 17067/03/I-LG
Author(s): Josefien Delrue, Massimo Barbieri, Bernard Tychon, Louis Kouadio, Antoine Denis
Page 16 of 47 Figure 5: Detailed view of the multi-temporal ASAR composite (top images) and the corresponding
The CA products is derived from the combination of:
♦ ASAR AP amplitude images (acquisitions spanning from February to December 2007)
♦ Landsat 5 TM and Landsat 7 ETM+ multispectral archive images acquired between year 1999 and year 2000.
♦ Crop Acreage Map of year 2006. ♦ Spot acquisitions of year 2007.
The CA product contains the following classes:
ID code Class name
0 Unclassified pixels
1 Cultivated area (High Probability) 2 Cultivated area (Medium Probability) 3 Cultivated area (Low Probability)
4 Other Vegetation
5 Water
The High Probability class (ID 1) corresponds to those areas classified as crop in the previous season, which have confirmed the same behaviour in the current year.
The Medium Probability class (ID 2) corresponds to those areas, which had not been classified as crop in the previous season. These areas are classified as crop, for the first time, in the current year.
The Low Probability class (ID 3) corresponds to those areas classified as crop in the previous season, which have not confirmed the same behaviour in the current year.
GMES Service Element
Service Operations Report SENEGAL 2007
5.0, 17 March 2008
Project Deliverable: S6_SEN ESRIN Contract No. 17067/03/I-LG
Author(s): Josefien Delrue, Massimo Barbieri, Bernard Tychon, Louis Kouadio, Antoine Denis
Page 18 of 47
ANNEX III: AGRICULTURAL MAPPING PRODUCTS AT NATIONAL SCALE
Introduction
This document describes the procedures and methods used to generate the agricultural mapping products for the users in Senegal. The Extent of Cultivation Product (EoC) that has been produced, has been delivered to the CSE, user of the product, and the GMFS regional coordinator for further validation. The delivery of the products is part of the Service Level Agreement concluded between GMFS (VITO) and CSE.
The activities with respect to the EoC product have taken place from July 2007 to December 2007 in the following sequence: i. Selection and ordering of high resolution SPOT-4 images over the growing season (July 2007); ii. Collection of field data by ULg and the local partner, CSE (September 2007); iii. Analysis of fieldwork data and geocoding of SPOT imagery (September 2007); iv. Hard classification of SPOT imagery (October 2007); Sub-pixel classification of MERIS time series and generation of the EoC product (December 2007).
In a first step, adequate high resolution images, preferably SPOT-4, were selected and ordered via Eolisa. It was attempted to obtain at least two acquisitions per scene, in order to try a crop specific classification. Though, due to the abundant cloud coverage over the greater part of Senegal until August, only for a few scenes in the North multiple images were obtained. For the South (Casamance and Oriental Zone) there are even no suitable images for the 2007 growing season at all.
Chapter 2 describes the procedures followed for the collection of ground observations.
Chapter 3 describes the analysis of the SPOT data and chapter 4 describes the procedures followed to obtain the revised EoC products.
Field survey
The field survey in Senegal was conducted from 2 till 19 September 2007 and was carried out by mr. Antoine Denis, research assistant at the University of Liege, and mr. Gora Beye, regional representative of GMFS in Senegal. The survey consisted of multiple ‘transects’, whereby observations are recorded left and right from the track when driving through the landscape. The recordings were entered into an access data base with automatic time registration. Frequently pictures were taken. The synchronisation between the access data base, the GPS and the photo camera allowed to join all data seamlessly together.
Heeft Antoine niet enkel links van de weg gekeken, misschien zijn aanbevelingen voor de verbetering van het veldwerk ook vermelden.
The survey resulted in a database of 10 GPS tracks, 10 700 observations and 2500 digital photos. Figure 2.1 indicates the area covered by the survey.
Figure 2.1: Location of the survey tracks in Senegal and the overlap with the SPOT images. During the field survey, 60 polygons are drawn on landscape elements in the SPOT images that are difficult to interpret from the image without specific knowledge and which could not be visited within the timeframe of the survey. Gora Beye identified the most suitable class for these polygons. Table 2.1 gives the land use classes that were taken into account for the fieldwork.
GMES Service Element
Service Operations Report SENEGAL 2007
5.0, 17 March 2008
Project Deliverable: S6_SEN ESRIN Contract No. 17067/03/I-LG
Author(s): Josefien Delrue, Massimo Barbieri, Bernard Tychon, Louis Kouadio, Antoine Denis
Page 20 of 47 Table 2.1: Land use classes distinguished during the fieldwork.
Cultivated land cereals Maize
Millet
Sorghum
Other crops Peanut
Manioc Niébé Beref Bissap Pastèque Other crops
Irrigated land Sugar Cane
Rice Orchard Plantation Fallow Dwelling Rural Urban Water River Lake Marsh
Vegetation Aquatic vegetation
Wooded land
Savannah Bush savannah
Tree savannah
Forest Bare soil
The HR hard classification is based on twelve SPOT HR images, spread over four of out of six agro-ecological zones: Peanut Basin, Silvo-Pastoral Zone, Niayes and Senegal River Valley. For the remaining zones, Casamance and Oriental Zone, there were no fieldwork data nor SPOT images available.
The SPOT HR images received from ESA, were level L1B images, dating from the middle of the growing season. Table 3.1 lists the acquisition dates per scene.
They were correctly geocoded by co-registration with historical Landsat ETM images. (Source of these data sets was the Global land Cover Facility www.landcover.org). This operation was executed with the automatic registration tool IG-ART, developed by IncGEO, and with the georeferencing tool of ArcGIS.
Table 3.1: Acquisition dates for the SPOT scenes used in the hard classification Column Row Acquisition
August Acquisition September Overlap with fieldwork 21 320 11/08/2007 Yes 22 318 01/08/2007 22/09/2007 No 22 319 01/08/2007 22/09/2007 Yes 22 317 01/08/2007 22/09/2007 Yes 23 322 22/09/2007 Yes 23 321 22/09/2007 Yes 23 319 22/08/2007 Yes 24 318 22/09/2007 No 24 319 22/08/2007 Yes 24 317 12/09/2007 Yes 25 321 22/09/2007 No 25 320 22/09/2007 No
Eight of the twelve SPOT images were sufficiently covered by the fieldwork tracks. Sixty percent of the fieldwork data that fell within these images was used to calibrate the hard classification, the remainder was used later on to validate the classification result. If a class was not represented by a sufficient amount of pixels, data from the photo-interpreted polygons was also used.
Furthermore, four SPOT images outside the fieldwork region were classified merely based on photo-interpretation. This ensured that all prominent land use types within the agro-ecological zone are covered by the hard classification.
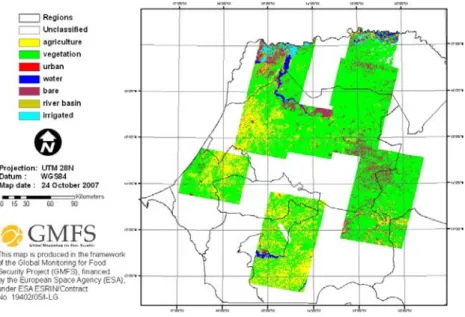
Seven classes were distinguished, which were derived from the list of classes in the fieldwork data set (Table 2.1): 1. agriculture 2. irrigated crops 3. vegetation 4. urban 5. water
6. water vegetation/river basin 7. bare soil
GMES Service Element
Service Operations report Senegal
Version 5.0, 17 March 2008
Project Deliverable: S6_SEN ESRIN Contract No.
19402/05I-LG
Author(s): Josefien Delrue, Massimo Barbieri, Bernard Tychon, Louis Kouadio, Antoine Denis
Page 22 of 47 Figure 3.1: Classification of the SPOT images over Senegal
The output of the classification was validated using the remaining 40% of fieldwork data that was not used to calibrate the hard classification. Table 3.2 gives the confusion matrix of the hard classification with all classes, in table 3.3 only agriculture and non-agriculture is considered. The producer’s and user’s accuracy of cultivated land is fairly good. The low accuracy for urban and water can be explained by the size of the observed features. Urban often concerns just a couple of dwellings, water is sometimes merely a pool. Though, large cities and water bodies are correctly classified. The distinction between bare soil and savannah is not very clear. Savannah may have very few vegetation cover and bare soils may be sparsely vegetated.
When all non-agricultural classes are considered as one class (table 3.3), the accuracy increases with 9%.
Table 3.2: Confusion matrix and User’s and Producer’s accuracy for all classes of the hard classified image.
Overall accuracy 65.43% (3836/5863)
Kappa coefficient 0.45
Ground truth (pixels)
Class Urban Agriculture Irrigated Bare Water Vegetation Total
Urban 275 13 0 0 0 8 296 Agriculture 78 1880 0 20 12 433 2423 Irrigated 3 0 72 0 7 19 101 Bare 3 23 5 102 0 73 206 Water 19 0 0 0 13 1 33 Vegetation 224 884 1 188 13 1494 2804 Total 602 2800 78 310 45 2028 5863 Class Prod. Acc. (%) User Acc. (%) Urban 45.68 92.91 Agriculture 67.14 77.59 Irrigated 92.31 71.29 Bare 32.90 49.51 Water 28.89 39.39 Vegetation 73.67 53.28
Table 3.3: Confusion matrix and User’s and Producer’s accuracy for agriculture and non-agriculture. Overall accuracy 74.14% (4365/5887)
Kappa coefficient 0.48 Ground truth (pixels)
Class Other Agriculture Total
Other 2409 923 3332 Agriculture 599 1956 2555 Total 3008 2879 5887 Class Prod. Acc. (%) User Acc. (%) Other 80.09 72.30 Agriculture 67.94 76.56
GMES Service Element
Service Operations report Senegal
Version 5.0, 17 March 2008
Project Deliverable: S6_SEN ESRIN Contract No.
19402/05I-LG
Author(s): Josefien Delrue, Massimo Barbieri, Bernard Tychon, Louis Kouadio, Antoine Denis
Page 24 of 47
Extent of cultivation (EoC)
General
The Extent of Cultivation (EoC) product intends to give a qualitative indication of cropped areas for a given growing season. The EoC product is repetitive, as it is generated every growing season. It is based upon multi-temporal medium resolution fAPAR images (pixel size 300m), the CA product, multi-temporal characteristics of vegetation, and specific changes of agricultural land during the growing season (field clearance, sowing, senescence, harvesting, etc.). This requires repetitive acquisitions of satellite data during the growing season, typically once every 10 days. The extent of cultivation product covers large areas, potentially full countries.
fAPAR images
This section describes how the fAPAR images, main input to the classification algorithms, are generated. The fAPAR images are based upon the MERIS FR (Full resolution) sensor on board of ENVISAT. The data acquisition cycle is > 3 days. MERIS FR Level 1 input images were ordered in bulk for all regions of interest of GMFS and images are directly retrieved from a dedicated FTP server at ESA.
Based on the method of Gobron et al, fAPAR values are calculated for every retrieved scene. This is done using the blue, red and NIR bands from the original MERIS FR product. The calculated fAPAR values are then projected into a 250 meter grid and stored in ENVI format instead of the received N1 format. For every decade and for every month composites are made using a maximum value compositing step (selecting for the dedicated period the highest fAPAR value per pixel). The end result is an fAPAR image (undimensional with values between 0 and 1 in ENVI format, Geographic WGS84).
Figure 10: Processing scheme, fAPAR input products
MER_FRS__1P*.N1
Postprocessing
ESA FTP server
Extraction of red, nir, blue band
MVC Compositing fAPAR
Preprocessing
Projection to 250 m grid
Calculation of fAPAR
For each Region Of Interest
Generation of derived indicators
Generation of quick looks
GMES Service Element
Service Operations report Senegal
Version 5.0, 17 March 2008
Project Deliverable: S6_SEN ESRIN Contract No.
19402/05I-LG
Author(s): Josefien Delrue, Massimo Barbieri, Bernard Tychon, Louis Kouadio, Antoine Denis
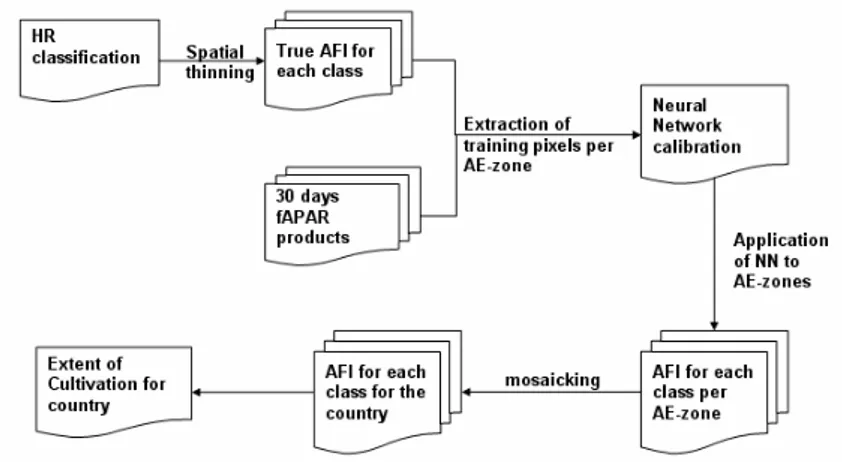
Page 26 of 47 Figure 4.2 shows the steps followed for the generation of the EoC product. In a first step the high resolution classification is transformed to ‘True Area Fraction Images’, one for each class, with the same resolution as the MERIS fAPAR images (250m). The pixel of an AFI of a certain class contains the fraction of that class within the pixel. There are as many AFI’s as there are classes under consideration, i.e. conform the SPOT-classification.
Figure 4.2: Processing sequence of the development of the EoC product.
Then the true AFIs were split in 3 zones, with differing soil suitability, climatic characteristics and vegetation types. The first zone is situated in the north of Senegal and exists of the Senegal river valley and the silvo-pastoral agro-ecological zone (AE-zone), the second zone is the central located Peanut basin and the third zone is the Niayes AE-zone, wich is located along the coast. The Casamance and the Oriental AE-zones are not covered by the true AFIs.
For each of the three zones, a neural network was trained with a time series of monthly fAPAR products as input and the AFIs of the SPOT images as output. The northern zone was trained with fAPAR images from May till September 2007 and the central and coastal zone, where the rain season starts earlier, with fAPAR images from April till September 2007. Once trained, the networks were applied on the respective zones. For the AE-zones for which no network was trained, the network was selected that represented best their agro-ecological characteristics. For Casamance, which contains an extension of the Peanut Basin, the network of the Peanut Basin was used. For the sparsely cultivated oriental zone the Silvo-Pastoral network was found to be most suitable.
The software used for the processing is GLIMPSE (Global Imaging Processing SoftwarE), which is developed by VITO.
Subsequently the obtained AFI’s were merged to obtain a nationwide AFI’s for each class. To create the EoC, for each pixel the dominant class was selected.
Result and Discussion
Two maps were generated from the outputs of the sub-pixel classification algorithm:
• Figure 4.3 is the Area Fraction Image for cultivated area in Senegal. Pixels with a high proportion of cultivated area are shown in bright green, a low proportion of cultivated area in bright red. General agricultural areas can easily be distinguished in such a map, e.g. the Peanut Basin in the centre of the country. It shows more detail than a classification map, like Figure 4.4, since also parts with no dominance of agriculture can be distinguished while this is usually not the case in a hard classification.
• Figure 4.4 and Figure 4.5 show the EoC as a hard classification of the medium resolution fAPAR MERIS imagery. For Figure 4.4 the dominant class per pixel was taken. For Figure 4.5 only the pixels with more than 30% agriculture were classified.
Figure 4.3: Estimated Are Fraction Image for the cultivated area in Senegal for the growing season of 2007. Zones with missing/ bad values (due to clouds etc.) are white.
GMES Service Element
Service Operations report Senegal
Version 5.0, 17 March 2008
Project Deliverable: S6_SEN ESRIN Contract No.
19402/05I-LG
Author(s): Josefien Delrue, Massimo Barbieri, Bernard Tychon, Louis Kouadio, Antoine Denis
Page 28 of 47 Figure 4.5: Estimated Extent of Cultivation in Senegal for the growing season of 2007. Zones with less than 30% agriculture are white.
The abrupt transitions in Area Fractions on Figure 4.3 correspond to the boundaries of the agro-ecological zones for which a different neural network was trained. This artefact is inherent to the method.
On the EoC in Figure 4.4, a vast areas of Tambacounda is classified as water/wetland. This area has a lot of forest. In the neural network from the Silvo-Pastoral zone, which was used for the sub-pixel classification of this regions, forest was not represented by a class and thus replaced by the class with the most similar spectrum.
The AFI product derived from the MERIS MR is meant to indicate the distribution of the agriculture. The resolution is too coarse to provide real area estimates. Though, a comparison of the regional area estimates derived from the AFI with official statistics is useful for the evaluation of the product. The estimated values should follow the same trends as the reference data.
In Table 4.1 the agricultural area per administrative region for 2007 as estimated by the sub-pixel classification method is compared with the DAPS statistics (2007) and the sub-pixel estimation for the previous season (2006).
From Table 4.1 it appears that the area estimation on country level is quite accurate. On the regional level, the major part follows the trend of the statistics. Though there are some deviations. The largest difference is for Louga. The network correctly recognises the location of the agriculture, but tends to give too high values. Probably it recognises part of the surrounding vegetation also as agriculture. Other overestimations occur for Saint-Louis, Fatick and Ziguinchor These regions have a river valley. The river banks are confused with agriculture. Tambacounda and Kolda are largely underestimated. For this two regions no neural network was available and therefore the network of and therefore the network of another zone was selected that represented best there agro-ecological characteristics. The difference in vegetation and crop types and the different progress of the growing season may explain the difficulties to extrapolate a neural network from the north to the south of the country.
Table 4.1: Agricultural area estimations (ha) per administrative region.
Adiminstrative region AFI 2007 DAPS statistics 2007 AFI 2006
Dakar 2383 1611 3263 Diourbel 167140 162928 152721 Fatick 226232 212750 195964 Kaolack 465928 470542 467120 Kolda* 214390 257897 296088 Louga 333025 217645 297791 Matam 41058 43629 97403 Saint-Louis 60039 23087 63517 Tambacounda* 150149 183642 100349 Thies 218453 218816 160093 Ziguinchor* 56963 39060 11941 1935759 1831607 1846250
(* no reference data was available to train a neural network for this region. A network was selected that represented best their agro-ecological characteristics.)
In Figure 4.6 the fraction of agriculture per region as estimated for 2007 is compared with the fraction of (a) agriculture derived from the DAPS statistics and (b) the estimates of the previous season (2006). In the first scatterplot there is one prominent outliers, which corresponds to Louga. Besides this, the regression implies a good correspondence between the estimated and reference fractions.
From the second scatterplot it can be concluded that the estimates of 2007 and 2006, calculated by the same method, are quite consistent.
Figure 4.6: Fraction of agriculture per administrative region estimated for 2007 compared with (a) DAPS statistics and (b) estimates 2006.
(a) y = 1,0314x - 0,0183 R2 = 0,9895 0,00 0,05 0,10 0,15 0,20 0,25 0,30 0,35 0,00 0,10 0,20 0,30 0,40 Estimated fraction AFI 2007
R ef erenc e f ra c ti on d aps 200 7 (b) y = 0,8502x + 0,0082 R2 = 0,9289 0,00 0,05 0,10 0,15 0,20 0,25 0,30 0,35 0,00 0,10 0,20 0,30 0,40 Estimated fraction AFI 2007
E s ti m a ted f ra c ti on A F I 2006
Recommendations
GMES Service Element
Service Operations report Senegal
Version 5.0, 17 March 2008
Project Deliverable: S6_SEN ESRIN Contract No.
19402/05I-LG
Author(s): Josefien Delrue, Massimo Barbieri, Bernard Tychon, Louis Kouadio, Antoine Denis
Page 30 of 47
ANNEX IV: CALIBRATION FIELD SURVEY (IN FRENCH)
Objectifs de la mission.
Cette mission avait deux objectifs :1. Tenir une réunion avec les principaux acteurs de la prévision des rendements au Sénégal afin d’établir un état des lieux de l’état de l’avancement de la prévision 2007 et de répondre à des questions d’ordre technique concernant la prévision.
2. Collecter des informations sur l’occupation du sol (cultures et non-cultures) au cours d’une campagne de terrain de 10 jours, pour aider à la classification des images SPOT 2007.
Compte-rendu de la réunion du 04/09/07 sur la « Prévision
des rendements ».
Cette réunion rassemblait les principaux intervenants chargés de la prévision des rendements au Sénégal en 2007, à savoir :
• M Gora BEYE, du CSE
• M Ousmane DIAGNE, de la DAPS • Mme Amy SAL, de la DMN • M Antoine DENIS, de l’ULg. Amy SAL :
• Elle avait en sa possession la grande majorité des données météorologiques journalières et décadaires, jusqu’à la troisième décade d’août, nécessaires à la prévision des rendements, mis à part quelques stations manquantes qu’elle espérait obtenir incessamment.
• Elle devait encore convertir le fichier météo Excel en format « .CSV » et produire les données relatives au cycle de végétation dans AgroMet Shell.
Gora BEYE :
• Les images NDVI 2007 n’étaient pas encore en sa possession.
• Il devait transmettre les données découlant des images NDVI utiles à la prévision des rendements à Ousmane Diagne pour le 17 septembre 2007.
Ousmane DIAGNE :
• Il attendait les données provenant de Gora BEYE et Amy SAL pour réaliser la première prévision.
La conclusion de la réunion fut que la première prévision des rendements pourrait être réalisée par Ousmane DIAGNE à partir du 18 septembre 2007 au plus tôt, une fois que celui-ci aurait reçu les données de Gora et Amy. Aucune difficulté ne fut soulevée.
Déroulement de l’enquête de terrain GPS menée par le CSE et
l’ULg.
La campagne de terrain s’est déroulée du 04 au 13 septembre 2007.
La méthodologie suivie fut celle proposée par Josefien Delrue dans ses documents intitulés « Campagne de terrain 2007.doc » et « GPS.doc ».
Cependant, quelques modifications y ont été apportées :
• L’intervalle de temps entre l’enregistrement de deux points GPS successifs fût de 1 seconde plutôt que 5 secondes.
• Certaines classes d’occupation du sol ont été ajoutées dans la table ACCESS par rapport à la table proposée dans le document « Campagne de terrain 2007.doc ». La table
utilisée pendant la campagne est présentée à la figure 1 ci-dessous. La classe « Canne à sucre » devrait encore être ajoutée.
Figure 2: classes d’occupation du sol utilisées dans la base ACCESS.
• Certaines zones difficilement photointerpretables furent identifiées et les coordonnées des points correspondants enregistrées dans un GPS. Au cours de la campagne, nous avons tenté de « naviguer » vers ces points afin de connaitre l’occupation du sol réelle de ces points. Cette approche ne fut suivie que pour quelques points seulement. La principale raison est que nombre de ces points étaient difficilement accessible sur le terrain (risque d’embourbement important en dehors des pistes, surtout au cours de la saison des pluies. Nous sommes d’ailleurs restés immobilisés 4h suite à un embourbement).
GMES Service Element
Service Operations report Senegal
Version 5.0, 17 March 2008
Project Deliverable: S6_SEN ESRIN Contract No.
19402/05I-LG
Author(s): Josefien Delrue, Massimo Barbieri, Bernard Tychon, Louis Kouadio, Antoine Denis
Page 32 of 47 Les données récoltées sont :
• « GPS Tracks » : ensemble de points GPS enregistrés, chaque seconde, au cours de nos déplacements dans les régions d’intérêts. Les départements visités sont repris ci-dessous et illustrés à la figure 2. • Podor • Tivaouane • Dagana • Mback • Saint-Louis • Diourbel • Louga • Bambey • Linguere • Thies • Kebemere • Gossas • Kaffrine
Figure 2 : en noir, les tracks prises lors de la campagne de terrain 2007, en rouge, les polygones photo interprétés par Gora Beye sur base des images SPOT 2007, les lignes bleues foncées sont les
départements et les carrés bleus clairs représentent la localisation des images SPOT2007 commandées.
Les départements du Sud (Velingra, Kolda, Sedhiou, Bigona, Ziguinchor,) n’ont pas été visités par manque de temps. Certaines régions (route entre Podor et Linguere par exemple) n’étaient pas accessibles à cette période (saison des pluies), les pistes étant impraticables.
• 2 500 photos numériques des occupations du sol, prises à gauche et à droite du véhicule servant à nos déplacements pendant l’enregistrement des « GPS tracks ».
• Fichiers ACCESS décrivant l’occupation du sol observée à droite et à gauche du véhicule pendant l’enregistrement des « GPS tracks ».
• Un fichier « shapefile polygones » de zones photointerpretés par Gora BEYE et Antoine DENIS à partir des images SPOT 2007 reprenant des éléments particuliers du paysage dont la photointerpretation demande une certaine expertise. Une soixantaine de polygones ont été photointerpretés, dont la moitié sont caractérisés par un intervalle de confiance de la photointerpretation (basé sur le degré de certitude de Gora BEYE).
L’ensemble des données récoltées ainsi que quelques métadonnées ont été transmises à Josefien Delrue les 21 et 24 septembre 2007.
Proposition d’une autre méthodologie de la campagne de
terrain : utilisation du logiciel GPS « ArcPad ».
Une autre méthodologie que celle proposée par Josefien Delrue a été mise au point et testée pendant le premier jour de la campagne. Il s’agit non plus d’utiliser simultanément un GPS pour l’enregistrement des « tracks » d’une part et un fichier Access sur un ordinateur pour la description de l’occupation du sol d’autre part, mais de n’utiliser que le GPS qui peut combiner ces deux opérations. Le logiciel ArcPad, installé sur le GPS, fonctionne comme un programme SIG simplifié et permet d’enregistrer des points GPS (et non des tracks) dans un shapefile et d’éditer la table d’attribut de ce shapefile lors de l’enregistrement des points. La table d’attribut du shapefile ayant été préalablement construite avec des menus déroulants, le temps d’encodage est assez court (de l’ordre de quelques secondes pour enregistrer un point et éditer les champs « gauche » et « droite » décrivant l’occupation du sol). Cependant cette méthode fut abandonnée car ce temps d’encodage est bien supérieur au temps d’encodage très réduit dans Access (1 seconde pour un point). De plus, ce temps est parfois trop long, ne permettant pas l’encodage de toutes les variations d’occupation du sol pouvant avoir lieu pendant l’encodage d’un point, même en roulant à une vitesse réduite (30 km/h). Néanmoins, cette méthode, éventuellement adaptée, pourrait être utilisée dans le futur car elle présente les deux grands avantages suivants :
• Gain de temps, car aucun post-traitement n’est nécessaire : toute l’information (localisation et occupation du sol) sont contenues dans le shapefile créé dans ArcPad. Il n’y a plus besoin de faire les liens à posteriori entre le fichier Access et les tracks enregistrées.
• Gain de précision, car l’occupation du sol est directement reliée à une position (le point GPS), contrairement à la méthode utilisée actuellement pour laquelle le temps du GPS et du fichier Access (qui doivent être synchronisés) sont utilisés pour faire le lien entre l’occupation du sol et le point GPS, ce qui entraine une certaine imprécision, le temps du fichier Access ne correspondant pas parfaitement à celui des points du GPS.
GMES Service Element
Service Operations report Senegal
Version 5.0, 17 March 2008
Project Deliverable: S6_SEN ESRIN Contract No.
19402/05I-LG
Author(s): Josefien Delrue, Massimo Barbieri, Bernard Tychon, Louis Kouadio, Antoine Denis
Page 34 of 47
ANNEX V: YIELD FORECASTS FOR SENEGAL, SEASON 2007
Introduction
Ce rapport correspond au déliverable de la tâche WP3233 AMM Forecasting pour la saison 2007-2008. Le but est de prédire les rendements des cultures au niveau national en se basant sur un modèle agrométéorologique et sur des images satellitaires. La prédiction des rendements a été réalisée pour 3 cultures principales : le mil, l’archide et le sorgho. Les deux prévisions sont produites sur base des données disponibles à la première décade de septembre et à la troisième décade d’octobre 2007.
La prévision des rendements se fait en calculant le rendement au sein des départements situés dans le bassin arachidier puis en les agrégeant au niveau national. Le bassin arachidier est la principale région productrice en mil et en arachide avec respectivement 85 % et 74% de la production nationale) et assure la moitié de la production nationale en sorgho (54 %)1. L’estimation des rendements au niveau départemental est réalisée en étudiant la corrélation entre les données historiques de rendement et une série de facteurs agrométéorologiques (précipitations, état phénologique simulé par un MAM et le NDVI).
Le set de calibration comprend :
• Les données historiques décadaires des précipitations (fournies par la DMN) • Les données historiques agricoles (fournies par la DAPS et le CSE)
• Les images NOAA GAC du Sénégal (fournie par la FAO)
Par rapport à l’année précédente, la culture d’arachide a été rajoutée suite à la demande des partenaires sénégalais. La mise au point du modèle a été effectuée par Kouadio L. (2007) (http://www.hoefsloot.com/Downloads/TFE_Louis-Amani.pdf). Le maïs et le niébé n’ont pas été repris dans cette campagne faute de données fiables.
La méthodologie employée pour la construction du modèle de prévision a été décrite en détail dans le délivrable précédent. Une légère amélioration a cependant été apportée en ce sens que les variables explicatives potentielles de type météorologique ne sont plus considérées décade par décade mais par stade phénologique. Cette nouvelle façon de procéder permet de donner une valeur agronomique à ces variables explicatives, ce qui doit en principe rendre les modèles retenus plus robustes.
Les prévisions de rendement sont réalisées à deux moments avec les données disponibles : à la première décade de septembre et à la troisième décade d’octobre 2007 comme demandé par les statistiques agricoles. La première prévision est limitée au mil tandis que la seconde prévision, beaucoup plus importante pour les Services Statistiques Agricoles est calculée pour le mil, le sorgo et l’arachide.
La période historique pour l’analyse s’étale sur 19 années en 1986 et 2004 inclus. Les années 2005 et 2006 ont été rejetées en raison de la qualité douteuse des données statistiques à cette période.
Prévisions des rendements
Au niveau départemental
Pour chaque culture et pour chaque département, un modèle de prévision de rendement est construit. Seuls les départements pour lesquels le nombre de données historiques de rendement est supérieur à 10 sont inclus dans l’analyse. Le set de calibration pour chaque modèle contient les données disponibles à la première décade de septembre 2007 pour la première prévision et à la troisième décade d’octobre 2007 pour la seconde prévision. Les modèles sont élaborés dans Statistica 7.1 par régression linéaire multiple ascendante ‘pas à pas’. La régression pas à pas se compose des étapes suivantes (1) identification d’un modèle initial, (2) par itération, de nouvelles variables prédictives sont ajoutées pas à pas au modèle (3) fin de l’itération lorsque les variables indépendantes restantes n’améliorent pas le modèle ou quand un nombre maximum spécifié d’itérations est atteint2. Pour finir, les variables les plus explicatives (de 2 à 4 variables en fonction
du modèle) sont introduites dans relation linéaire avec le rendement (équation 1)
∑
=+
=
n i i i depa
b
x
Y
1*
(1)avec, Ydep, le rendement prédit au niveau départemental (kg/ha)
a, le terme indépendant
bi, le coefficient de régression pour la variable xi
xi, la variable explicative i
n, le nombre de variables explicatives (varie de 2 à 4)
En moyenne, pour chaque département et pour chaque culture, 4 modèles sont sélectionnés et comparés par validation croisée. Le modèle présentant le R²cv le plus élevé (coefficient de corrélation en validation croisée) est retenu. Seuls les modèles pour lesquels R²cv est supérieur à 0.2 sont pris en considération.
Au niveau national
Pour agréger le rendement prédit au niveau national, la méthode proposée par Tychon et Rosillon dans le délivrable précédent a été conservée.
Le rendement national est calculé sur base de tous les départements pour lesquels R²cv est supérieur à 0.2 (équation 2) pour chaque année, de 1986 à 2004. R² et RMSE sont calculés par comparaison avec les données de rendement de la DAPS.
n n i i i dep nat
a
S
S
Y
Y
*
1
*
1 ,⎟
⎠
⎞
⎜
⎝
⎛
=
∑
= (2)Avec, Ynat, le rendement prédit au niveau national (kg/ha)
Ydep,i, le rendement prédit pour le département i (kg/ha)
Si, la surface estimée pour le département i pour une culture donnée
GMES Service Element
Service Operations report Senegal
Version 5.0, 17 March 2008
Project Deliverable: S6_SEN ESRIN Contract No.
19402/05I-LG
Author(s): Josefien Delrue, Massimo Barbieri, Bernard Tychon, Louis Kouadio, Antoine Denis
Page 36 of 47 Statistica pour renforcer notre approche. Pour la prévision de la première décade de septembre 2007, étant donné que l’on avait fait une première prévision à cette date l’année dernière, on a conservé les départements de l’année 2006, à savoir Gossas, Kaffrine, Kebemer, Louga, Mbour et Tambacounda.
Résultats des prévisions
Rem : Pour le mil et le sorgho, les valeurs de rendements nationaux de référence sont celles de la FAO provenant de l’ancienne database FAO car, avant la saison 1996/1997, les données des rendements en mil et en sorgho fournies par la DAPS étaient agrégées en une seule et unique valeur.
Prévision des rendements en mil
Au niveau départemental
Deux prévisions des rendements ont été effectuées pour le mil. La première à la fin de la première décade de septembre la seconde après la troisième décade d’octobre.
Prévisions de rendement du Mil au 10 septembre
Le tableau 1 reprend les rendements en mil prévus pour les départements retenus dans le modèle national.
Comme l’année dernière, les différences de comportement entre département sont importantes. Certains départements voient leurs rendements augmenter alors que d’autres sont en très forte baisse. Les rendements très élevés dans les départements de Gossas et Kaffrine sont dûs aux excellentes précipitations de la fin du mois de juillet. Ils sont dûs à une augmentation de la végétation entre la fin juin et la fin juillet dans le département de Louga, zones où les données de précipitations n’ont pas pu être prises en considération dans le modèle parce que indisponibles pendant un trop grand nombre d’années. Les faibles rendements prévus pour Kébémer sont liés au démarrage tardif de la végétation observé au niveau du NDVI mais aussi via les précipitations cumulées en début de saison culturale particulièrement basses dans ce département.
Equations de prévisions des départements retenus :
Gossas : Yest = -99.76+5.832*pval-1.4*P23+2.03*P21+66.75*sdat-72.46*cr1a Kaffrine : Yest = 506.02+0.253*P21+7.176*ETAr-0.244*WEXf+1.69*WEXv-5.792*WHCi
Kebemer : Yest = -1263.2+2432*NDVI25+9.5*INDXNormal+5*WEXv+29.6*P18-564.5*NDVI16:20 Louga : Yest = 164.9-2341.8*NDVI18+1782.2*NDVI21
Mbour : Yest = 307.26+4.886*ETAr+3.219*WEXr-7.094*P19+1.291*WEXf-8.81*Année
Tambacounda : Yest = -236.43+1.117*WEXv+7.514*WEXi+37.178*peak-3.744*P17+0.36*P16:24 Tableau 1 : Rendement départemental en mil au 10 septembre 2007
Départements R²cv prédit (kg/ha) Rendement moyen observé Rendement 86-05 (kg/ha) Différence (%) Gossas 0.66 940 544 72.8 Kaffrine 0.36 1083 784 38.1 Kebemer 0.41 0 262 -100.0 Louga 0.46 312 194 60.8
Mbour 0.44 480 513 -6.4
Tamba 0.22 618 830 -25.5
Prévisions de rendements du Mil au 31 Octobre Nombre de départements disponibles : 15
Tableau 2 : Départements retenus pour le niveau national, corrélation croisée du modèle et variables prédictives retenues.
Département R²cv Variables prédictives
Foundiougne 0.26 ETAt, Cumm
Gossas 0.44 Cr1a, Pval
Mbour 0.51 ETAv, Pluvio_L
Thiès 0.66 ETAr, Pluvio_D, Pluvio_MS, Sdat
Diourbel 0.2 ETAt Pluvio_I
Equations de prévisions des départements retenus : Diourbel : Yest = -463.74 + 4.25*ETAt – 2.16*Pluvio_I Foundiougne: Yest = 1374.62 – 5.2*ETAt + 12.67*Cumm MBour : Yest = -142.36 + 13.76*ETAv + 1.39*Pluvio_L Gossas : Yest = 680.24 – 51.6*Cr1a + 7.23*Pval
GMES Service Element
Service Operations report Senegal
Version 5.0, 17 March 2008
Project Deliverable: S6_SEN ESRIN Contract No.
19402/05I-LG
Author(s): Josefien Delrue, Massimo Barbieri, Bernard Tychon, Louis Kouadio, Antoine Denis
Page 38 of 47
Tableau 3 : Rendement départemental en mil au 31 octobre 2007 Département Rendement estimé (kg/ha) Rendement moyen observé 1986-2004 (kg/ha) Différence
(%) Superficie moyenne emblavée DAPS 1986-2004 (%) Diourbel 590 505 17 4 Foundiougne 942 805 17 4 Gossas 557 542 3 5 Mbour 435 506 -14 5 Thiès 77 453 -83 3
Pour la seconde estimation, les prévisions sont inférieures. Les conditions pluviométriques se sont dégradées pendant la seconde partie de la campagne agricole. On constate que globalement les réductions de rendement dans les départements sont supérieures aux augmentations ce qui laisse supposer un rendement national inférieur à la normale. Il convient cependant d’attirer l’attention du lecteur sur le fait que le modèle est établi pour fonctionner correctement à l’échelle nationale et que les valeurs données au niveau des départements sont données à titre indicatif seulement.
Au niveau national
Au 10 septembre, la prévision calculée sur base des superficies en mil de l’année 2004 des 6 départements retenus. En effet, les années 2005 et 2006 ne sont pas suffisament fiables pour être prises en considération. Le rendement en mil au niveau national s’élève à 759 kg/ha.
Pour l’estimation du rendement national à la troisième décade d’octobre, nous utilisons les cinq départements du tableau 3. Les superficies départementales sont également les superficies de la dernière année pour lesquelles les valeurs des superficies sont fiables d’après la DAPS.
Le rendement estimé à la fin octobre 2007 pour le mil est de 574 kg/ha. Comparé à la moyenne des 5 dernières années, 649 kg/ha, cela représente une baisse de près de 12%, ce qui est loin d’être négligeable.
La différence entre les deux dates de prévisions est importante, 185 kg/ha. Elle s’explique par la difficulté de faire des prévisions en début de saison, alors que plus de la moitié du cycle cultural reste encore à accomplir. Dans le cas présent, la seconde partie du cycle a été très défavorable à la culture de mil. Cette seconde partie du cycle ne peut pas être prise en compte par le modèle établi au 10 septembre qui suppose une situation normale après cette date pour établir une prévision de rendement. Cette année cela a clairement conduit à une surestimation des rendements.
Prévision des rendements en Sorgho
Au niveau départemental
Seuls 11 départements ont pu être pris en compte en raison de l’absence de données statistiques sur une période suffisament longue pour un bon nombre de départements.
En outre, seuls les départements de Bambey, Kaffrine, Mbour et Tambacounda présentent un R²cv supérieur à 0.2. (cf. tableau 4.) montrant par là la très faible corrélation entre nos modèles départementaux et les rendements mesurés par les statistiques agricoles.
Tableau 4: Départements retenus pour le niveau national, corrélation croisée du modèle et variables prédictives retenues.
Département R²cv Variables prédictives
Bambey 0.34 WEXf, Pluvio_I, Cumm
Mbour 0.46 Pluvio_I, Pluvio_D, Vert, Peak
Tambacounda 0.3 WEXt, Sval, Année
Equations de prévisions des départements retenus :
Bambey : Yest = 129.34 + 1.64*WEXf – 0.14*Pluvio_I + 18.79*Cumm
Kaffrine: Yest = 58714.7 + 26.75*WEXi – 0.65*Pluvio_MS + 24.67*Cumm – 29.36*Année MBour : Yest = 3337.28 – 0.56*Pluvio_I + 1.08*Pluvio_D + 10.57*Vert – 133.35*Peak Tambacounda: Yest = -20839.7 + 0.7*WEXt + 17.2*Sval + 10.3*Année
Prévisions de rendements de Sorgho au 31 Octobre
Tableau 5 : rendement départemental en sorgho au 31 octobre 2007 Département Rendement estimé (kg/ha) Rendement moyen observé 1986-2004 (kg/ha) Différence
(%) Superficie moyenne emblavée DAPS 1986-2004 (%) Bambey 683 593 15 1 Kaffrine 1499 870 54 24 Mbour 576 545 6 4 Tambacounda 1032 969 7 17
Pour l’ensemble des départements considérés, une hausse de rendements est attendue pour fin octobre 2007, plus particulièrement au niveau du département de Kaffrine (54%). Dans ce département l’indice de satisfaction en eau est bon durant tout le cycle et surtout durant la phase de floraison et fructification, ce qui expliquerait la tendance à la hausse du rendement puisque cette phase est une phase sensible de la croissance du sorgho.
Cependant, la prise en compte de ces quatre départements pour la prévision de la production nationale ne fournit pas une bonne estimation : R² = 0.04, RMSE = 57 kg/ha. Nous ne pouvons donc pas fournir une estimation du rendement national fiable pour la fin octobre 2007.
Prévision des rendements en arachide
Nombre de départements disponibles : 19Le tableau ci-après donne les départements pour lesquels le R²cv est supérieur à 0.2. Au total nous avons 16 départements sur 19.
Tableau 6 : Départements retenus pour le niveau national, corrélation croisée du modèle et variables prédictives retenues.
GMES Service Element
Service Operations report Senegal
Version 5.0, 17 March 2008
Project Deliverable: S6_SEN ESRIN Contract No.
19402/05I-LG
Author(s): Josefien Delrue, Massimo Barbieri, Bernard Tychon, Louis Kouadio, Antoine Denis
Page 40 of 47 Vélingara 0.38 NDVI_L, Pluvio_I, Pluvio_D, Pluvio_L
Bambey 0.67 Peak, Pval
Diourbel 0.55 CR1a, NDVI_D
Fatick 0.54 WEXv, Pluvio_I, Pval
Gossas 0.2 NDVI_D, Pluvio_L
Kaffrine 0.79 IndexLatest, Pluvio_D, Vert Kaolack 0.3 IndexNormal, WEXv, NDVI_MS, Vert
Kébémer 0.43 WEXv, CR1a, Vert
Mbacké 0.48 Pluvio_MS, Cumm
Mbour 0.47 IndxNormal, Pluvio_L
Nioro du rip 0.32 WEXv, WEXt, Pluvio_MS, Sval
Thiès 0.74 WEXv, WEXf, NDVI_MS, Pluvio_L
Le rendement national peut être calculé sur base de tous les départements pour lesquels R²cv est supérieur à 0.2 (équation 2) pour chaque année, de 1986 à 2004. R² et RMSE sont calculés par comparaison avec les données de rendement de la DAPS.
Cependant, le tableau 7 montre que pour une meilleure prévision nationale à la fin octobre, il est préférable de ne pas considérer l’ensemble des départements mais seulement un certain nombre d’entre eux. Dans le cas présent, la solution 3 du tableau 1 semble la mieux indiquée.
Tableau 7: sélection des départements pour le calcul du rendement au niveau national au 31.10.2007
DEPARTEMENTS R² RMSE
(kg/ha) 1 Bakel, Tambacounda, Vélingara, Bambey, Diourbel, Fatick, Gossas,
Kaffrine, Kaolack, Kébémer, Mbacké, Mbour, Nioro, Thiès, Tivaouane
0.44 43
2 Fatick, Kaffrine, Kébémer, Mbacké, Tivaouane 0.28 72
3 Tambacounda, Bambey, Fatick, Gossas, Kébémer, Mbacké, Mbour, Tivaouane
0.66 34
Equations de prévisions des départements sélectionnés pour l’estimation à l’échelle nationale Mbacké : Yest = -767.97 + 1.94*Pluvio_MS + 47.69*Cumm
Fatick : Yest = -2429.16 – 6.47*WEXv – 2.73*Pluvio_I + 31.61*Pval Tivaouane: Yest : -535.13 + 101.9*WDEFf – 2.23*Pluvio_D + 68.43*Cumm Tambacounda : Yest = 309.97 + 12*Pval – 64.72*Sdat
Kébémer : Yest = 689.35 – 7.11*WEXv – 61.95*CR1a + 22.74*Vert Gossas : Yest = -581.18 + 1547.74* NDVI_D + 3.16 *Pluvio_L Mbour : Yest = -1067.31 + 14.67*IndxNormal + 1.74*Pluvio_L Bambey : Yest = 140.33 – 69.88*Peak + 20.18*Pval
GMES Service Element
Service Operations report Senegal
Version 5.0, 17 March 2008
Project Deliverable: S6_SEN ESRIN Contract No.
19402/05I-LG
Author(s): Josefien Delrue, Massimo Barbieri, Bernard Tychon, Louis Kouadio, Antoine Denis
Page 42 of 47
Tableau 8: rendement départemental en arachide au 31 octobre 2007 Département Rendement
estimé (kg/ha) moyen DAPS Rendement 1986-2004
(kg/ha)
Différence
(%) Superficie moyenne emblavée DAPS 1986-2004 (%) Bambey 597 597 0 3 Fatick 694 692 0.4 4 Gossas 28 644 -96 5 Kébémer 501 481 4 5 Mbacké 561 559 0.4 4 Mbour 400 499 -20 3 Tambacounda 1085 1085 0 7 Tivaouane 307 547 -44 5
Les départements sélectionnés pour la prévision du rendement à l’échelle nationale représentent 36% de la superficie moyenne emblavée en arachide.
Au niveau des départements de Bambey, Fatick, Mbacké et Tambacounda, les rendements prévus pour 2007 ne diffèrent pas ou diffèrent très peu de la moyenne observée durant la période 1986-2004. Pour les départements de Tambacounda et Mbacké plus particulièrement, le rendement est fortement corrélé à Pval qui n’est autre que la valeur maximum du NDVI durant la saison agricole. On note également une forte tendance à la baisse pour les départements de Gossas. L’une des variables les plus explicatives du rendement au niveau de Gossas est le cumul pluviométrique observé durant la phase de remplissage des gousses et de maturation. En 2007 la pluviométrie durant ces décades n’a pas été bonne, ce qui expliquerait cette chute du rendement.
Pour la prévision à l’échelle nationale, il ne se dégage aucune tendance à la hausse ou à la baisse des superficies. Pour déterminer Si (voir équation 1), nous utiliserons par conséquent la moyenne obtenue pour la période 2002 à 2004.
Le rendement national estimé pour fin octobre 2007 est de : 725 kg/ha. Sur la période de 1986 à 2004, le rendement moyen national est d’environ 780 kg/ha.
Le rendement estimé pour fin octobre 2007 représente une baisse de 7% par rapport à ce rendement moyen.
Discussion et Conclusions
Les prévisions pour l’année culturale 2007/2008 pour les deux cultures qui ont pu être suivies indiquent une chute de rendement tant pour la mil que pour l’arachide, respectivement -12% et -7%. Ces baisses de rendement sont à mettre sur le compte d’une pluviométrie plus réduite en fin de cycle ce qui a mené à des stress hydriques dans beaucoup de départements sénégalais. Les conditions ne sont cependant pas homogènes sur l’ensemble du territoire car il apparaît clairement des zones à très bons rendements. Cette variabilité spatiale montre la nécessité d’une analyse spécifique par départements. Une analyse globale à l’échelle nationale n’aurait probablement pas permis une telle prévision.
La prévision de la premère décade de septembre annonçait une bonne saison agricole pour le mil. Cette prévision n’a pas été confirmée par la prévision d’octobre en raison d’une fin de saison particulièrement défavorable. A l’avenir, il parait peu raisonnable de s’appuyer sur cette première prévision aussi précoce dans le cycle, tant l’incertitude sur le devenir de la campagne est grande en ce début de cycle. Une première prévision à la troisième décade de septembre est plus réaliste.
Aucune prévision n’a pu être effectuée pour le sorgho, essentiellement par manque de données météo et de statistiques agricoles. S’il est vrai que la production de sorgho est localisée dans le Sud du Sénégal et qu’il aurait fallu déplacer la zone de suivi vers le Sud, il n’en demeure pas moins vrai que la qualité des statistiques agricoles et les trous dans les données météorologiques constituent les principaux facteurs limitants de la méthodologie.
Les cultures de maïs et de niébé n’ont pas été analysées cette année par manque de temps mais aussi parce que les propositions d’amélioration émises l’année dernière, essentiellement l’amélioration du set de données d’entrée de nos modèles, n’ont pas pu être réalisées.
La prévision de rendement pour l’arachide, culture de rente stratégique pour le Sénégal, a été effectuée cette année pour la première fois. Kouadio (2007) a montré le grand potentiel de la démarche dans son Travail de fin d’étude et la méthode a été appliquée sur l’année en cours pour la prévision d’octobre. Comme c’est souvent le cas pour les cultures de rente, les statistiques agricoles sont beaucoup plus complètes que pour les céréales et cela conduit à des prévisions plus fiables.
L’apport de la télédétection est déterminant dans la méthodologie. Sur les 23 modèles départementaux utilisés pour les prévision des rendements des trois cultures étudiées, 18 fois une information provenant de la télédétection est reprise. Une contrainte importante demeure cependant la nécessité de disposer de longues séries de données, ce qui concrêtement limite nos possibilités au seul senseur NOAA. Nous avons cependant montré les possibilités de poursuivre la série avec du SPOT-VGT moyennant une équation d’ajustement linéaire.
L’approche développée a donné des résultats satisfaisant. Elle peut cependant encore être améliorée mais cela ne pourra se faire que par la prise en charge de la démarche par les partenaires sénégalais. Leur apport sera déterminant dans la fourniture des données d’entrée et des statistiques agricoles validées, en particulier pour les cultures céréalières. Leur expertise de terrain a souvent manqué dans l’élaboration des modèles et à ce niveau-là aussi, leurs interventions devraient conduire à des améliorations notables.
GMES Service Element
Service Operations report Senegal
Version 5.0, 17 March 2008
Project Deliverable: S6_SEN ESRIN Contract No.
19402/05I-LG
Author(s): Josefien Delrue, Massimo Barbieri, Bernard Tychon, Louis Kouadio, Antoine Denis
Page 44 of 47