HAL Id: hal-02373268
https://hal.archives-ouvertes.fr/hal-02373268
Submitted on 20 Nov 2019HAL is a multi-disciplinary open access
archive for the deposit and dissemination of sci-entific research documents, whether they are pub-lished or not. The documents may come from teaching and research institutions in France or abroad, or from public or private research centers.
L’archive ouverte pluridisciplinaire HAL, est destinée au dépôt et à la diffusion de documents scientifiques de niveau recherche, publiés ou non, émanant des établissements d’enseignement et de recherche français ou étrangers, des laboratoires publics ou privés.
Carbons with Regular Pore Geometry Yield
Fundamental Insights into Supercapacitor Charge
Storage
Yifei Michelle Liu, Céline Merlet, Berend Smit
To cite this version:
Yifei Michelle Liu, Céline Merlet, Berend Smit. Carbons with Regular Pore Geometry Yield Funda-mental Insights into Supercapacitor Charge Storage. ACS Central Science, ACS Publications, 2019, 5 (11), pp.1813. �10.1021/acscentsci.9b00800�. �hal-02373268�
Carbons with Regular Pore Geometry Yield Fundamental Insights
into Supercapacitor Charge Storage
Yifei Michelle Liu,
†,‡Céline Merlet,
¶,§and Berend Smit
*
,‡,††Department of Chemical and Biomolecular Engineering, University of California, Berkeley, California 94720, United States ‡Laboratory of Molecular Simulation (LSMO), Institut des Sciences et Ingénierie Chimiques, École polytechnique fédérale de
Lausanne (EPFL), Rue de l’Industrie 17, CH-1951 Sion, Switzerland
¶CIRIMAT, Université de Toulouse, CNRS, Bât. CIRIMAT, 118, route de Narbonne, 31062 Toulouse cedex 9, France §Réseau sur le Stockage Électrochimique de l’Énergie (RS2E), Fédération de Recherche CNRS 3459, HUB de l’Énergie, Rue
Baudelocque, 80039 Amiens, France
*
S Supporting InformationABSTRACT: We conduct molecular dynamics simulations of electrical double-layer capacitors (EDLCs) using a library of ordered, porous carbon electrode materials called zeolite templated carbons (ZTCs). The well-defined pore shapes of the ZTCs enable us to determine the influence of pore geometry on both charging dynamics and charge storage mechanisms in EDLCs, also referred to as supercapacitors. We show that charging dynamics are negatively correlated with the pore-limiting diameter of the electrode material and display signatures of both progressive charging and ion trapping. However, the equilibrium capacitance, unlike
charging dynamics, is not strongly correlated to commonly used, purely geometric descriptors such as pore size. Instead, we find a strong correlation of capacitance to the charge compensation per carbon (CCpC), a descriptor we define in this work as the average charge of the electrode atoms within the coordination shell of a counterion. A high CCpC indicates efficient charge storage, as the strong partial charges of the electrode are able to screen counterion charge, enabling higher ion loading and thus more charge storage within the electrode at afixed applied voltage. We determine that adsorption sites with a high CCpC tend to be found within pockets with a smaller radius of curvature, where the counterions are able to minimize their distance with multiple points on the electrode surface, and therefore induce stronger local partial charges.
■
INTRODUCTIONEnergy storage is becoming ever more important as society moves away from fossil fuels toward a cleaner energy paradigm. Storage technologies are often compared using the high-level metrics of energy density and power density. Batteries have relatively high energy density and low power density, while traditional capacitors have high power density and low energy density.1,2One advantage of capacitors is that, since they store energy through electric charge, they do not degrade as easily as batteries, which store energy through a chemical reaction. Capacitors are thus able to provide millions of charge− discharge cycles, versus several thousand cycles for the best-performing batteries.3 Motivation to increase the energy density of capacitors has spurred the development in the past few decades of a new type of capacitor, called the electrical double layer capacitor (EDLC), or supercapacitor. EDLCs are differentiated from traditional capacitors by having a liquid electrolyte in place of a solid dielectric. Under an applied voltage, the accumulation of positive and negative ions at the anode and cathode, respectively, leads to the creation of a double layer at each electrode.
The energy density of a capacitor is proportional to the capacitance, defined as the amount of charge, Q, stored by a capacitor at a given voltage, V3
C Q V
=
(1)
For an idealized parallel plate capacitor consisting of metallic electrodes enclosing a dielectric medium of uniform dielectric constant,ε, the capacitance can be derived exactly as
C=εA d/ (2)
where A is the cross-sectional area of the capacitor and d is the separation distance between the electrodes. If we transpose this expression to an EDLC, A would be the surface area of the electrode which is accessible to electrolyte ions, and d the characteristic thickness of the electrode−electrolyte interface.
Equation 2 provides some intuition for why EDLCs have
increased capacitance over their traditional counterparts: First, Received: August 8, 2019
Research Article http://pubs.acs.org/journal/acscii
Cite This:ACS Cent. Sci. XXXX, XXX, XXX−XXX
© XXXX American Chemical Society A DOI:10.1021/acscentsci.9b00800
ACS Cent. Sci. XXXX, XXX, XXX−XXX
copying and redistribution of the article or any adaptations for non-commercial purposes.
the charge separation distance is smaller in an EDLC than in a traditional capacitor, since ions can approach within less than 0.5 nm of the electrode surface, while in a traditional capacitor d is a few nanometers or higher.3,4 Second, the accessible surface area of an EDLC can be increased by several orders of magnitude using rough or porous electrode.
Multiple theories have arisen to describe the electrochemical double layer, beginning with the classical theory of Helmoltz,5,6 which was subsequently improved by Gouy,7 Chapman,8 and Stern9 to consider discrete ions and complex double layer structures. These theories can accurately predict capacitances of EDLCs whose pores are macroscopic. However, when the pores become comparable in size to the electrolyte ions, so-called “anomalously” high capacitances have been observed that break with both existing theories and empirical trends.10,11 Reports of materials with such impressive capacitances have led to considerable growth in the field of microporous materials for EDLCs, to better understand the mechanisms behind capacitance in small pores.12−18
A popular choice of material for EDLC electrodes is porous carbon, due to its stability, ease of synthesis, and low cost. Porous carbons used in EDLCs include activated carbons,11 carbide-derived carbons,10,19 carbon onions and nanotubes,20 carbonized precursors such as metal−organic frameworks,21 and graphene-based composites.22,23 Experiments and simu-lations have shed some light on the charge-storage mechanisms in such materials;14−16,24,25however, a major challenge is that most microporous carbon materials have neither a narrow pore size distribution nor a regular structure with long-range order, making it difficult to draw conclusions between structure and performance.
A new class of materials called zeolite-templated carbons (ZTCs), which are synthesized using a sacrificial zeolite scaffold,26−28 has been demonstrated as a promising EDLC material.29−32Thus far, ZTCs have been synthesized from just three zeolites (FAU, EMT, and beta) of the 245 frameworks recognized by the IZA Structure Commission.33−35Recently, Braun and co-workers reported a method to computationally synthesize ZTCs from a given zeolite structure, and then predict whether the ZTCs are experimentally synthesizable based on stability during finite-temperature molecular dynamics simulations.36Their predicted ZTCs are composed of sp2-hybridized carbons that tile a surface that is dual to the
zeolite. Templating on a crystalline framework confers well-defined pore geometries that could yield insights into the structure−property relationships of electrode materials, motivating further study of ZTCs for energy storage applications.
In this work, we use molecular dynamics (MD) simulations to screen the ZTC materials of Braun et al. as electrode materials in EDLC cells. We show that the charging time scale
of the ZTCs is negatively correlated with pore limiting diameter, and that there is evidence of both progressive charge penetration and kinetic trapping within the ZTCs during charging. We then study the equilibrium capacitance of the ZTCs to investigate the correlation between geometric descriptors, local electrolyte configurations, and charge storage mechanisms within the electrode. Introducing the concept of charge compensation per carbon (CCpC), wefind that charge storage is more efficient at ion adsorption sites with high CCpC, which are more likely within pores with a lower radius of curvature. Conversely, charge storage is diminished at high-radius-of-curvature sites and within sites with a mismatch of local pore diameter and ion size.
■
RESULTS AND DISCUSSIONAs demonstrated in the Supporting Information, we determined suitable protocols for building an EDLC simulation cell and tested different MD equilibration schemes. Here we present the results of our simulations using the constant-potential method for charge equilibration, discussing first the dynamics of charging and then equilibrium capacitances.
Charging Dynamics. An EDLC cell can be represented macroscopically with an equivalent circuit model,3 which can range in complexity from an RC circuit, consisting of a capacitor in series with a resistor (representing the electrode capacitance and solution resistance, respectively), to more detailed representations such as a transmission line model, which assumes that the properties of the circuit are distributed continuously throughout the material and thus models the EDLC as a series of individual circuit elements, or electrode “slices.”37
These more complex models, such as the trans-mission line model used by multiple groups,38,39are especially useful when extrapolating macroscopic charging dynamics from microscopic simulations. Since we only want estimates of the relative charging dynamics among different ZTC materials, we use here the simplest RC equivalent circuit (effectively a one-slice model) to model the ZTC EDLCs.
Under an applied constant potential, the accumulated charge in an RC circuit exponentially approaches its equilibrium value.40We thereforefit the transient charge per atom q(t) of the EDLCs to the exponential function
q t( )=q∞(1−e−t/τ) (3)
where q∞is the infinitely equilibrated charge per atom of the capacitor andτ is the time constant of the exponential, which for an RC circuit is R× C (the product of the resistance and the capacitance of the circuit). The circuit is considered to be equilibrated after 5τ, at which point the charge is within 1% of the infinitely equilibrated charge.
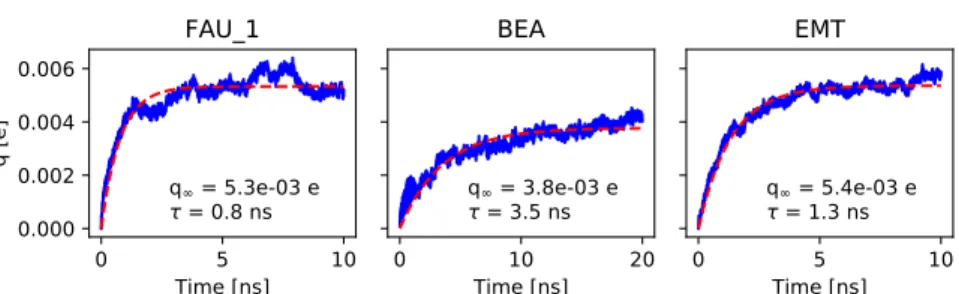
Figure 1.Evolution of average absolute charge per atom for FAU_1, BEA, and EMT, with a constant potential drop of 1 V applied to the cell starting at t = 0 ps. Exponentialfit is shown in the red dashed line and fit parameters are provided in the label.
ACS Central Science
DOI:10.1021/acscentsci.9b00800
ACS Cent. Sci. XXXX, XXX, XXX−XXX
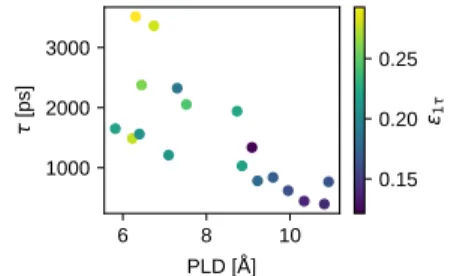
Examples of the exponentialfits for the charging of FAU_1, BEA, and EMT are shown inFigure 1. For all of the structures, the electrode atom charges are underestimated by the exponentialfit during the first 1 to 2 ns of constant-potential charging (SI Figure S10). Defining an “average residual” ε1τto be the relative root-mean-square error (RMSE) between the exponential fit and the charging profile over the first characteristic time, we plot the characteristic time τ against the pore limiting diameter (PLD) of the material, with the points colored to showε1τ, in Figure 2. We observe that τ is
negatively correlated with PLD, consistent with work from Vasilyev et al.,41on CDCs, indicating that it takes longer for charge to equilibrate in materials with smaller PLD, likely due to larger diffusive barriers. Similarly, ε1τ also increases with smaller PLD. Sinceε1τreflects the quality of the exponential fit of the accumulated charge (higherε1τindicates worsefit), the data show that the exponential fit at early times is more severely underestimated when PLD decreases. This under-estimation of the initial charging profile by the exponential fit suggests the existence of multiple time scales in EDLC charging, due to both progressive charging of the electrodes from the bulk electrolyte inward (consistent with a trans-mission line model), as well as“overfilling” and ion trapping analogous to that observed by Kondrat et al.17,42 Both phenomena, as well as further details regarding equilibrium
convergence, are discussed further in the Supporting Information.
Capacitance Screening. The capacitance under a constant applied potential is plotted against various geometric descriptors (top row) and average local interfacial properties (bottom row) in Figure 3. While it would be interesting to compare the values obtained in this work with previous results obtained for disordered porous structures, we limit ourselves to the systems simulated here since the design of the model supercapacitors and the equilibration process seem to affect the simulated capacitances. Indeed, previous simulations done with constant charge or constant potential equilibrations and with slightly different starting densities have shown a difference of 36% between calculated capacitances.14,38Geometric descrip-tors, in particular, average pore size and pore size distributions, are often used to rationalize structure−capacitance relation-ships in EDLCs.43,44For example, In Käärik et al., the authors trained a regression model to link capacitance to three experimental descriptors: surface area, pore size fraction, and density. While they showed overall statistical agreement of their model with most of the 100 amorphous carbons they studied, their regression model has the highest relative error (roughly 20%) for the highest-capacitance materials, suggesting that these geometric descriptors lack a fundamental correlation to the anomalous increases in capacitance achievable with subnanometer pores.45 Other theoretical studies on slit nanopores even suggest that the capacitance could follow an oscillatory behavior with the average pore size for carbons with well-defined pore sizes.46−48However, in our materials we do not see a definite correlation with any of the geometric descriptors alone. Indeed, for all purely geometric descriptors the Pearson correlation coefficient (Pearson’s r) with gravimetric capacitance is less than 0.5 (Table 1).
This suggests that while particular geometric descriptors might be a useful indicator of capacitance within particular families of materials, a clear relationship between capacitance and, for example, pore size is not the rule, but rather the exception for materials that are otherwise geometrically similar. ZTCs, due to their regular templated structures, exhibit a diversity of topologies, pore geometries, and local curvatures,
Figure 2.Characteristic time scaleτ of EDLCs during charging at ΔΨ = 1 V, colored with the normalizedε1τof the exponentialfit during
thefirst characteristic time scale.
Figure 3.Gravimetric capacitance as a function of geometric descriptors in the top row: density, void fraction, average pore size, and PLD; and local properties in the bottom row: average distance between counterions and electrode (⟨d̅sep⟩), the surface area to charge separation ratio (A/
⟨d̅sep⟩), the average degree of confinement (⟨DoC⟩), and the average charge compensation per carbon (⟨CCpC⟩). The inset plots the gravimetric
capacitance against total charge compensation in the coordination shell, where the x-axis range goes from 0.15 e to 0.23 e.
ACS Central Science
DOI:10.1021/acscentsci.9b00800
ACS Cent. Sci. XXXX, XXX, XXX−XXX
which are not well captured by traditional geometric descriptors, but are known to influence charge storage.15 Thus, the insights we can glean from local interfacial properties in ZTCs might be better translated to microporous carbon materials in general.
The bottom row of Figure 3 plots capacitance versus quantities related to the electrolyte−electrode interfacial configuration, which are computed for an ion in relation to the electrode atoms within its coordination shell. The charge separation (⟨d̅sep⟩) is the average distance between the
counterion and the carbons within its coordination shell. The degree of confinement (DoC) is defined as the fraction of the maximum solid angle around a counterion that is occupied by carbon atoms within the coordination shell cutoff (set to the first minimum in the ion-carbon radial distribution function).15Andfinally, the charge compensation per carbon (CCpC), a quantity introduced in this work, is defined as the magnitude of the net charge of the coordination shell divided by the number of atoms within the coordination cutoff. Since the coordination shell represents the “sphere of influence” of an ion, a high CCpC indicates that a relatively large amount of the ionic charge is being compensated by a relatively small number of electrode atoms. For all quantities, the angle brackets ⟨⟩ denote averaging over all counterions in an electrode.
A positive correlation can be observed between the capacitance and A/⟨d̅sep⟩ (r = 0.751), reminiscent of classical theories of capacitance as expressed byeq 2. This suggests that we can view capacitance in the ZTCs as arising from an“ideal” contribution from a reference electrode with the same A/ ⟨d̅sep⟩, and a “non-ideal” contribution responsible for the
deviations from classical double layer theory, arising from the microporosity. One measure of how micropores influence charge storage is the DoC. Here, we note that we are plotting inFigure 3the average degree of confinement, ⟨DoC⟩, which obscures differences in the range and distribution of confine-ment values within a material. We do not observe a strong correlation with capacitance when ⟨DoC⟩ is below 0.25, and when⟨DoC⟩ is above 0.25 the capacitance seems to be slightly negatively correlated with confinement. This finding adds nuance to the conclusions from previous studies that more confinement generally has a positive influence on charge storage efficiency, i.e., that ions in highly confined sites generate a higher counter-charge on the electrode.15,18 We discuss confinement effects further in a later section, where we examine charge storage mechanisms in individual pores.
Finally, the local descriptor that appears to have the best correlation with capacitance is⟨CCpC⟩, for which we observe a positive and nearly linear relationship (r = 0.934) with even less scatter than for A/⟨d̅sep⟩. Capacitance and ⟨CCpC⟩ both
aggregate information about the charge stored by the electrode atoms; however, their strong correlation is not trivial because only about 30−45% of the electrode atoms are within the coordination shell of a counterion at a given time step. These coordination shell carbons have a slightly larger-than-propor-tional share of charge, carrying between 35% and 50% of the net charge in the electrode (SI Figure S13). Perhaps surprisingly, the capacitance does not correlate with the total charge compensation within the coordination shell (inset of Figure 3). The observation that per-carbon (rather than total) charge compensation correlates so strongly with the capacitance indicates that electrodes store charge most efficiently when the local environment of an ion can compensate a large fraction of its charge while using relatively little electrode“real estate”.
One complication with comparing materials using local properties is that they are computed with a definition of the coordination shell that uses a cutoff radius, rcutaround the ion. rcut radius was chosen following the literature15 as the first
minimum in the ion-carbon RDF. However, we found in our materials that thefirst minima were not all at the same location in all materials, and some of them did not have a clear “minimum” at all. Therefore, we opted to use the same rcutof
6.3 Å for all materials, as this was the location of most of the RDFfirst minima and also was consistent with the literature. Further work is needed to determine how to better define a coordination shell and compute local interfacial properties. However, since we were able to observe quite a strong correlation of capacitance with ⟨CCpC⟩ with the existing coordination shell definition, we leave this complication for a future study.
Having investigated geometric descriptors and local interfacial properties of EDLCs, averaged over the entire electrode, wefind that almost all of them other than ⟨CCpC⟩ lack a clear correlation with capacitance or, in the case of A/ ⟨d̅sep⟩, are correlated but exhibit significant scatter. In the
following sections we turn our attention to the relationship between pore geometry, local electrolyte properties, and charge storage within individual pores of selected materials. We then move toward a more general framework for rationalizing differences in capacitance among ZTC materials. Due to the structural diversity of the ZTC frameworks, we believe insights drawn from ZTCs are also relevant general design rules for porous carbon EDLC electrodes.
Charge Storage Mechanism in Selected Materials. We begin our examination of individual materials by considering BEA and BEA_beta, which are templated on different polymorphs of the same zeolite (known as zeolite beta) as shown inFigure 4a.49Naturally occurring zeolite beta consists of a mixture of polymorphs A and B, both of which contain layers of the same tertiary building unit which are rotated by 90° with respect to each other. In polymorph A (correspond-ing to BEA_beta ZTC), the layers are stacked in a chiral fashion, while in polymorph B (corresponding to BEA ZTC), the rotation of the layers alternates. As a result, the pore size distributions of BEA and BEA_beta differ, with slightly larger pore sizes for BEA_beta as shown inFigure 4b.
The capacitances of these ZTCs differ widely, with 34.0 F g−1(45.8 F g−1) gravimetric and 2.33μF cm−2(2.65μF cm−2) Table 1. Pearson Correlation Coefficients Computed
between Gravimetric Capacitance and Descriptors Shown in Figure 3 descriptor Pearson’s r Geometric Properties density −0.385 void fraction 0.461 dpore −0.005 PLD 0.039
Local Interfacial Properties
⟨d̅sep⟩ −0.206
A/⟨d̅sep⟩ 0.751
⟨DoC⟩ −0.387 ⟨CCpC⟩ 0.934 total charge compensation 0.252
ACS Central Science
DOI:10.1021/acscentsci.9b00800
ACS Cent. Sci. XXXX, XXX, XXX−XXX
areal capacitances computed for BEA (BEA_beta). The ions within the pores also have different degrees of confinement, possibly arising from the slight differences in the most probable pore sizes. As seen in Figure 4c, the anions in the anode of BEA_beta have a single peak in their DoC histogram around 0.33, while the anions in the BEA have on average higher DoCs, with one peak at 0.35 and another at 0.42. We might suppose from this that BEA should have the higher charge storage efficiency, since Merlet et al. showed that highly confined ions are able to store more charge in super-capacitors;15 however, in this case the opposite is true: ⟨CCpC⟩DoC is higher in BEA_beta than in BEA for all DoC
values (Figure 4d). In the cathode, as well, the average charge compensation is lower for BEA than for BEA_beta (SI Figure S14).
One noteworthy feature in the charge compensation distribution of the BEA anode is a minimum in⟨CCpC⟩DoC
at 0.43 DoC (Figure 4d), the location of the higher peak in the DoC histogram. This drop is significant as it does not appear in BEA_beta, showing that sites with the same DoC can have drastically different contributions to capacitance. The source of this low-CCpC region becomes clear when examining representative configurations of the most highly confined anions of BEA and BEA_beta inFigure 5. In BEA, the anion is located in a cylindrical, nanotube-like structure, with a coordination shell of electrode atoms encircling the anion on all sides, while the anion in BEA_beta is only confined on two out of four sides by the electrode. The cylindrical pore of BEA is too small tofit another anion or even solvent molecule, but
Figure 4. (a) BEA and BEA_beta ZTC unit cells. (b) pore size distributions. (c) scatterplot showing joint distribution of CCpC and DoC for counterion adsorption sites, with probability distributions on the corresponding axes. (d) conditional expectation of CCpC for a given DoC, denoted⟨CCpC⟩DoC.
Figure 5.Snapshots of the coordination shells of highly coordinated anions in the positive electrodes of (a) BEA and (b) BEA_beta. Carbon atoms are colored according to their charge, with blue indicating negative and red indicating positive charge, scaled from−0.01 e to 0.01 e. The green color corresponds to the anions, BF4−, and the orange color to the cations, BMI+; the transparent linear molecules are the solvent.
ACS Central Science
DOI:10.1021/acscentsci.9b00800
ACS Cent. Sci. XXXX, XXX, XXX−XXX
too large to snuglyfit BF4−, causing it to be stuck in the middle of the pore where it is not close enough to induce a strong compensating charge on any of the atoms within its coordination shell. As a result, the coordination shell atoms in BEA have a total charge of −0.0263 e, while the coordination shell in BEA_beta has a total charge of 0.223 e. This effect has also been observed in the literature; for example, Kondrat et al. showed a local minimum in capacitance when the pore-to-ion-diameter ratio L/d was around 1.5, and increased capacitance when L/d was near 1 and 2.13
The charge storage efficiency also depends on the ion size in relation to the pore size: In the electrolyte studied here, the cation is larger than the anion and its charge is distributed on three sites. As such, when a cation is at the center of the nanotube-like pore, the partial charges of its coarse-grained sites are able to approach more closely to the electrode surface, making the equivalent pore in the cathode more efficient at storing charge. This explains why there is no drop in ⟨CCpC⟩DoC in the BEA cathode (SI Figure S14). These
observations highlight one important role of pore geometry in determining charge storage efficiency, by influencing local ion density and electrolyte coordination environment.
We next examine another pair of ZTCs, BEC, and ISV, to test our hypothesis that differences in microporosity leads to deviations from the classical capacitance relation, eq 2. We chose these two structures because they have virtually the same A/⟨d̅sep⟩ (3.5 × 10¹²mg−1), but different capacitances of 50 F
g−1and 43 F g−1for BEC and ISV, respectively, putting them at high and low ends of the capacitance range for the given A/ ⟨d̅sep⟩ value, as seen in the plot of Csim − Cfit in (Figure 6).
Analyzing these structures in a similar fashion as for the BEA polymorphs, wefind that BEC has more highly confined sites than ISV and a higher⟨CCpC⟩DoCfor all values of DoC (SI Figure S15).
We visualize inFigure 7the instantaneous CCpC and d̅sepof each counterion at snapshots taken every 0.5 ps during the production run, along with probability distributions for CCpC and d̅sepalong the corresponding axes. The joint distributions
for the two materials are largely overlapping, but the adsorption sites in BEC have their highest probability density at slightly lower d̅sep than the sites in ISV, corresponding to more efficient charge storage (as seen by the higher CCpC distribution) and higher overall capacitance of BEC.
By examining individual pairs of structures, and comparing properties of the individual pores inside those structures, we start to obtain insights into how charge storage mechanisms
are related to pore geometries. We generalize this approach in the following section, looking at many structures to extract structure−property trends.
Effect of Pore Geometry on Charge Storage
Efficiency. We show in Figure 8 the structures of the materials with highest and lowest Csim − Cfit, indicating the average charge of each crystallographically unique electrode carbon atom during the equilibrated constant potential run, along with the probability density isosurfaces of counterion locations within the electrodes. Isosurfaces for adsorption sites with more than 0.1 e total charge compensation are shown in purple, while sites with less than 0.1 e charge compensation are shown in green. This allows us to visually associate geometry with average contribution to capacitance for an individual pore and see that the adsorption site isosurfaces that have more than 0.1 e coordination-shell charge compensation are close to the surface of the frameworks, while the isosurfaces associated with less than 0.1 e charge compensation tend to be in the middle of the pores.
Inspecting the average atomic charges of BEC and h91 visually (Figure 8a and b) as well as quantitatively (Figure 8f), wefind that these two materials have more individual carbon atoms with high charge, corresponding to high CCpC. As seen inFigure 6, BEC and h91 are also the two materials with the highest enhancement in capacitance compared to materials of similar A/⟨d̅sep⟩. Comparing these two frameworks also illustrates the diversity of factors contributing to overall capacitance: h91 appears to have more atoms with a low average charge than BEC, but fromTable 2one can also see that h91 has a larger fraction of atoms with an average charge of greater than 0.008 e, and from the charge distribution in Figure 8f, it is apparent that h91 even has a peak in the charge distribution around 0.017 e, whereas BEC has no atoms with such a high average charge.
In contrast, h18, h49, and ISV, which have A/⟨d̅sep⟩ similar
or greater than that of BEC, but lower capacitance, have fewer highly charged atoms (Figure 8c−f). Figure 8f and Table 2 provide further quantitative evidence of the correlation between the probability of highly charged atoms and Csim −
Cfit: structures with a higher probability density of average atomic charge magnitude around 0.1 e or higher tend to have a higher Csim − Cfit.
In order to rationalize the differences in charge storage between these materials, we focus on the local radius of curvature of the materials, as this roughly determines the
Figure 6.Deviation of gravimetric capacitance from the linear least-squaresfit of capacitance vs A/⟨d̅sep⟩. Structures mentioned in the text
are labeled. The inset shows the simulated gravimetric capacitance with thefitted line and the color bar indicates the pore diameter.
Figure 7.Scatterplot of CCpC and d̅sepof each counterion adsorption
site during production run, with probability distributions, for BEC and ISV.
ACS Central Science
DOI:10.1021/acscentsci.9b00800
ACS Cent. Sci. XXXX, XXX, XXX−XXX
distribution of ion−electrode distances at a particular adsorption site. In BEC, which has square-shaped windows with right-angle“corners”, we see electrode atoms with large average partial charges at two locations for each adsorption isosurface, corresponding to the positions at which an adsorbed ion can be in close proximity with two “walls” of the framework simultaneously. In h91, cylindrical pores adjoining with rounded beams create small radius of curvature sites where ions can again approach the electrode surface closely at multiple sites, leading to more electrode atoms with large partial charges.
In contrast, adsorption sites that are near large radius of curvature sites, such as in h18, h49, and ISV (Figure 8c, d, and
Figure 8.Average electrode atom charges and isosurfaces of ion probability density, computed for anions within the anode (a−e), probability density of average charges in the anode of materials discussed in the text, colored by deviation of gravimetric capacitance from the linearfit (f). Electrode atoms are colored on a scale from 0 (white) to 0.01 e (red). Purple isosurfaces indicate total charge compensation within the coordination shell cutoff radius greater than 0.1 e, while green isosurfaces indicate total charge compensation less than 0.1 e.
Table 2. Fraction of Atoms with Large Positive or Negative Average Charge in Selected ZTCs
percentage (%) of atoms with average charge material >0.008 in anode <−0.008 e in cathode
h91 12 18 BEC 12 6.5 BEA_beta 15 14 ISV 3.5 5.0 h49 3.5 4.0 h18 3.5 4.0 BEA 0.5 5.5
ACS Central Science
DOI:10.1021/acscentsci.9b00800
ACS Cent. Sci. XXXX, XXX, XXX−XXX
e), tend to be associated with materials with lower capacitances relative to their respective A/⟨d̅sep⟩. In adsorption sites with a
large radius of curvature, an ion is not able to induce as many favorable Coulombic interactions with the electrode surface, leading to lower charge compensation for ions within those materials. ISV merits particular mention, as it does contain some adsorption sites with low radius of curvature and high charge compensation (dashed circles in Figure 8e), but also has high radius of curvature/low charge compensation sites (solid circles); ISV still has a relatively low capacitance considering its high A/⟨d̅sep⟩ (Figure 6).
Overall, our results demonstrate that pore geometries that are capacitance-enhancing tend to facilitate the close approach of counterions to multiple carbons within the electrode via low radius of curvature adsorption sites, so that the compensating charge from the electrodes can be localized and large in magnitude to most efficiently screen countercharges and allow for higher counterion loading (and thus a large magnitude of charge storage) in the pores. Conversely, capacitance-diminishing properties include pores with high radius of curvature and cylindrical and ill-fitting pores (whose diameters are not commensurate with the ion diameters), as these types of sites have inefficient charge storage and therefore decrease the overall capacitance of the material.
■
CONCLUSIONSIn summary, we investigated both the charging dynamics and equilibrium capacitance in zeolite-templated carbon electrodes. We found that the equilibration time at constant potential varied depending on the material, from as little as 3 ns to over 10 ns, increasing as the pore size decreased. This indicated that the limiting process in EDLC charge convergence is solvent diffusion and reorganization, which becomes slower as the PLD decreases. We also found evidence of ion trapping and progressive charging of the electrode, which leads to an underestimation of the initial charging profile by a single-exponentialfit.
We observed that the equilibrium capacitance of the ZTCs was not correlated with geometric pore descriptors such as PLD, and only weakly correlated with most“globally” averaged local properties such as ⟨DoC⟩. Instead, we found that capacitance was correlated strongly with⟨CCpC⟩, a measure of how much of the ionic charge is compensated per electrode atom in the coordination shell. Turning our focus next to microscopic properties, we identified subtle geometric differ-ences between otherwise similar ZTC structures that give rise to large differences in capacitance. By comparing probability distributions for charge compensation, degree of confinement, and charge separation distances, we determined specific pore geometries that corresponded to enhanced or diminished charge storage efficiency. For example, we illustrate how a pore with a diameter that is not commensurate with the ion size barely compensates the ionic charge at all, while a slightly smaller pore in a similar material responds to a local ion with a strong compensating charge. Finally, by leveraging local CCpC to characterize ion adsorption sites within the electrode, and analyzing the average charge distribution around low- and high-charge-compensation sites, we observed that the capacitance is higher in materials that have pockets with sharp angles or a low radius of curvature, compared to pockets with rounded corners or a larger radius of curvature. Low radius of curvature pockets allow ions to approach close to the
pore at multiple points, inducing strong opposing charges in the electrode which efficiently screen the ion charge.
Our work contributes clear molecular insights into the effect of local pore geometry on the charge storage mechanisms within EDLCs. The efficient charge storage of “pockets” versus “hollow” or “surface” adsorption sites has been previously reported, but our work shows that not all pockets are equivalent; those with diameters that match the ion size, or with sharper corners, are able to compensate substantially more of an adsorbed ion’s charge. The relevance of our results rests on the well-defined and yet diverse pore shapes within the ZTC materials that we study, which allow us to reach conclusions that are not dependent on synthesis conditions or other material-specific factors in amorphous carbons. One promising experimental application of our conclusions is in salt-soft templating,50where commensurate ion pore diameters can be engineered by templating a porous carbon with the same salt used in the electrolyte. Our work also signals the potential for improvement in the computational study of EDLC electrodes, in order to develop more sophisticated methods for geometric characterization of pore shapes so that potential electrode materials may be screened with less computational expense, enabling high-throughput screening. Some options for geometric analysis include using Voronoi tessellation or mesh-based approaches to characterize pore curvature, or applying a method such as the Smooth Overlap of Atomic Positions (SOAP),51 a descriptor of local atomic geometry. Further research into more efficient molecular simulation protocols would also be interesting, either to shorten the equilibration time needed or to determine whether a descriptor such as the CCpC calculated at a constant zero potential is relevant to capacitance at a nonzero potential. These experimental and computational research directions can build upon the insights we present in this work, to advance our fundamental understanding of and design capabilities for improved supercapacitors.
■
METHODSModel and Force Field. In our simulations we used an organic electrolyte composed of a mixture of 1-butyl-3-methylimidazolium tetrafluoroborate ([BMI+][BF4−]) and
acetonitrile (ACN) with the concentration of ions equal to 1 M. We modeled the organic electrolyte using a coarse-grained description consisting of a three-site model for BMI+ and ACN, and a single-site model for BF4−, as shown inSI Figure S1. Nonbonded interactions were described by a pairwise Lennard-Jones potential with Lorentz−Berthelot mixing rules, and electrostatic interactions by a Coulombic potential. Long-range electrostatic interactions were computed using the Ewald summation for systems with slab geometry.52
For the nonbonded parameters of BMI+ we used those
developed by Roy and Maroncelli.53 The nonbonded parameters for BF4− and ACN were taken from Merlet et
al.14and from Edwards et al.,54respectively. Bonds and angles of BMI+, and bonds of ACN, were kept rigid using the SHAKE
algorithm.55,56 For the angles of ACN we used a harmonic potential with a stiff spring constant of 400 kcal2rad−1mol−1to
keep the molecule close to linear. The carbon atoms of the electrodes were modeled as rigid. During the constant applied potential simulations, the charges of the electrode atoms were computed at each time step according to the constant-potential method.57,58 All force field parameters and further details
ACS Central Science
DOI:10.1021/acscentsci.9b00800
ACS Cent. Sci. XXXX, XXX, XXX−XXX
regarding the constant-potential method are provided in the Supporting Information.
ZTC materials were synthesized in silico as described in Braun et al.36Carbide-derived carbon (CDC) materials, which are studied in depth computationally by Merlet and co-workers,14,59 are used here as a reference material. CDC structures were taken from Palmer et al.,60who generated them using Quench Molecular Dynamics. In this work, we consider 27 ZTC and 2 CDC materials for the constant-charge simulations and a subset of 19 of the ZTCs for constant-potential simulations (CDCs were not simulated at constant potential due to computational expense arising from their large unit cell sizes). CDCs are named as in the original article by Palmer et al. ZTCs are referred to using the name of the templating zeolite. We indicate hypothetical zeolites using the prefix “h” and the last 2 digits of their 7-digit identifier (e.g., h37 for h8326837). Complete names for all the zeolites referenced in the text can be found in the Supporting Information, along with information on framework properties (pore size, void fraction, accessible surface area).
We used a semiautomated protocol to build two-electrode EDLC cells using the Zeo++ software suite61 and the VMD script interface with the TopoTools package.62,63 Further details are provided in the Supporting Information. This protocol was designed tofill the EDLC cell with an amount of electrolyte such that when the capacitor is equilibrated at either constant charge or constant voltage, the electrolyte density and composition in the bulk region matches the experimental values. An example of the simulation setup for FAU_1 ZTC is provided inFigure 9.
Molecular Dynamics Simulations. MD simulations were done using the LAMMPS simulation package64with Velocity-Verlet time integration using a time step of 1 fs, and a Nosé− Hoover thermostat65to maintain a temperature of 300 K. The initial EDLC cell was equilibrated with a constant charge of 0 e on each carbon atom for 4 ns. Final configurations from the zero-charge simulations were used to initialize all further simulation steps.
Molecular simulation is a powerful tool to study EDLCs, as it allows for precise determination of the microscopic properties, such as the structure of the electrolyte within the pores, which can be difficult to access experimentally but which play an important role in determining the capacitance of the
material.13,14At the same time, simulation of EDLCs presents technical challenges due to long equilibration times38and the need to compute the fluctuating charges in the electrode in response to a constant applied potential. The constant potential approach is more accurate but also much more computationally expensive than simulating an EDLC with constant charges on the electrode atoms.66,67
We tested multiple protocols for equilibrating the simulation cells, one with a constant-charge equilibration followed by a short constant-potential equilibration step,14 and the other with a long potential equilibration. In the constant-charge equilibration method, partial constant-charges of±0.01 e were applied to all the electrode atoms, positive charges for anode atoms, and negative charges for cathode atoms. The EDLC cell was equilibrated with these fixed charges for 8 ns. Then, the effective potential across the cell was calculated using either the 1-D Poisson equation or the averaged local potentials at each electrode atom, and this potential was applied for the constant-potential equilibration and production runs.
In the constant-potential equilibration, a constant potential difference of 1 V was applied across the EDLC cell (±0.5 V for each electrode), and the constant potential simulation was run for at least 10 ns. During the constant-potential run, the average absolute charge on the electrodes was monitored and fit to an exponential. The equilibration step was considered completed when the simulation was at least as long as 5τ, where τ is the time constant of the exponential. This equilibration process was found to be the best following a number of tests which are described in the Supporting Information section, “Development of Computational Proto-col”.
Production runs for simulation of capacitance were carried out after equilibration at constant potential. The length of production runs was at least 2 ns. Capacitance was computed usingeq 1, where V =ΔΨ is the voltage drop applied across the cell, and Q is the average absolute value of the charge stored on a single electrode. From the production run we also computed local properties of interest using an in-house software package developed for this study,68 such as the degree of confinement (DoC)15and the charge compensation per carbon (CCpC), in order to understand the mechanisms of charge storage and gain physical insights into differences in capacitances between the materials. The definitions of these
Figure 9.Example of simulation setup for FAU_1, with box lengths a = 34.4 Å, b = 30.7 Å, and c = 194.2 Å. BMI+ions are in red, BF
4−ions in blue,
and ACN molecules in tan and translucent. The ZTC electrode and graphene caps are in gray. The length of the electrodes in the z direction is 43.4 Å and they are separated by 106.6 Å. Graphene sheets cap the electrodes on both sides of the capacitor cell. The electrolyte consists of 144 [BMI+][BF
4−] ion pairs and 1344 ACN molecules. In total, the system contains 9072 atoms.
ACS Central Science
DOI:10.1021/acscentsci.9b00800
ACS Cent. Sci. XXXX, XXX, XXX−XXX
local properties, as well as further details regarding the probability density isosurfaces for charge-compensated ion adsorption sites, are provided in theSupporting Information.
■
ASSOCIATED CONTENT*
S Supporting InformationThe Supporting Information is available free of charge on the
ACS Publications website at DOI:
10.1021/acscents-ci.9b00800.
Model and forcefield parameters, ZTC structures and pore properties, EDLC simulation cells, equilibration and simulation protocol, computation of local interfacial properties, charging dynamics, additional charge storage and interfacial properties data (PDF)
■
AUTHOR INFORMATIONCorresponding Author
*E-mail:berend.smit@epfl.ch.
ORCID
Yifei Michelle Liu: 0000-0002-4705-6664 Céline Merlet:0000-0003-3758-273X Berend Smit:0000-0003-4653-8562
Notes
The authors declare no competingfinancial interest.
■
ACKNOWLEDGMENTSThis research used resources of the National Energy Research Scientific Computing Center, a DOE Office of Science User Facility supported by the Office of Science of the U.S. Department of Energy under Contract No DE-AC02-05CH11231. The authors gratefully acknowledge the Gauss Centre for Supercomputing e.V. for funding this project by providing computing time on the GCS Supercomputer SuperMUC at Leibniz Supercomputing Centre. This project has received funding from the European Research Council (ERC) under the European Union’s Horizon 2020 research and innovation programme (grant agreement no. 714581). Y.M.L. acknowledges support from an NSF Graduate Research Fellowship.
■
REFERENCES(1) Ragone, D. V. Review of Battery Systems for Electrically Powered Vehicles. SAE Tech. Pap. Ser. 1968, 1.
(2) Christen, T.; Carlen, M. W. Theory of Ragone plots. J. Power Sources 2000, 91, 210−216.
(3) Conway, B. E. Electrochemical Supercapacitors. Scientific Fundamentals and Technological Applications; Springer Science Media; Springer US: Boston, MA, 2013; .
(4) General Description of Aluminum Electrolytic Capacitors; Technical Notes Cat. 8101E, Nichicon Corp; pp 1−27.
(5) Helmholtz, H. Ueber einige Gesetze der Vertheilung elektrischer Ströme in körperlichen Leitern mit Anwendung auf die thierisch-elektrischen Versuche. Ann. Phys. 1853, 165, 211−233.
(6) Helmholtz, H. Studien über electrische Grenzschichten. Ann. Phys. 1879, 243, 337−382.
(7) Gouy, M. Sur la constitution de la charge électrique à la surface d’un électrolyte. J. Phys. Theor. Appl. 1910, 9, 457−468.
(8) Chapman, D. L. LI. A contribution to the theory of electrocapillarity. London, Edinburgh, Dublin Philos. Mag. J. Sci. 1913, 25, 475−481.
(9) Stern, O. Zur theorie der elektrolytischen doppelschicht. Zeitschrift für Elektrochemie Angew. Phys. Chemie 1924, 1.
(10) Chmiola, J. Anomalous Increase in Carbon Capacitance at Pore Sizes Less Than 1 Nanometer. Science 2006, 313, 1760−1763.
(11) Raymundo-Piñero, E.; Kierzek, K.; Machnikowski, J.; Béguin, F. Relationship between the nanoporous texture of activated carbons and their capacitance properties in different electrolytes. Carbon 2006, 44, 2498−2507.
(12) Huang, J.; Sumpter, B. G.; Meunier, V. A Universal Model for Nanoporous Carbon Supercapacitors Applicable to Diverse Pore Regimes, Carbon Materials, and Electrolytes. Chem. - Eur. J. 2008, 14, 6614−6626.
(13) Kondrat, S.; Georgi, N.; Fedorov, M. V.; Kornyshev, A. A. A superionic state in nanoporous double-layer capacitors: insights from Monte Carlo simulations. Phys. Chem. Chem. Phys. 2011, 13, 11359− 11366.
(14) Merlet, C.; Rotenberg, B.; Madden, P. A.; Taberna, P.-L.; Simon, P.; Gogotsi, Y.; Salanne, M. On the molecular origin of supercapacitance in nanoporous carbon electrodes. Nat. Mater. 2012, 11, 306−310.
(15) Merlet, C.; Péan, C.; Rotenberg, B.; Madden, P. A.; Daffos, B.; Taberna, P.-L.; Simon, P.; Salanne, M. Highly confined ions store charge more efficiently in supercapacitors. Nat. Commun. 2013, 4, 2701.
(16) Feng, G.; Li, S.; Presser, V.; Cummings, P. T. Molecular Insights into Carbon Supercapacitors Based on Room-Temperature Ionic Liquids. J. Phys. Chem. Lett. 2013, 4, 3367−3376.
(17) Kondrat, S.; Wu, P.; Qiao, R.; Kornyshev, A. A. Accelerating charging dynamics in subnanometre pores. Nat. Mater. 2014, 13, 387−393.
(18) Prehal, C.; Koczwara, C.; Jäckel, N.; Schreiber, A.; Burian, M.; Amenitsch, H.; Hartmann, M. A.; Presser, V.; Paris, O. Quantification of ion confinement and desolvation in nanoporous carbon super-capacitors with modelling and in situ X-ray scattering. Nat. Energy 2017, 2, 16215.
(19) Gogotsi, Y.; Nikitin, A.; Ye, H.; Zhou, W.; Fischer, J. E.; Yi, B.; Foley, H. C.; Barsoum, M. W. Nanoporous carbide-derived carbon with tunable pore size. Nat. Mater. 2003, 2, 591−594.
(20) Pech, D.; Brunet, M.; Durou, H.; Huang, P.; Mochalin, V.; Gogotsi, Y.; Taberna, P. L.; Simon, P. Ultrahigh-power micrometre-sized supercapacitors based on onion-like carbon. Nat. Nanotechnol. 2010, 5, 651−654.
(21) Salunkhe, R. R.; Kaneti, Y. V.; Kim, J.; Kim, J. H.; Yamauchi, Y. Nanoarchitectures for Metal-Organic Framework-Derived Nano-porous Carbons toward Supercapacitor Applications. Acc. Chem. Res. 2016, 49, 2796−2806.
(22) Noked, M.; Okashy, S.; Zimrin, T.; Aurbach, D. Composite Carbon Nanotube/Carbon Electrodes for Electrical Double-Layer Super Capacitors. Angew. Chem., Int. Ed. 2012, 51, 1568−1571.
(23) Salunkhe, R. R.; Lee, Y.-H.; Chang, K.-H.; Li, J.-M.; Simon, P.; Tang, J.; Torad, N. L.; Hu, C.-C.; Yamauchi, Y. Nanoarchitectured Graphene-Based Supercapacitors for Next Generation Energy-Storage Applications. Chem. - Eur. J. 2014, 20, 13838−13852.
(24) Salanne, M.; Rotenberg, B.; Naoi, K.; Kaneko, K.; Taberna, P.-L.; Grey, C. P.; Dunn, B.; Simon, P. Efficient storage mechanisms for building better supercapacitors. Nat. Energy 2016, 1, 16070.
(25) Forse, A. C.; Merlet, C.; Griffin, J. M.; Grey, C. P. New perspectives on the charging mechanisms of supercapacitors. J. Am. Chem. Soc. 2016, 138, 5731−5744.
(26) Nishihara, H.; Kyotani, T. Zeolite-templated carbon−its unique characteristics and applications. In Novel Carbon Adsorbents; Tascón, J. M. D. Elsevier, 2012; pp 295−322.
(27) Nishihara, H.; Kyotani, T. Templated Nanocarbons for Energy Storage. Adv. Mater. 2012, 24, 4473−4498.
(28) Nishihara, H.; Kyotani, T. Zeolite-templated carbons− three-dimensional microporous graphene frameworks. Chem. Commun. 2018, 54, 5648−5673.
(29) Nishihara, H.; Itoi, H.; Kogure, T.; Hou, P.-X.; Touhara, H.; Okino, F.; Kyotani, T. Investigation of the Ion Storage/Transfer Behavior in an Electrical Double-Layer Capacitor by Using Ordered
ACS Central Science
DOI:10.1021/acscentsci.9b00800
ACS Cent. Sci. XXXX, XXX, XXX−XXX
Microporous Carbons as Model Materials. Chem. - Eur. J. 2009, 15, 5355−5363.
(30) Itoi, H.; Nishihara, H.; Kogure, T.; Kyotani, T. Three-dimensionally arrayed and mutually connected 1.2-nm nanopores for high-performance electric double layer capacitor. J. Am. Chem. Soc. 2011, 133, 1165−1167.
(31) Moon, J. S.; Kim, H.; Lee, D.-C.; Lee, J. T.; Yushin, G. Increasing Capacitance of Zeolite-Templated Carbons in Electric Double Layer Capacitors. J. Electrochem. Soc. 2015, 162, A5070− A5076.
(32) Mostazo-López, M. J.; Ruiz-Rosas, R.; Castro-Muñiz, A.; Nishihara, H.; Kyotani, T.; Morallón, E.; Cazorla-Amorós, D. Ultraporousnitrogen-dopedzeolite-templatedcarbon for high power density aqueous-based supercapacitors. Carbon 2018, 129, 510−519. (33) Kim, K.; Lee, T.; Kwon, Y.; Seo, Y.; Song, J.; Park, J. K.; Lee, H.; Park, J. Y.; Ihee, H.; Cho, S. J.; Ryoo, R. Lanthanum-catalysed synthesis of microporous 3D graphene-like carbons in a zeolite template. Nature 2016, 535, 131−135.
(34) Gaslain, F. O. M.; Parmentier, J.; Valtchev, V. P.; Patarin, J. First zeolite carbon replica with a well resolved X-ray diffraction pattern. Chem. Commun. 2006, 991.
(35) Baerlocher, C.; McCusker, L. B. Database of Zeolite Structures, 2007;http://www.iza-structure.org/databases/, Accessed October 6, 2019.
(36) Braun, E.; Lee, Y.; Moosavi, S. M.; Barthel, S.; Mercado, R.; Baburin, I. A.; Proserpio, D. M.; Smit, B. Generating carbon schwarzites via zeolite-templating. Proc. Natl. Acad. Sci. U. S. A. 2018, 115, E8116.
(37) Conway, B.; Birss, V.; Wojtowicz, J. The role and utilization of pseudocapacitance for energy storage by supercapacitors. J. Power Sources 1997, 66, 1−14.
(38) Péan, C.; Merlet, C.; Rotenberg, B.; Madden, P. A.; Taberna, P.-L.; Daffos, B.; Salanne, M.; Simon, P. On the dynamics of charging in nanoporous carbon-based supercapacitors. ACS Nano 2014, 8, 1576−1583.
(39) Bi, S.; Chen, M.; Wang, R.; Feng, J.; Dinca, M.; Kornyshev, A. A.; Feng, G. Molecular understanding of charge storage and charging dynamics in supercapacitors with MOF electrodes and ionic liquid electrolytes. arXiv [cond-mat.mtrl-sci] 2019, 1−19.
(40) Serway, R. A.; Jewett, J. W. Physics for Scientists and Engineers with Modern Physics, 9th ed.; Brooks/Cole Cengage Learning: Boston, MA, 2013.
(41) Vasilyev, O. A.; Kornyshev, A. A.; Kondrat, S. Connections Matter: On the Importance of Pore Percolation for Nanoporous Supercapacitors. ACS Applied Energy Materials 2019, 2, 5386−5390. (42) Breitsprecher, K.; Holm, C.; Kondrat, S. Charge Me Slowly, I Am in a Hurry: Optimizing Charge−Discharge Cycles in Nanoporous Supercapacitors. ACS Nano 2018, 12, 9733−9741.
(43) Largeot, C.; Portet, C.; Chmiola, J.; Taberna, P.-L.; Gogotsi, Y.; Simon, P. Relation between the Ion Size and Pore Size for an Electric Double-Layer Capacitor. J. Am. Chem. Soc. 2008, 130, 2730−2731.
(44) Jäckel, N.; Rodner, M.; Schreiber, A.; Jeongwook, J.; Zeiger, M.; Aslan, M.; Weingarth, D.; Presser, V. Anomalous or regular capacitance? The influence of pore size dispersity on double-layer formation. J. Power Sources 2016, 326, 660−671.
(45) Käärik, M.; Maran, U.; Arulepp, M.; Perkson, A.; Leis, J. Quantitative Structure Property Relationships for the Nano-porous Carbon: Predicting the Performance of Energy Storage Materials. ACS Applied Energy Materials 2018, 1, 4016−4024.
(46) Jiang, D.; Jin, Z.; Wu, J. Oscillation of capacitance inside nanopores. Nano Lett. 2011, 11, 5373−5377.
(47) Wu, P.; Huang, J.; Meunier, V.; Sumpter, B. G.; Qiao, R. Complex Capacitance Scaling in Ionic Liquids-Filled Nanopores. ACS Nano 2011, 5, 9044−9051.
(48) Feng, G.; Cummings, P. T. Supercapacitor capacitance exhibits oscillatory behavior as a function of nanopore size. J. Phys. Chem. Lett. 2011, 2, 2859−2864.
(49) Newsam, J. M.; Treacy, M. M. J.; Koetsier, W. T.; Gruyter, C. B. D. Structural Characterization of Zeolite Beta. Proc. R. Soc. London, Ser. A 1988, 420, 375−405.
(50) Nita, C.; Bensafia, M.; Vaulot, C.; Delmotte, L.; Ghimbeu, C. M. Insights on the synthesis mechanism of green phenolic resin derived porous carbons via a salt-soft templating approach. Carbon 2016, 109, 227−238.
(51) Bartók, A. P.; Kondor, R.; Csányi, G. On representing chemical environments. Phys. Rev. B: Condens. Matter Mater. Phys. 2013, 87, 184115.
(52) Yeh, I.-C.; Berkowitz, M. L. Ewald summation for systems with slab geometry. J. Chem. Phys. 1999, 111, 3155.
(53) Roy, D.; Maroncelli, M. An Improved Four-Site Ionic Liquid Model. J. Phys. Chem. B 2010, 114, 12629−12631.
(54) Edwards, D. M.; Madden, P. A.; McDonald, I. R. A computer simulation study of the dielectric properties of a model of methyl cyanide. Mol. Phys. 1984, 51, 1141−1161.
(55) Ryckaert, J.-P.; Ciccotti, G.; Berendsen, H. J. Numerical integration of the cartesian equations of motion of a system with constraints: molecular dynamics of n-alkanes. J. Comput. Phys. 1977, 23, 327−341.
(56) Andersen, H. C. Rattle: A “velocity” version of the shake algorithm for molecular dynamics calculations. J. Comput. Phys. 1983, 52, 24−34.
(57) Siepmann, J. I.; Sprik, M. Influence of surface topology and electrostatic potential on water/electrode systems. J. Chem. Phys. 1995, 102, 511−524.
(58) Reed, S. K.; Lanning, O. J.; Madden, P. A. Electrochemical interface between an ionic liquid and a model metallic electrode. J. Chem. Phys. 2007, 126, No. 084704.
(59) Merlet, C.; Salanne, M.; Rotenberg, B.; Madden, P. A. Influence of solvation on the structural and capacitive properties of electrical double layer capacitors. Electrochim. Acta 2013, 101, 262−271.
(60) Palmer, J. C.; Llobet, A.; Yeon, S. H.; Fischer, J. E.; Shi, Y.; Gogotsi, Y.; Gubbins, K. E. Modeling the structural evolution of carbide-derived carbons using quenched molecular dynamics. Carbon 2010, 48, 1116−1123.
(61) Willems, T. F.; Rycroft, C. H.; Kazi, M.; Meza, J. C.; Haranczyk, M. Algorithms and tools for high-throughput geometry-based analysis of crystalline porous materials. Microporous Mesoporous Mater. 2012, 149, 134−141.
(62) Humphrey, W.; Dalke, A.; Schulten, K. VMD: Visual molecular dynamics. J. Mol. Graphics 1996, 14, 33−38.
(63) Kohlmeyer, A.; Vermaas, J. Akohlmey/topotools, Release 1.7.; 2017.
(64) Plimpton, S. Fast Parallel Algorithms for Short-Range Molecular Dynamics. J. Comput. Phys. 1995, 117, 1−19.
(65) Martyna, G. J.; Klein, M. L.; Tuckerman, M. Nosé−Hoover chains: The canonical ensemble via continuous dynamics. J. Chem. Phys. 1992, 97, 2635−2643.
(66) Merlet, C.; Péan, C.; Rotenberg, B.; Madden, P. A.; Simon, P.; Salanne, M. Simulating Supercapacitors: Can We Model Electrodes As Constant Charge Surfaces? J. Phys. Chem. Lett. 2013, 4, 264−268. (67) Wang, Z.; Yang, Y.; Olmsted, D. L.; Asta, M.; Laird, B. B. Evaluation of the constant potential method in simulating electric double-layer capacitors. J. Chem. Phys. 2014, 141, 184102.
(68) Liu, Y. M. ASTrA: Atomistic Supercapacitor Trajectory Analysis, 2019; https://zenodo.org/record/3247357, Accessed October 6, 2019.
ACS Central Science
DOI:10.1021/acscentsci.9b00800
ACS Cent. Sci. XXXX, XXX, XXX−XXX


![[PDF] Cours Principes des langage de programmation Caml | Formation informatique](data:image/gif;base64,R0lGODlhAQABAIAAAP///wAAACH5BAEAAAAALAAAAAABAAEAAAICRAEAOw==)