HAL Id: hal-01009085
https://hal.archives-ouvertes.fr/hal-01009085
Submitted on 21 Oct 2017
HAL is a multi-disciplinary open access archive for the deposit and dissemination of sci-entific research documents, whether they are pub-lished or not. The documents may come from teaching and research institutions in France or abroad, or from public or private research centers.
L’archive ouverte pluridisciplinaire HAL, est destinée au dépôt et à la diffusion de documents scientifiques de niveau recherche, publiés ou non, émanant des établissements d’enseignement et de recherche français ou étrangers, des laboratoires publics ou privés.
Uncertainty updating of on-pile wharf after monitoring
Luc Verdure, Franck Schoefs, Pascal Casari, Humberto Yáñez-Godoy
To cite this version:
Luc Verdure, Franck Schoefs, Pascal Casari, Humberto Yáñez-Godoy. Uncertainty updating of on-pile wharf after monitoring. Ninth International Conference on Structural Safety and Reliability (ICOSSAR’05) , 2005, Rome, Italy. �hal-01009085�
Uncertainty updating of a on-pile wharf after monitoring.
Luc Verdure, Franck Schoefs, Pascal Casari, Humberto Yanez-Godoy
GeM – Institut de Recherche en Génie Civil et Mécanique - UMR CNRS 6183, 2 rue de la Houssinière, BP 92208, 44322 Nantes, cedex 3, France
Keywords: on-pile wharf, monitoring, uncertainty updating, manufactory uncertainties.
ABSTRACT: Complex structures such as wharves are subjected to various building hazards which lead to non-predicted behavior. The aim of this paper is to analyze the benefit of monitoring in order to understand the in-service behavior of wharves. Some basic random variables which are here a technological play in an-choring device of rods and equivalent stiffness of soil-rod are characterized through an inverse method and by means of the use of a mechanical model. The statistical distribution properties of the parameters are deduced from Monte-Carlo simulations and a simplex algorithm minimization.
1 INTRODUCTION
Reliability of complex structures such as bridges, offshore structures and wharves require some inves-tigations for uncertainty and model calibration. Moreover, building uncertainties are high due to complexity of conditions during construction (effect of tide, duration of building...). Expert judgment or uncertainty analysis coming from other similar structures are very hard to transfer. This paper fo-cuses on this point and fofo-cuses on the interest of conducting quasi-systematic monitoring.
An instrumentation has been achieved on an on-pile wharf in order to monitor its behavior at short and long terms. A probabilistic approach of model-ing which takes the variability of mechanical load-ings, behavior and manufacturing into account is conducted. Usually, the instrumentation reports do not give priority to the use of mechanical modelling to explain the response of the structure. The focus is mostly put on the validation of a pre-existing model which has to be validated (Quirion and Ballivy 2000), on a basic health monitoring (Seim et al. 1999), or on the evaluation of monitoring devices (Maaskant et al. 1997).
Here the use of mechanical modeling is the way to identify some more features from measurements. The method is applied to the lateral behavior of the wharf as it conditiones noticeably the reliability of the wharf submitted to extreme events (storms). The second section aims to gives a global overview of monitoring strategy in the specific case of wharves. The third part is deoted to the design of the wharf and the presentation of the instrumentation. Then the fourth part explains the 3D finite element meshing to represent the mechanical behavior and the uncertain-ty and sensitiviuncertain-ty studies. The fifth part presents a simplified 2D model based on Timoshenko’s beam hypotheses and allows to perform Monte-Carlo sim-ulations. The focus is put on anchoring rods because they have been considered as a priority in the exper-imental investigations after a report of severe dam-age on similar components on other structures. Fi-nally, the sixth section aims to estimates parameters of selected input basic random variables from meas-ured loading in rods an inverse analysis. It is per-formed by means of simplex algorithm. Several cas-es are studied and their pertinence in regard to measured loading is analyzed on the basis of Monte-Carlo simulations.
2 STATE OF THE ART FOR WHARF MONITORING
Only a few experimental investigations have been reported on wharf structures. This fact is probably due to the difficulty to select suitable sensors associ-ated to a lack of real need of a feedback in design studies for further wharves design andconstruction. Five studies have been found in scientific references: The Seaforth Dock in Liverpool (Uhf, 1969): moulded wall supported by vertical arches topped by a docking frame and a slab itself tied up to the bank by active injected anchoring rod placed in a vertical position.
The Bougainville dock at Le Havre (Blivet et al., 1981): moulded wall anchored with a layer of active injected rods.
The Osaka dock at Le Havre (Delattre et al., 1999) and a dock in Calais harbour (Delattre et Mespoulhe, 1999): moulded wall anchored with two layers of passive rods clamped to a line of sheet piles.
Docks of Hamburg harbour (Gatterman et al., 2001, Rodatz et al., 1994 and 1995): hybrid technol-ogy with a retaining wall and slab on piles, anchored to the bank by slanting passive rods.
The most widespread monitoring strategy con-sists in instrumenting only one section of the struc-ture with a set of sensors to measure mainly the stress state in the soil, the vertical deflection of the wall and anchoring loads like in classical experi-ments for retaining walls. On the other hand, seldom are measurements along the length of the structures.
This approach of investigation in a cross section brings a representation of the main loads and corre-sponding displacements and strains involved at the location of the sensors, but two problems are to be noticed: Firstly, measurements depend on the natural variability of the soil, which is impossible to quanti-fy at this location compared to the others along the structure, and this leads to a lower confidence in the data recorded.
Secondly, the successive cross sections of the structure are not mechanically independent and events occuring in one section may affect signifi-cantly the behaviour of another one and especially the monitored one.
The last point to mention is that even if monitor-ing is conducted durmonitor-ing a long time, only the first months of data collected are reported. Then scien-tists can not investigate long term phenomena like creep behaviour.
3 WHARF DESIGN AND INSTRUMENTATION 3.1 Technological description of the wharf
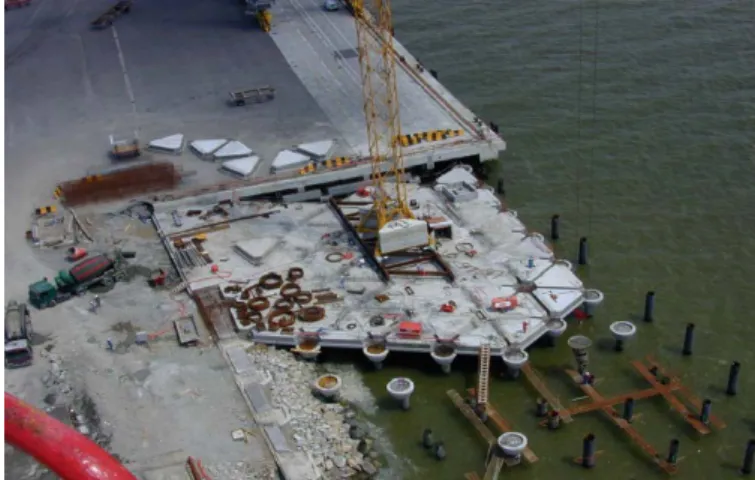
The wharf is built on piles driven in the ground. It has been designed for big tonnage ships, and is lo-cated near the sea, at the mouth of the river Loire. Two pictures of this wharf during its building are shown on picture in figure 1. The main design con-cept is to distinguish the ability of the structure to support vertical and transversal loads. It generally leads to the best compromise between technology and cost: as an example, rods are dedicated to bear a high part of transverse loading (ship mooring,...) and allows to keep pile diameter in a reasonable range in terms of beating power.
It is made up of a reinforced concrete deck (255 x 43 m) with a triangular network of reinforced con-crete beams 0.75 m high and a reinforced dam 0.25 m thick. At each node of this network, a steel pile is filled up with concrete: They are altogether 332 with diameters varying from 0.711 to 0.914 m and steel thickness from 10.3 to 12 mm depending of the pile’s location. They are beaten down to the rock deck at around 45 m deep. The function of this platform is to support vertical loading of containers, a mobile crane (335 tons) and lifting frame struc-tures (1100 tons). The wharf is leaned against a ver-tical reinforced concrete wall ("back-wharf wall") 4.35 m high. It is dedicated to embankment loading: The embankment ballast is 0/180 mm. Under this wall, a vertical sheet pile 4.5 m high prevents small soil particles from leaking. The role of the platform is also to average horizontal loading due to em-bankment and ship mooring which can not totally pass through the radial capacity of piles. For this reason, the wharf is anchored inside the bank by 38 steel rods of diameter 8.5 mm and length 20 m. At their ends, rods are clamped between the back-wharf wall and a vertical reinforced concrete anchoring plate embedded in the bank. An explaining diagram shows the architecture of the structure in Fig. 2
Figure 2. Sketch of a wharf section.
3.2 Instrumentation
The wharf is instrumented with two kinds of sensors (shown in Fig.2).
• 12 couples of vibrating wire sensors (WR) clamped on the anchoring rods: The use of two sensors in the same cross section, one on top and one at the bottom, allows the measurement of normal load and bending moment. Instrumented rods are the end ones (upstream and downstream), and 10 regularly distributed ones along the wharf. They are classified with their distance x along the wharf, from upstream (x = 0) to downstream (x = 250 m). Rods at the ends are instrumented in three sections in order to analyze the effect of soil along the rod (see figure 5).
• 1 piezometer, located inside the bank, in the mid-dle of the wharf, used to measure the water level. Thus, knowing the actual sea level in the river Loire -provided by the port services-, the differ-ence between the levels in the sea and in the bank can be deduced.
The measures are recorded every 3à minutes with a Campbell CR10X acquisition system. This period is relevant for the description of periodic processes like tide affecting the mechanical response of the structure (approximately 12 hours periodic). The same period of data storage was used at the Contain-er TContain-erminal AltenwContain-erdContain-er, in the port of Hamburg, which is another instrumented on-pile wharf, build with quite the same technology (Gattermann et al., 2001). Data have been recorded since the 1st of Oc-tober 2002. The number of sensors has been deter-mined for cost reasons and also to get a satisfactory confidence in the estimate of mean and standard de-viation of measurements.
3.3 Data pre-processing.
A first processing is made on the initial data. The water level is deduced from a pressure measurement
providing a proportional electric signal. For load measurements, the vibrating wires give specific fre-quency values transformed into strains by means of equation 1 : ) N K(N ε 2 0 2− = (1)
where K is the calibration coefficient given by the supplier, N0 the frequency at a time t = t0 and N the current frequency. Values of N0 have been recorded for all sensors just once they have been clamped on the rods. They are called "zero-states". ε is then an absolute measure.
The tension load F is deduced from both strain values for the same couple of sensors with equation 2 : 2 ε ε ES F u + l = (2)
where E is the Young's modulus of the rod (steel), S the cross section of the rod, ε and u ε are respec-l
tively the strain in the upper and lower vibrating wires.
4 SENSITIVITY AND UNCERTAINTY STUDIES 4.1 Finite element model as numerical support for
sensitivity analysis
Reliability analysis suggests to carry out uncertainty and sensitivity studies before and during modelling in order to provide robust probabilistic models as in-put to limit state functions. Response Surface Meth-odology is devoted to this last point. It has been widely developed during the last decade and re-sponse function models, including non-linear ones are now tractable, especially for the specific re-quirements of structural reliability analysis (Labey-rie and Schoefs, 1995). This way is no more investi-gated in this paper as the subject is to focus on a better understanding of physical underlying mecha-nisms which are the source of main variations and affect reliability of wharves.
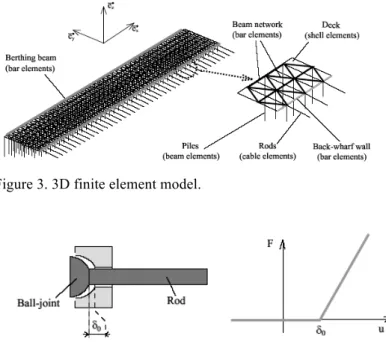
The point of view selected here is to analyse ef-fects of randomness around the main mechanical model which describes accurately the wharf behav-iour by means of the use of a 3-D finite element model. It is described on figure 3. The following el-ements are selected to take into account the main constitutive elements of the structure:
- triangular web on reinforced concrete beams is modelled with bar elements, assuming that their main loading case is a tensile one. Bending stiffness is included in bending capacity of the deck (see below).
- reinforced concrete deck is modelled by shell elements. Its tensile load stiffness (in (ex,ey)
→ →
stiff-ness (→ x
e and e→y axis) takes the contribution of
the triangular web of beams into account.
- berthing beam and back-wharf are modelled with bar elements. The aim is to include them in the global axis →
x
e bending stiffness of the
wharf.
- piles are modelled by beams with Winkler model for taking the soil-pile interaction into account. Only a linear elastic behaviour is con-sidered due to low measured and computed dis-placements (see Verdure, 2004).
- rods are modelled by cable elements, which be-haviour law is drawn in figure 4. F denotes axial load and u axial displacement. Kt is the overall stiffness of rod-soil. δ0 is the play in the
ball-joint. It allows to introduce a lack of pre-stressed loading and of wharf displacement and leads to unloaded rods. It will be used further in the paper. They are simply supported on the back-wharf wall, and the other end can be sub-jected to given displacements.
Figure 3. 3D finite element model.
Figure 4. Sketch of the clamping device and constitutive law of the rods.
This 3-D FE model allows to discuss the com-plexity level to be considered in modelling and the role of each component :
- complexity level for platform FE model: model presented in figure 3 gives the following per-centage of relative stiffness for →
z
e axis bending:
32% for the slab(deck), 10% for beam network, 58% for the berthing beam and back-wharf wall. Design hypotheses, where only the effect of slab is considered, leads to underestimate the stiffness with factor 3. It is conservative but not suitable for in-service behaviour modelling and reliability analysis.
- complexity level in pile modeling: the complete 3D FE meshing allows to discuss the relative bending stiffness of axis→
x
e for each row of pile
and rods: the percentage is 51% for rod and 45, 20, 13, 8, 7, 3, 2, 2, 1 percent respectively for the 8 rows of piles from river to backwharf wall. The effect of bending stiffness of axis→
y
e
has been discussed according to its contribution in case of wharf rotation and because of the width of wharf (42 m): it has been shown to be negligible (Verdure, 204).
4.2 Design hypothesis without monitoring data First we present main hypothesis which are general-ly assumed. They come from expert judgment and uncertainty studies performed during preparation of European semi-probabilistic code format called Eu-rocode 7 (de Grave, 2002). Judgment of expert of wharf design leads to several analyses:
- rods are pre-stressed and are loaded by the plat-form depending of the platplat-form deplat-formation on-ly.
- immediately after construction, loading on the vertical reinforced concrete anchoring plate em-bedded inside the bank allows are sufficient to assume that passive earth pressure acts in totali-ty: limit state is reached.
4.3 Benefit of monitoring data
The instrumentation of several wharves in Nantes need to stand back to analyses presented above.
First, loading on reinforced concrete anchoring plate on which rods are clamped, is very fair. In fact two rods located at the ends have been instrumented in three points (see Fig. 5). It allows to analyze how loading varies along a rod. Figure 6 presents varia-tions around 0 of loading during two days at this three sections: higher amplitudes are obtained for the section near the back-wharf, and lower for the sec-tion near the plate. This amplitude near the plate is about 10 times lower than the amplitude near the back wharf. Thus, it is very questionable to assume that displacement is sufficient to be at the source of passive earth pressure. In case of storm, the dis-placement could be higher and be the source of structural disorder.
Figure 5. Rod instrumented in three sections: couples of vibrat-ing wire (VW) and cell.
Figure 6. Loading variation with time according to sensors pre-sented in figure 5.
Second, the variations of normal load in rods along the length of the wharf are large. Figure 8 gives average values upon a tide, on September 20th 2002, for these measured loads after embankment works. Moreover, some rods seems not to be loaded which makes questionable expert judgment present-ed upon. The following of this paper will focus on this anomaly to show how measurements and finite element model can be coupled for the identification of basic variables.
The evolution of rods loading with time are also of first interest and are widely commented in Ver-dure (2004) and VerVer-dure et al. (2003).
4.4 Sensitivity analysis
Sensitivity analyses have been performed including several factors :
- embankment loading: two selected values of passive earth pressure coefficient Ka are 0.23 obtained from limit state balance (Soubra and Macuh, 2002) and 0.6 from relaxed sol loading. The first one is selected because it allows to ex-plain the upper bound of loading in rods. For embankment loading only, it leads to a soil load per meter of 134 kN/m or 896 kN every rod lo-cation: they are distant of 6.65 m. For a great tide loading, the load is of 14.1 kN/m (94 kN every 6.65 m).
- soil-pile interaction with three configurations: design hypotheses and two realistic ones versus presence or absence of sludge. They respective-ly lead to values of equivalent stiffness for pile of 43.2, 36.3 and 94.9 MN/m.
As the aim of this paper is to understand underly-ing mechanisms which are source of randomness, these studies which have led to second order effects, are not presented. Results are given in Verdure (2004). Focus is put on the sensitivity analysis on rod and its interaction with soil. In fact soil-rod in-teraction model should include four levels: play in the clamping device, soil elasto-plastic behavior around the anchoring plate, adhesion of soil to rod and bending behavior of rod due to soil compression As these options are very hard to quantify for
in-service behavior, a global soil-rod stiffness is con-sidered in the following. Detailed investigations on this subject are available in Verdure (2004).
5 MONTE-CARLO SIMULATION
5.1 Simplified beam model for simulations
The model presented in section 3.1 is interesting as reference model but time cost is too high to perform sensitivity studies in a probabilistic way. For cost reason a more simple model, based on Timoshenko beam theory is introduced:
- the deck is modeled by a Timoshenko beam with stiffness EI = 2.15 1014 N.m² and KGS = 1.9 1011 N.
- each row of piles, in (ex,ey)
→ →
plane) is modeled by a →
y
e -axis spring with stiffness 58.2 MN/m. It
is obtained from soil modulus Es adapted for each row of pile wit a special care to the 3 first rows near the river which support 78 % of lat-eral loading (see section 4.1).
- the rods remain the same as in the 3-D model, i.e. cable elements.
It allows to take into account local shear effects which come here from mooring or transverse crane loading, due to wind. Figure 7 gives a sketch of this model.
Figure 7. Equivalent beam model.
This model allows to keep the mechanical behav-iour of the wharf and to perform simulations.
5.2 Simulation strategy.
Two behaviors of the wharf can be considered de-pending of loading:
- behavior considering only embankment loading which allows to analyze the role of the techno-logical play δ0 and the soil-rod stiffness
pre-sented in figure 4.
- behavior during an increasing tide which leads to introduce the equivalent stiffness of rod-soil. For this last hypothesis, it must be assumed that rods cannot change their state (loaded or unloaded) during a given tide. Ins this paper only the first one is considered. Monte-carlo simulations are per-formed according to techniques of equalization ker-nel presented by Akaike (1954), Rosenblatt (1956) and Parzen (1962). Randomness of play and
stiff-ness are not considered simultaneously as output sta-tistics are too poor.
5.3 Simulation of the play.
This first study aims to analyze effect of play in mean loading profile. Variation of loading with length is presented on figure 8. Several rods have been put out of the data base. Reasons are given in Verdure (2004). Some of loads are null or negative, others vary with a profile which cannot be under-stood by a classical mechanical deterministic analy-sis.
Embankment loading is 896 kN every 6.65 m (distance between rods). We draw probability densi-ties from this profile according to the assumption that negative loads are considered as null (see figure 9). In fact, this first analysis is performed with the one-side-only rod model shown in figure 4.
Figure 8. Load average for embankment loading along wharf length.
Figure 9. Probability density of loading in rod for embankment.
Figure 10. Probability density of loading in rod for embank-ment loading for several hypothesis of statistics for play.
To analyze the effect of the play !0 only on the
loading distribution in rods, numerical tests are per-formed through Monte-Carlo simulations. As the main statistical effects are seeked, a normal distribu-tion is considered with three hypotheses for sensitiv-ity study: The mean takes three values (0.5, 1 and 1.5 cm) when the standard deviation is set to 0.5 cm. Then sgtatistical samples of 38 rods are built. To remove bias in estimates due to small size of sam-ples, the same basic sample is selected to compare the hypotheses.
Figure 10 gives results obtained for a given sam-ple. We can notice that the mean value of play af-fects the number of unloaded rods. In fact, rods are loaded only if the wharf displacement exceeds the play. The most suitable statistical properties for !0
seem to be; m!0 =10 and "!0 =0.5.
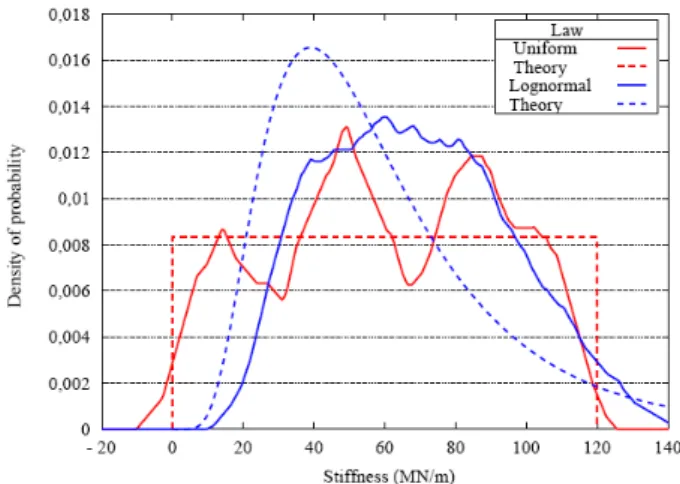
5.4 Simulation of the overall soil-rod stiffness. Let us consider now the effect randomness in soil-rod stiffness only at given play, set here to zero. It allows to take into account the second order effect of friction forces between wharf-wall and instrumented section 1 meter apart (see figure 5). Several hypoth-eses for soil-rod stiffness are tested and presented on figure 11: uniform, log-normal with mean value at 60 MN/m and standard deviation at 34.6 MN/m. This distribution allow to keep positive values for stiffness. The aim is to analyze how distributions are transferred. Figure 11 shows the theoretical p.d.f. and the p.d.f. obtained from samples of size 38. Val-ues smaller and higher than distribution theoretical bounds are obtained due to the technique of equali-zation kernel. Load distribution obtained for this hy-pothesis are shown in figure 12.
Figure 11. Experimental and theoretical distribution selected for soil-stiffness distribution.
Figure 12. Load distribution in rods for two distributions types of soil-rod stiffness.
A pure translation of platform should lead to the same distribution of rod type. Due to the stiffness of the platform, only a rotation is observed and the ini-tial distribution types are quite preserved.
6 INVERSE PROBLEM: SIMPLEX METHOD 6.1 Results of inversed problem.
Previous sections allow to understand main effects of distributions of couple of basic random variables (δ0 , Kt). The objective is now to compute
parame-ters of distributions which lead to output distribu-tions. This inverse problem is solved here with a simplex optimization method (Nelder and Mead, 1965). The algorithm is detailed and illustrated in Verdure (2004). The number of loops selected for simulations is 50 which results from a compromise between calculation costs and result stability. In what follows, only δ0 is considered as a random
var-iable. The full study is available in Verdure (2004). δ0 is assumed to be normally distributed. Thus,
op-timization problem can be written as a minimization of a cost function λ, which has here a quadratic form. Two optimization strategies are presented in the selection of optimization parameters. Equation 3 presents this cost function for two optimization pa-rameters: mδ0 and σδ0 (mean and standard deviation
of (δ0)). In equation 4, one more parameter called p
is added. p is the percentage of unloaded rods. It al-lows to condition the problem. Due to the small data base, several values are selected for p. It is to notice that in this case, statistics of rod loads are estimated from the set of loaded rods.
2 mes F F 2 mes F F 1 1 m m ) , m ( 0 0 ⎟⎟ ⎠ ⎞ ⎜ ⎜ ⎝ ⎛ − σ σ + ⎟ ⎟ ⎠ ⎞ ⎜ ⎜ ⎝ ⎛ − = σ λ δ δ (3)
Where mF and σF are the computed mean and
standard deviation of load in rods and mFmes and
σFmes the corresponding measured values.
2 mes F F 2 mes F F 2 mes 1 * 1 * m m 1 p p ) , m ( 0 0 ⎟ ⎠ ⎞ ⎜ ⎝ ⎛ − σ σ + ⎟ ⎠ ⎞ ⎜ ⎝ ⎛ − + ⎟ ⎠ ⎞ ⎜ ⎝ ⎛ − = σ λ δ δ (4) Where m*F and σ∗F are mean and standard
com-puted on the set of values for loaded rods.
Due to the small size of sample, the solution is not unique. In the following, standard deviation of δ0
statistics and associated 95 % confidence interval are given: they are obtained from 10 successive numeri-cal resolutions. For the first problem (Eq. 3), target values are mFmes = 134 kN et σFmes = 178 kN.
Re-sults are presented in table 1.
Table 1 : solution of optimization for target values mFmes = 134
kN, σFmes = 178 kN
Parameter Mean
[mm] Standard devia-tion [mm] 95% confidence interval [mm] mδ0 12.6 0.4 [12.2 ; 13.0]
σδ0 5.1 0.35 [4.8 ; 5.4]
Results are very close to those obtained from the di-rect analysis (see figure 10). It confirms the robustness of numerical and mechanical models.
For the second problem (Eq. 4), two bounds of target values are selected for taking into account the reduced percentage of instrumented rods:
- p mes = 0.5, m*Fmes = 296 kN et σ∗Fmes = 94 kN.
- p mes = 0.27, m*Fmes = 296 kN et σ∗Fmes = 94 kN.
Table 2 and 3 presents respectively results obtained for first and second conditions.
Table 2: solution of optimization with p=0.5 Parameter Mean [mm] Standard devia-tion [mm] 95% confidence interval [mm] mδ0 13 3.6 [9.9 ; 16.1] σδ0 5.4 1.6 [3.9 ; 6.8]
Table 3: solution of optimization with p=0.27 Parameter Mean
[mm] Standard devia-tion [mm] 95% confidence interval [mm] mδ0 11.5 0.3 [11.2 ; 11.8]
σδ0 3.5 1.5 [2.2 ; 4.8]
6.2 Direct simulation from the results of the
inverse problem
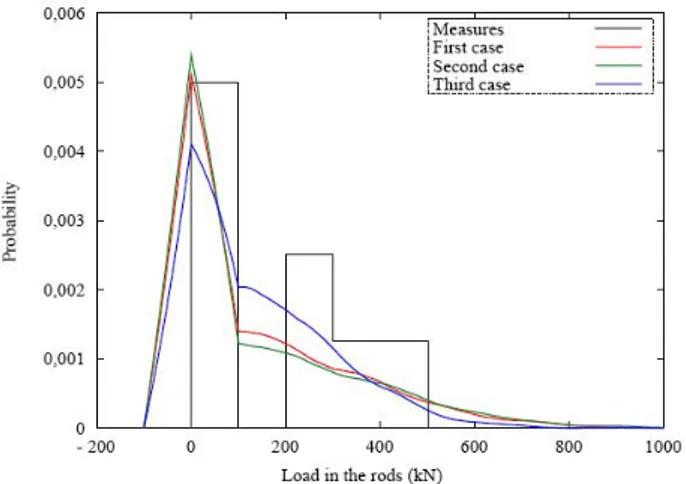
We now analyze the effect of results obtained previ-ously on the output distribution. Direct simulation of Monte-Carlo is used. Statistics of rods are deduced from the mean of 50 samples. Results obtained for the three hypotheses upon in tables 1, 2 and 3 and called respectively first, second and third case are presented in figure 13.
Figure 13. P.d.f obtained from direct simulations.
Parameters deduced from inverse method seem to represent the main trends: percentage of unloaded rods and global shape of the distribution. In terms of reliability analysis, these results are more questiona-ble. In fact loads can reach value of 800 kN which has never been met in measures. It is due to the fact that a percentage of unloaded rods must be balanced by extreme values. Mean and standard deviation of measures are shown not to be sufficient to describe the overall problem with accuracy. In this case, the problem is badly conditioned. In fact, the number of parameters (3) is upper than the number of inputs (2). Table 4 gives results of measured statistics (tar-get values) compared to those obtained from direct analysis. It is shown that the competition between the terms of cost-function (Eq. 4) leads to a bias in the evaluation of mean and standard deviation. For further works it could be interesting to modify the cost function with a different weight for the three terms depending of the confidence on each.
Table 4: statistics of direct problem compared to target values. First case Second case Third case
m σ m σ p m σ p Target value 134 178 296 94 0.5 296 94 0.27 Simultation 134 176 246 178 0.47 198 133 0.31
Finally, the technological play obtained is con-sistent with those published for the deep water har-bour of Calais (Delattre and Mespoulhe, 1999) where the play is about 6 mm.
7 CONCLUSION
Reliability of complex structures such as wharves require analyses on basic variables selection and un-certainties modeling. After a detailed analysis on structural behavior and sensitivity, the paper focuses on two basic variables which allow to understand output distributions: play in clamping device and equivalent soil-rod stiffness. Direct simulations
through a simplified finite element model are per-formed as sensitivity studies. They allows to consid-er these variables as basic dominant ones. Then an inverse method based on the simplex algorithm al-lows the estimate of input distribution parameters. A bias in the evaluation of these parameters appears if the percentage of unloaded rod is introduced in the inverseproblem. It illustrates that a more complete information is required as the displacement field for example.
ACKNOWLEDGMENT
The authors would like to thank Harbour Authori-ties of Nantes St Nazaire for their technical support and expert judgement.
REFERENCES
Akaike H., 1954. An approximation to the density function.
Annals of the institute of Statistical Mathematics 6. pp.
127-132.
Blivet J.C., Bonafous P., Franck R. and Josseaume B. - Com-portement d'un quai en paroi moulée au port du Havre.
Bul-letin de liaison des Ponts et Chaussées 113 (may june
1981), pp. 109-134
De Grave P., 2002. Validation partial safety factors from « probabilistic analysis sheet pile constructions (IGWR) ». Delft University of Technology, delftt and Rotterdam Pub-lic Works, Section Harbours and Waterways, Rotterdam. Delattre L., Ducas V., Scherrer P. and Rivière P. - Efforts
d'ancrage du quai D'Osaka au port Autonome du Havre. In 12th European conference on soil mechanics and
geotech-nical (Amsterdam, 7-10 1999), pp. 713-718.
Delattre L. and Mespoulhe L., 1999. Etude expérimentale du comportement du quai en eaux profondes du port de Calais.
Etudes et Recherches des laboratoires des ponts et chaus-sées, Apr. 1999.
Gattermann J., Bergs T and Rodatz W., 2001. Modified in-strumentation and results of stress and deformation moni-toring at the new quay wall construction – Container Ter-minal Altenwerder, Port of Hamburg. In Corotis et al., edts, 8th International Conference on Structural Safety and
Relia-bility, ICOSSAR 2001, Newport Beach, California, USA, pp. 17-21, June 2001.
Nelder. J and Mead R., 1965. A simplex method for function minimization. The computer journal 7.
Parzen E., 1962. On the estimation of a probability density function and the mode. Annals of Mathematical Statistics 33. pp. 1065-1076.
Rodatz W., Maybaum G. And Gattermann J. - Pressure and de-formation measurements at two retaining walls at the port of Hamburg. In 4th International Symposium of Field
Measurements in Geomechanics (FMGM 95) (Bergamo,
It-aly 1995), pp. 291-299.
Rodatz W., Hartung M. and Maybaum G. - Back analysis of geotechnical measurements at the port of Hamburg based on FEM. In 8th International Conference on Computer
Methods and Advances in Geomechanics (Morgantown
WV, May 1994), Siriwardane and Zaman Ed. Balkema, pp. 2005-2010.
Rosenblatt M., 1956. Remarks on some nonparametric esti-mates of a density function. Annals of Mathematical
Soubra A.H. and Macuh B., 2002. Active nad Passive earth pressure coefficients by a kinematical approach,
Geotech-nical engineering 155, 2 (Apr. 2002), pp. 119-131.
Uff J. F. - In situ measurements of earth pressure for a quay wall in Seaforth, Liverpool. In Proceedings of the British
Geotechnical Society Conference (London, 13-15 may
1969) pp- 229-239.
VerdureL., Casari P. and Wielgosz C., 2003, Joint use of in-strumentation and probabilistic modelling applied to a con-tainer wharf. Proc. 9th International Conference on applica-tions of Statistics and Probability in civil engineering, ICASP 9, San Francisco USA.
Verdure L., 2004. Cadre statistique du suivi en service des ou-vrages de génie civil : application à un quai sur pieux. PhD Thesis. 29/06/04, Université de Nantes, 232 p.
Whitaker T. 1970. The design of piled foundation. Pergamon