Essays in International Trade
par
Walter Steingress
Département de sciences économiques
Faculté des arts et sciences
Thèse présentée à la Faculté des études supérieures
en vue de l’obtention du grade de Philosophiæ Doctor (Ph.D.)
en sciences économiques
Decembre, 2014
Université de Montréal
Faculté des études supérieures
Cette thèse intitulée :
Essays in International Trade
présentée par :
Walter Steingress
a été évaluée par un jury composé des personnes suivantes :
Baris Kaymak
président-rapporteur
Rui Castro
directreur de recherche
Andriana Bellou
directrice de recherche
Alessandro Barattieri examinateur externe
Michael Hubermann
vice-doyen, représentant du doyen de la FAS
Acknowledgements
Je tiens en premier à remercier mes directeurs de thèse Rui Castro et An-driana Bellou pour leur présence continue, leurs amabilité, leurs conseils de tous genres, pour m’avoir encouragé dans toutes les étapes de cette thèse et d’avoir surtout cru en moi. Ils etait sans doute les personnes clés et les plus déterminantes dans l’élaboration de cette thèse. Merci encore Andriana et Rui.
Mes remerciements vont également à Baris Kaymak qui me suit depuis la première présentation orale de cette thèse. J’aimerais tout aussi remercier Stefania Garetto pour tout l’appui qu’elle m’a apportée lors de mes trois dernières années de thèse. Grazie mille Stefania. J’ai également bénéfi-cié des nombreux commentaires et suggestions de plusieurs chercheurs et professeurs qui m’ont permis d’améliorer ma recherche. Merci: Francisco Alvarez-Cuadrado, Costas Arkolakis, Alessandro Barattieri, Samuel Bazzi, Kristian Behrens, Emanuela Cardia, Jonathan Eaton, Michael Huberman, Joseph Kaboski, Raja Kali, Miklos Koren, Anna Maria Mayda, Markus Poschke, Francisco Ruge-Murcia, Michael Siemer, Sebastian Stumpner, Ari Van Assche, Hylke Vandenbussche, Michael Waugh, et Pierre-Yves Yanni. Je tiens à remercier l’ensemble des étudiants de Doctorat en particulier mes collègues du bureau Ulrich, Modeste, Romuald, Firmé, Selma, Idrissa, Jonathan et aussi mes autres collègues Juste, Max, Vincent De Paul, Guy, Brahim, Catherine, Louis-Philippe, Didier, William, Hector et Ismael avec qui j’ai passé des moments inoubliables, particulièrement ces discussions dans les couloirs du département qui ont permis de raffermir mes connaissances en économie.
à des milliers de kilomètres des belles montagnes du Tirol en Autriche; je devais faire face à ce rude hiver de Montréal. J’ai trouvé sur place une grande "famille" qui m’a sans cesse soutenue dans toutes les épreuves et je ne pourrai terminer sans citer quelques noms.
Je remercie tout particulièrement mes très chers amis Rozie, Pierre-Yves, Francisco, Maliha à Montréal, Fernanda et Mariana à Ottawa, Michael, Mina, Jacopo, Emily, Giulia, Myongjin, Alejandro, Karim, Athanu et Marco à Boston avec qui j’ai tout partagé et qui ont été d’un soutien incommensu-rable. Je tiens à remercier la famille Pajaro, Matias et Anne-Sophie, ainsi que leurs adorables enfants Esteban et Francisco pour toute la chaleur familiale qu’ils m’ont apporté.
Je remercie le Département de sciences économiques de l’Université de Mon-tréal, le Centre Interuniversitaire de Recherche en économie Quantitative (CIREQ) et la Faculté des études supérieures et postdoctorales pour le sou-tien financier. Mes remerciements vont également à tout le corps professoral, au personnel administratif et particulièrement à Mélanie qui m’a toujours gratifié de sa bonne humeur et de son adorable sourire. Je termine cette section en portant une attention particulière à ma famille: mes parents Wal-ter et Gudrun pour tout leur soutien et surtout cette éducation qu’ils m’ont inculqué et ma petite soeur Ruth qui qui m’a toujours gratifié de ses sages conseils et enfin mon adorable copine Myriam qui a toujours été si indul-gente avec moi et m’a toujours soutenu malgré tout le temps passé sur mon ordinateur à travailler sur cette thèse.
Résumé
Dans ma thèse doctorale, j’étudie trois facteurs importants qui caractérisent le commerce international : les différences technologiques entre les pays, les barrières à l’entrée sous la forme de coûts fixes et la migration internationale. Le premier chapitre analyse si les différences technologiques entre les pays peuvent expliquer la spécialisation dans le commerce international entre les pays. Pour mesurer le niveau de la spécialisation, je calcule les index de con-centration pour la valeur des importations et des exportations et décompose la concentration totale dans la marge de produits extensive (nombre de pro-duits commercialisés) et la marge de propro-duits intensive (volume de propro-duits commercialisés). En utilisant des données commerciales détaillées au niveau du produit dans 160 pays, mes résultats montrent que les exportations sont plus concentrées que les importations, que la spécialisation se produit prin-cipalement au niveau de la marge intensive du produit, et que les économies plus grandes disposent d’importations et d’exportations plus diversifiées, car elles commercialisent plus de produits. Compte tenu de ces faits, j’évalue la capacité du modèle Eaton-Kortum, le principal modèle de la théorie ricar-dienne du commerce, pour représenter les preuves empiriques. Les résultats montrent que la spécialisation à travers l’avantage comparatif induit par les différences de technologie peut expliquer les faits qualitatifs et quantitatifs. De plus, j’évalue le rôle des déterminants clés de la spécialisation : le degré de l’avantage comparatif, l’élasticité de la substitution et la géographie. Une implication de ces résultats est qu’il est important d’évaluer jusqu’à quel point la volatilité de production mesurée par la volatilité du PIB est motivée par la spécialisation des exportations et des importations. Étant donné le compromis entre l’ouverture du commerce et la volatilité de pro-duction, les bénéfices tirés du commerce peuvent s’avérer plus faibles que
ceux estimés précédemment. Par conséquent, les politiques commerciales alternatives telles que l’ouverture graduelle au commerce combinée à la di-versification de la production pour réduire la concentration de l’exportation peuvent se révéler être une meilleure stratégie que l’approche du laissez-faire. En utilisant la relation entre la taille du marché et l’entrée de firmes et pro-duits, le deuxième chapitre évalue si les barrières à l’entrée sous la forme de coûts fixes à exporter sont au niveau de la firme ou au niveau du produit. Si les coûts fixes se trouvent au niveau de la firme, la firme multiproduits a un avantage de coût de production par rapport aux autres firmes parce qu’elles peuvent diviser les coûts fixes sur plusieurs produits. Dans ce cas, le com-merce international sera caractérisé par peu de firmes qui exportent beaucoup des produits. Si les coûts fixes sont au niveau du produit, l’entrée d’un pro-duit est associée avec l’entrée de plusieurs firmes. La raison est qu’une fois que la première firme entre et paye les coûts fixes du produit, elle crée un effet d’entrainement qui réduit les coûts fixes pour des firmes rivales. Dans ce cas, le commerce international sera caractérisé par plusieurs firmes qui vendent des variétés différentes du même produit. En utilisant des données détaillées provenant de 40 pays exportateurs à travers 180 marchés de destination, mes résultats montrent que les barrières à l’entrée se trouvent principalement au niveau du produit. Un marché plus large favorise l’expansion d’un plus grand nombre d’entreprises au sein d’une catégorie de produit plutôt que de perme-ttre aux entreprises produisant plusieurs produits de croître dans une gamme de produits. En regardant la différence entre le nombre d’exportateurs au sein d’une catégorie de produit dans des destinations données, je trouve que le taux d’entrée de firmes augmente significativement après qu’un produit en-tre la première fois dans le marché. J’en déduis donc que le premier entrant réduit les coûts fixes pour les firmes suivantes. Mes recherches démontrent également que malgré une plus grande compétition sur le marché du pro-duit, les entreprises disposent de revenus d’exportation supérieurs et sont plus susceptibles de rester sur les marchés internationaux. Ces résultats sont cohérents avec l’hypothèse que l’effet d’entrainement incite l’entrée de firmes rivales et permettent aux entreprises de produire à plus grande échelle. Cette recherche dévoile un nombre de conclusions importantes. D’abord, les politiques commerciales encouragent l’entrée de nouveaux produits, par exemple, en promouvant des produits dans les marchés de destination entraî-nant ainsi des retombées qui se traduiront par un taux de participation plus
élevé de l’entreprise et une croissance de l’exportation. Deuxièmement, les consommateurs du pays importateur peuvent bénéficier de prix plus bas pour le produit en réduisant les barrières techniques du commerce. Troisièmement, lorsque l’on effectue des expérimentations politiques sous la forme de réduc-tion des coûts commerciaux, il est de coutume de considérer uniquement une baisse des coûts marginaux et d’évaluer les répercussions sur le bien-être du consommateur. Cependant, un élément important des accords commerciaux est la réduction des barrières techniques au commerce grâce à la négociation de normes communes pour un produit. Négliger l’existence des barrières à l’entrée et les conséquences des réaffectations de l’industrie affaiblit l’impact des réformes commerciales.
Le troisième chapitre prend en compte le rôle de l’information dans la fa-cilitation du commerce international. Les immigrants réduisent les coûts de transaction dans le commerce international en fournissant des informa-tions sur les possibilités d’échange avec leur pays d’origine. En utilisant des données géographiques détaillées sur l’immigration et les importations aux États-Unis entre 1970 et 2005, je quantifie l’incidence qu’ont les nouveaux immigrants sur la demande pour les importations de biens intermédiaires aux États-Unis. Pour établir le lien cause à effet entre le commerce et la mi-gration, j’exploite l’important afflux d’immigrants d’Amérique centrale après l’ouragan Mitch. Les résultats montrent que l’augmentation de dix pour cent d’immigrants a fait croître la demande pour les importations de biens inter-médiaires de 1,5 pour cent. Mes résultats sont robustes aux problèmes de la causalité inverse ou la décision d’émigrer est causée par des opportunités de faire du commerce.
Mots-clés : coûts fixes, effets d’entrainement, taille du marché, théorie
ricardienne, concentration d’exportation, concentration d’importation, mi-gration, réfugié politique, ouragan Mitch
Abstract
In my PhD thesis I study three factors that shape international trade pat-terns: technological differences across countries, entry barriers in the form of fixed costs and international migration.
The first chapter analyses whether technology differences across countries can explain specialization patterns in international trade. To measure spe-cialization, I compute concentration indexes for the value of exports and im-ports and decomposes the overall concentration into the extensive product margin (number of products traded) and intensive product margin (volume of products traded). The results show that exports are more concentrated than imports, specialization occurs mainly in the volume of trade and larger economies have more diversified exports and imports because they trade more products. I then evaluate the ability of the Eaton-Kortum model, the workhorse model of Ricardian trade theory, to account for the observed facts. The results show that technology-induced specialization through com-parative advantage can explain the qualitative and quantitative facts. The key determinants of specialization are the degree of comparative advantage, the elasticity of substitution and geography.
Based on the relationship between entry and market size, the second chapter evaluates whether fixed costs are at the firm or at the product level. Within an empirical framework, I argue that fixed costs at the firm level induce a cost advantage for multi-product firms and international trade will be char-acterized by few firms selling many products. On the other hand, if fixed costs are at the product level, product entry is accompanied with lots of firms entry and international trade will be characterized by many firms sell-ing different varieties of the same product. Ussell-ing detailed product level data from 40 exporting countries to 180 destination markets, the results indicate
that entry barriers operate at the product level. The key implication of the product fixed cost is that the firm that pays the fixed cost creates a positive externality that lowers entry costs for rival exporters and increases firm entry. Looking at firm entry within products across time and destinations, I find evidence consistent with these spillover effects. Combined these results have important implications for the effects of trade policy on market structure and on the resulting gains from trade in the exporting as well as in the importing country.
The third chapter considers the role of migration in facilitating international trade. Immigrants can increase international trade by shifting preferences towards the goods of their country of origin and by reducing bilateral trans-action costs. Using geographical variations across US states for the period 1970 to 2005, we quantify the impact of immigrants on intermediate goods imports. We address endogeneity and reverse causality - which arises if mi-gration from a country of origin to a US state is driven by trade opportunities between the two locations - by exploiting the exogenous allocation of refugees within the US refugee resettlement program. Our results are robust to an alternative identification strategy, based on the large influx of Central Ameri-can immigrants to the United States after hurriAmeri-cane Mitch. We find that a 10 percent increase in recent immigrants to a given US state raises intermediate imports from those immigrants’ country of origin by 1.5 percent.
Keywords : Fixed costs, spillovers, market size, Ricardian trade theory,
ex-port concentration, imex-port concentration, migration, political refugees, hur-ricane Mitch
Dedication iii
Acknowledgements iv
Résumé vi
Abstract ix
Table of Contents xiii
List of Figures xv
List of Tables xvii
Introduction 1
1 Specialization patterns in International Trade 4
1.1 Introduction . . . 5
1.2 Empirical evidence and data . . . 9
1.2.1 Concentration measurements . . . 9
1.2.2 Data . . . 10
1.3 Model . . . 13
1.3.1 General equilibrium . . . 14
1.3.2 Concentration of exports and imports . . . 16
1.4 Calibration and simulation . . . 18
1.4.1 Symmetric countries . . . 19
1.4.2 Asymmetric countries . . . 23
1.4.3 Asymmetric trade costs . . . 24
1.4.3.1 Importer fixed effect . . . 24 xi
1.4.3.2 Exporter fixed effect . . . 25
1.5 Estimating trade costs from bilateral trade shares . . . 28
1.5.1 Discussion of results . . . 33
1.6 Robustness checks . . . 36
1.7 Conclusion . . . 37
1.8 Figures . . . 39
1.9 Tables . . . 47
2 Entry barriers to International Trade: product versus firm fixed costs 50 2.1 Introduction . . . 51
2.2 Empirical framework . . . 56
2.2.1 Fixed cost at the firm level . . . 58
2.2.2 Fixed cost at the product level . . . 59
2.3 Methodology . . . 61
2.4 Data and descriptive statistics . . . 63
2.4.1 Discussion of results . . . 66
2.5 Firm entry within products . . . 70
2.6 Conclusion . . . 75
2.7 Figures . . . 77
2.8 Tables . . . 78
3 The causal impact of migration on U.S. intermediate goods’ trade: Evidence from a natural experiment 87 3.1 Introduction . . . 88
3.2 Identification strategy . . . 91
3.2.1 Regression specification . . . 92
3.2.2 Refugees . . . 96
3.2.3 Consequences of Hurricane Mitch for Migration . . . . 98
3.2.4 Inferring regional-industry level trade . . . 101
3.3 Data and summary statistics . . . 104
3.3.1 Import data . . . 104
3.3.2 Trade cost data . . . 105
3.3.3 Industry data . . . 105
3.3.4 Immigration data . . . 105
3.3.5 Country treatment . . . 106
3.3.6 Summary statistics . . . 107
3.4.1 Instrumental variable results . . . 110
3.4.1.1 Refugees . . . 111
3.4.1.2 Hurricane Mitch . . . 112
3.5 Robustness . . . 113
3.5.1 Observed import data . . . 113
3.5.2 Effect on the exports of the country of origin . . . 115
3.6 Conclusion . . . 116 3.7 Figures . . . 117 3.8 Tables . . . 119 Bibliography 127 Appendix 141 Chapter 1 . . . 142 Chapter 2 . . . 159 Chapter 3 . . . 164
1.1 Average export versus import concentration for the period 1992 to 2009 for 160 countries . . . 39 1.2 Average export and import concentration versus the log of
average relative GDP with respect to the United States for the period 1992 to 2009 for 160 countries. . . 40 1.3 Simulated (in red) and empirical observed (in blue) export and
import concentration versus GDP across 160 countries. The simulation uses parameterized trade costs to match the data using a country specific export cost. . . 41 1.4 Simulated (in red) and empirical observed (in blue) export and
import concentration versus GDP across 160 countries. The simulation is based on estimated trade costs form bilateral trade shares including an exported fixed effect. . . 42 1.5 The simulated (in red) and empirical observed (in blue) share
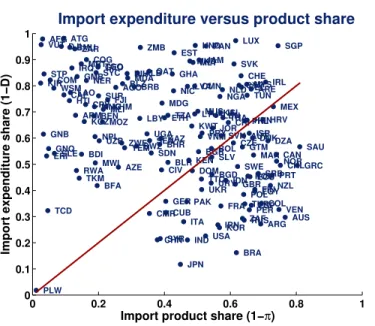
of the number of products traded against the number of trad-ing countries. . . 43 1.6 The import expenditure share versus the import product share.
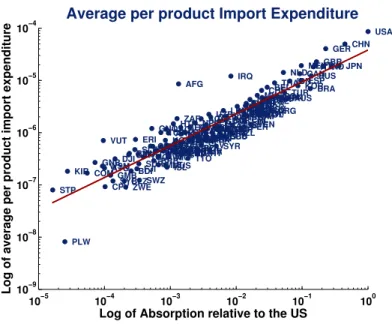
. . . 44 1.7 The log of average per product import expenditure against log
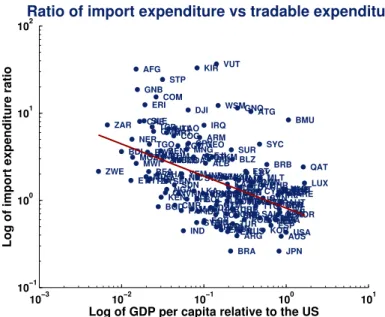
of Absorption. . . 45 1.8 The log of the ratio of average per product import
expendi-ture with respect to average per product tradable expendiexpendi-ture against log of GDP per capita. . . 46 2.1 Number of Spanish exporting firms and number of Spanish
products exported versus market size in destination d. . . 57 2.2 The firm entry rate over time after a product is exported to a
market for the first time. . . 77
3.1 The log of the number of immigrants who immigrated from hurricane Mitch affected countries (Nicaragua, El Salvador, Honduras, Guatemala and Belize) over the period from 1998 to 2005. . . 117 3.2 The log of the number of refugees who immigrated to the
United States over the period from 1985 to 2005. . . 118 A.1 Export versus import concentration on the 4 digit SITC level . 156 A.2 Export versus import concentration for gross trade flows . . . 157 A.3 The relationship of export and import concentration verus
1.1 Mean concentration indexes over 2880 country-year pairs . . . 12 1.2 Simulated export and import concentration indexes for
bench-mark parameters. . . 22 1.3 Simulated export and import concentration indexes for
asym-metric countries. . . 27 1.4 Estimation Results . . . 30 1.5 Simulated concentration level with exporter fixed effect . . . . 32 1.6 Country-Specific Technology and Trade Costs estimates . . . . 47 2.1 Exporting countries in the sample . . . 78 2.2 Importing countries in the sample . . . 79 2.3 Summary Statistics . . . 80 2.4 Entry of firms and products with respect to market size . . . . 81 2.5 Fixed costs and the number of exporters per destination . . . 82 2.6 Fixed costs and the number of exporters per destination . . . 83 2.7 Fixed costs and the number of exporters per destination for
differentiated, less differentiated and homogeneous products . 84 2.8 Relationship of market size and the number of firms and
prod-ucts including the decompostion of the extensive margin . . . 85 2.9 Relationship between market size and the number firms and
products including proxies for fixed costs . . . 86 3.1 Summary Statistics . . . 119 3.2 Refugee-Sending Countries over the 5 years prior to the census
years: 1985 to 1990, 1995 to 2000 and 2001 to 2010 . . . 120 3.3 Gravity Equation with OLS estimates for the full sample
in-cluding all countries and the restricted sample with Latin American countries only . . . 121
3.4 Gravity Equation with first and second stage IV estimates for all countries . . . 122 3.5 Gravity Equation with first and second stage IV estimates for
Latin American countries . . . 123 3.6 Gravity Equation with OLS estimates for the 2010 sample
including all countries and the restricted sample with Latin American countries only . . . 124 3.7 Gravity Equation with first and second stage IV estimates for
all countries in the year 2010 . . . 125 3.8 Effect of Hurricane Mitch on total exports from
hurricane-affected countries. . . 126 A.1 Descriptive statistics for net trade flows based on the 4 digit
SITC industry classification: 160 countries . . . 151 A.2 Mean concentration indexes for gross trade flows over 2676
country-year pairs . . . 153 A.3 Export and import concentration indexes for benchmark model
and symmetric costs with Poisson parameter µ = 0.94. . . 154 A.4 Simulated concentration level with Poisson parameter µ =
0.94 and exporter fixed effect . . . 155
A.5 Relationship between market size and the number firms and products taking into account cross-country differences . . . 162 A.6 Pseudo Poisson Maximum Likelihood . . . 163 A.7 Effect of transport costs on industry trade flows in gravity
model. . . 168 A.8 Difference in Difference estimation: Number of migrants after
Introduction
We live in a more and more globalized world where countries increasingly ex-change their economic resources. Deeper international economic integration expands the global goods, capital and labor markets. The costs and benefits of international exchange continue to be widely discussed and are among the most pressing issues in a globalized world. This thesis contains three chap-ters that study several relationships that are important for understanding the full impact of economic globalization around the world: i) determinants of the pattern of trade; ii) entry barriers to international trade; and iii) the effects of migration on international trade.
In the first chapter, titled “Specialization patterns in International Trade”, I assess the ability of a standard workhorse model of international trade to explain the pattern of trade. To start with, I document new facts on the pattern of international specialization by looking at export and import con-centration. To measure specialization, I compute concentration indexes for the value of exports and imports and decompose the overall concentration into the extensive product margin (number of products traded) and the in-tensive product margin (volume of products traded). Using detailed product-level trade data for 160 countries, I find that exports are more concentrated than imports, specialization occurs mainly on the intensive product mar-gin, and larger economies have more diversified exports and imports because they trade more products. Based on these facts, I evaluate the ability of the Eaton-Kortum model, the workhorse model of modern Ricardian trade theory, to account for the observed patterns. The results show that spe-cialization through comparative advantage induced by technology differences can explain the qualitative and quantitative facts. Also, I evaluate the role of the key determinants of specialization: the degree of comparative advantage, the elasticity of substitution and geography.
These results have important policy implications. Excessive specialization results in a high degree of export concentration implying that only few prod-ucts are responsible for the majority of export revenue and import expendi-ture. Given that openness to trade induces specialization, globalisation will increase output volatility and therefore the likelihood that product specific shocks have aggregate effects on output volatility and/or negative effects on the terms of trade. The implied trade-off between openness to trade and output volatility suggests that benefits from trade may actually be lower as previously estimated. As a result, alternative trade policies such as gradual openness to trade combined with diversification of production to lower export concentration may represent a better strategy than a laissez-faire approach. The second chapter, titled “Entry barriers to International Trade: product versus firm fixed costs“, focuses on the importance of fixed costs to export in shaping the international trade pattern. Fixed costs to export create entry barriers that restrict trading opportunities between countries. In the presence of these costs, market size will matter because larger markets ease the relevance of fixed costs by allowing firms to slide down the average cost curve and produce at a more efficient scale. I use the relationship between the extensive margins of exports and destination market size to evaluate whether fixed costs operate at the firm or at the product level. If fixed costs are at the firm level, multi-product firms have a cost advantage and dominate international trade. If fixed costs are at the product level, many firms export different varieties of the same product. Using detailed product level data from 40 exporting countries to 180 destination markets, the results indicate that entry barriers operate at the product level. The key implication of the product fixed cost is that once a firm or a group of firms decides to pay the fixed costs, subsequent exporters of those products do not need to pay this fixed cost. Looking at firm entry within products across time and destinations, I find evidence consistent with the spillover effect. Once a product enters a destination market for the first time, the firm entry rate increases significantly the following two years before gradually slowing down. Further evidence shows that the efficiency gains in production through lower product fixed costs outweigh the competition effects from more firm entry. A number of important conclusions emerge from this research. First, trade theory based on increasing returns to scale explains entry behaviour of firms
and products into international markets. Second, trade policies encourag-ing new product entry, such as advertisencourag-ing products in destination markets through export promotion agencies, rather than firm entry could potentially lead to spillover effects that translate into higher level of firm participation and export growth. Third, when conducting policy experiments in the form of a reduction in trade costs, it is standard in the literature to consider only reductions in marginal costs and evaluate the resulting impact on consumer welfare. However, an important aspect of free trade negotiations is the reduc-tion of technical barriers to trade by establishing common product standards, see the current EU-US free trade negotiations. Neglecting the existence of entry barriers and the resulting industry reallocations underestimates the impact of trade reforms.
The third chapter, titled “The causal impact of migration on U.S. interme-diate goods’ trade: Evidence from a natural experiment“, focuses on the role of migrants in international trade.International migrants can increase international trade flows via two distinct mechanisms. First, migrants shift preferences towards their origin country’s products, thus creating demand for imports of those goods by their host country. Second, migrants reduce trans-action costs between countries, either by carrying information about relevant market characteristics or by attenuating frictions due to imperfect contract enforcement. Using geographical variation across U.S. states for the period 1970 to 2005, we quantify the impact of immigrants on intermediate goods’ imports. In particular, we follow a gravity approach and regress the log of intermediate imports on the log of recent immigrants. We address reverse causality, and more broadly endogeneity, and find evidence of a significantly positive effect of immigrants on U.S. intermediate imports. To estimate a causal relationship, we exploit the large influx of Central American immi-grants to the U.S. after hurricane Mitch. Our results are robust to using an alternative identification strategy, based on the exogenous allocation of refugees within the U.S. refugee resettlement program. We find that a 10 percent increase of recent immigrants to a given U.S. state increases imports from those immigrants’ origin country by 1.5 percent. Overall, our results suggest that immigrant networks play an important role in promoting trade across countries.
Chapter 1
Specialization patterns in
International Trade
1.1 Introduction
The pattern of specialization is at the core of international trade theory. A consequence of international trade is that countries do not need to produce all their goods, instead they can specialize in the production of certain goods in exchange for others. Trade theory offers different explanations of how countries specialize in the number and sales volume of goods. Assessing the empirical relevance of the underlying theory is of vital interest since it not only allows evaluating the gains from trade through specialization but also informs how the trade pattern affects the structure of an economy. For example, a high degree of specialization increases the likelihood that product specific shocks have aggregate effects in terms of output volatility and/or an impact on the terms of trade.
The contribution of the paper is twofold. Firstly, it uncovers new facts on the pattern of specialization by looking at export and import concentration. It decomposes the overall level of concentration into a measure for the extensive and intensive product margin and documents concentration levels for exports and imports on all margins. The extensive product margin indicates the degree of specialization in the number of goods traded. The concentration index on the intensive margin measures specialization in the volume of goods
traded. Secondly, the paper evaluates the Eaton and Kortum [2002] model’s
ability to account for the observed specialization patterns. Specifically, it tests the model based on three basic questions about specialization: What explains the level of specialization in exports and imports? What determines the gap between specialization in exports and imports? Does specialization occur on the intensive or extensive product margin?
Based on detailed product-level trade data for 160 countries, the results show that, on average, countries specialize more in exports relative to imports, with Gini coefficients of 0.98 and 0.91 respectively. The decomposition reveals that specialization of exports occurs predominately on the extensive mar-gin. Countries receive their export revenues from few products. At the same time, countries import a wide range of products but concentrate their expen-diture towards a small number of products. Hence specialization of imports is driven by the intensive margin. The difference between the concentra-tion levels of exports and imports is due to the extensive margin. Countries specialize in exporting few goods and diversify on imports by acquiring
vari-ous products from abroad. Focusing on cross-country differences, I find that larger economies have more diversified imports and exports. This is mostly along the extensive margin, i.e. large economies export and import a wider product range.
Having documented the observed specialization pattern, I employ a standard
Ricardian trade model developed by Eaton and Kortum [2002] to evaluate
its ability to reproduce the stylized facts. To incorporate the fact that goods
cross borders multiple times, my analysis relies on Alvarez and Lucas[2007]
version of the Eaton and Kortum model. A key implication of this model is that it uncovers how comparative advantage due to technology differences determines specialization endogenously on both the extensive and the inten-sive product margins. Furthermore, it identifies geography together with the elasticity of substitution and the degree of absolute and comparative advan-tage as the main determinants of specialization. A higher level of technology increases a country’s absolute advantage and diversifies the extensive mar-gin of exports by broadening the product range it exports. The degree of comparative advantage heightens the sensitivity of concentration to changes in unit costs, thereby dictating specialization on both margins. Trade costs decrease comparative advantage and increase specialization on the extensive and intensive margin. A higher elasticity of substitution provides for better substitution between intermediate goods and allows countries to concentrate their expenditure in low price sectors. As a consequence, concentration on the intensive margin increases. Note that the model characterizes import concentration on all margins.
To calibrate the model, I followWaugh[2010] and use data and the structure
of the model to infer trade costs, technology and the elasticity of substitution. Not surprisingly, the simulated results show that the model produces the observed specialization pattern qualitatively with countries being specialized in exports and diversified in imports on all margins. More importantly, the simulated model also reproduces the degree of concentration on the extensive versus the intensive margin for both, exports and imports. However, the obtained levels for exports are too high in comparison to the data. Focusing on the variation across countries, the simulated model replicates the fact that larger economies are more diversified in exports but fails to account for the observed cross-country pattern of imports.
This paper contributes to the international trade literature that analyses the relationship between the pattern of trade and specialization in commodities.
Leamer [1984], who tested whether the structure of trade can be explained
by the availability of resources, started an empirical literature on specializa-tion by relating the pattern of trade to factor endowments motivated by the
Hechscker-Ohlin theorem, see, for example,Bowen et al.[1987],Trefler[1995]
and Schott [2003]. On the other hand, MacDougall [1951], Balassa [1963],
Golub and Hsieh [2000] and Costinot et al. [2012] use trade data to test the
Ricardian prediction that countries export relatively more of the commodi-ties they are relatively more productive in. Unlike these papers, my analysis does not intend to explain why countries specialize in a certain commodity or group of commodities. Instead, it uses the level of concentration in trade data to shed light on the factors that drive specialization in the number and the volume of goods traded. The levels of concentration in each trade direc-tion contain informadirec-tion on the pattern of trade and as such they provide a new quantitative test of the extent of specialization observed in the data. The analysis presented in this paper is also related to a growing literature in quantifying the importance of Ricardian comparative advantage in ex-plaining trade patterns using the Eaton-Kortum framework, see, for
exam-ple, Chor [2010], Shikher [2011], Levchenko and Zhang [2011] and Costinot
et al.[2012]. These papers specify a multi-sector Ricardian model with both
inter- and intra-industry trade in order to derive implications on the sectorial level. In contrast, I abstract from intra-industry trade and attach a sectoral interpretation to the continuum of traded goods within the standard Eaton-Kortum framework. Given this notion, the number of traded sectors arises endogenously and is not assumed to be fixed as in the previous papers. While the standard model has been primarily used to explain bilateral trade flows
and trade volume, (see, for example, Eaton and Kortum[2002], Alvarez and
Lucas [2007] and Waugh [2010]), I focus on the implications on the pattern
of trade and analyze how geography, tastes and absolute and comparative advantage induce countries to specialize in narrow sectors. In particular, I characterize the models predictions on export and import concentration on the intensive and extensive product margin and highlight the implications on the specialization pattern.
At this point, it is important to note that the Ricardian model shares with other models of international trade, most notably monopolistic competition
models based on Krugman [1980] and Armington models likeAnderson and
Van Wincoop [2003], the ability to develop quantitative predictions about
specialization patterns on the intensive and extensive product margin. How-ever, the underlying mechanisms of generating the specialization pattern dif-fer. In monopolistic competition and Armington models, tradable goods are differentiated by location of production since each country is the sole pro-ducer of a good. Thus, countries specialize completely and import all other
goods. In the Ricardian model of Eaton and Kortum [2002] each
homoge-neous good is produced by more than one country and producers directly compete with imports for the lowest price. Because multiple countries ex-port and produce the same goods, the Eaton and Kortum model generates incomplete specialization.
Finally, my investigation adds to the empirical growth literature that ana-lyzes the relationship between income and trade patterns on the intensive
and extensive product margins, see Hummels and Klenow [2005] and Cadot
et al. [2011]. Like the previous papers, I study cross-country differences by
decomposing the trade pattern into extensive and intensive margins. Simi-lar to their analysis I quantify the contribution of each export margin and relate the outcome to income differences across countries. In addition, I ap-ply the decomposition to imports and use the resulting empirical evidence to test the ability of the Eaton-Kortum model to explain the relationship of income differences and the concentration of exports and imports along both
margins. While Hummels and Klenow [2005] stress that models with
Krug-man firm-level product differentiation can explain why larger economies ex-port a larger number of goods, my analysis shows that the Ricardian model of Eaton-Kortum based on constant returns to scale offers an alternative framework to describe the observed patterns. The novel approach of link-ing cross-country variation of export and import concentration to test the Eaton-Kortum model sheds light on how the interaction between preferences, technology and geography establishes trade patterns on the intensive and ex-tensive product margin. As such, the Eaton-Kortum framework can provide theoretical guidance for future work.
The rest of the paper is organized as follows. Section 2 describes the data and presents the empirical evidence of import and export concentration. Section 3 lays out the theoretical framework. Section 4 describes the calibration that allows the model to replicate the empirical facts. Section 5 estimates trade
costs and presents the simulation results based on the estimated trade costs. Section 6 discusses the robustness of the results while section 7 concludes.
1.2 Empirical evidence and data
The starting point of my analysis is an empirical assessment of the observed specialization patterns in world trade using detailed product level trade data. Before describing the data and the empirical evidence, we examine the prop-erties of the concentration measurements used, which form the basis of the qualitative and quantitative tests of the model.
1.2.1 Concentration measurements
I compute two measures of specialization for product level sales, the Gini coefficient and the Theil index. The Theil index has the advantage of being decomposable into an extensive and intensive product margin measure. For concreteness, I focus on exports - concentration measures for imports are entirely analogous. The two measurements are defined as follows. Let k index a product among the N products in operation in the world economy,
let Rk be the corresponding export sales revenue, say, in a given country.
The export Gini in this country is defined as :
G = 2 N (PNk=1kRk) PN k=1Rk N + 1 N (1.1)
where export revenues of product k, Rk, are indexed in increasing order, i.e.
Rk< Rk+1, and N denotes the total number of products in the world. A Gini
coefficient of zero expresses complete diversification across trade revenues, i.e. (1) a country exports all products and (2) the revenues are the same across them. An index of one expresses complete specialization in which case export revenues stem from one product only. Alternatively, the Theil index
is a weighted average of the log difference from the mean export revenue ( ¯R)
and defined by the following formula
T = 1 N X k2N Rk ¯ R ln ✓ Rk ¯ R ◆ (1.2)
The index takes the value of zero in the case of complete diversification and
ln(N ) in the case of complete specialization. Cadot et al. [2011]
decom-pose the Theil index into a measure for the intensive and extensive product
margin, T = Text+ Tint. The extensive Theil index (Text) captures the
con-centration in the number of products (extensive product margin) whereas
the intensive Theil (Tint) measures the concentration in the sales volume of
products (intensive product margin). The intensive Theil index is given by:
Tint = 1 Nx X k2Nx Rk ¯ Rx ln ✓ Rk ¯ Rx ◆ (1.3) and the extensive Theil index is
Text = ln ✓ N Nx ◆ (1.4)
Nx denotes the number of exported products and ¯Rx represents the mean
value of exported products.
1.2.2 Data
To build my empirical evidence, I use the Comtrade data set collected by the United Nations and choose the 6 digit HS 1992 product classification
scheme as the preferred level of disaggregation. I followHummels and Klenow
[2005] and refer to import flows of the same 6-digit product from different trading partners to different varieties of the same product. I assume that the tradable goods sector corresponds to manufactures defined to be the
aggregate across all 34 BEA manufacturing industries, see Feenstra et al.
[1997].1 Using a correspondence table provided by Feenstra et al. [1997], I
identify 4529 tradable manufacturing products. The baseline sample covers 160 countries representing all regions and all levels of development between 1992 and 2009 (18 years). It includes 129 developing countries, defined by the World Bank as countries with per capita GDP under $16,000 in constant 2005 PPP international dollars. In total, the sample consists of 2880 observations (country-years).
1. This is a simplification, but it is reasonable as a first-order approximation because, for all countries in the sample, this represents on average 76 percent of all merchandise imports; the median is 91 percent.
Note the data contains import and export flows within 6 digit product cat-egories. The model I am testing is Ricardian and does not feature trade between varieties of the same product. To establish a mapping between the model and the data, I net out the within product component by considering
net trade flows instead of gross trade flows.2 To measure the importance
of trade between products and trade between varieties, I follow Grubel and
Lloyd [1975] and calculate the percentage share of trade between products
with respect to total trade. I find an average value of 81 percent across coun-tries. The overall share of total net trades flows with respect to total gross trade flows is 65 percent. Both findings suggest that the majority of trade
flows between countries in this sample is across products.3
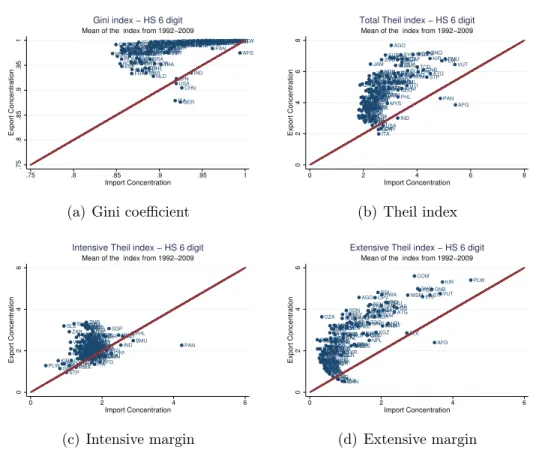
Based on net trade flows at the product level, I first calculate the corre-sponding concentration indexes on all margins for each year and then take the average over the whole sample period. Because the concentration indices employed are independent of scale, the calculation on a year-to-year basis avoids the need to deflate the data. Figure 1.1 plots the mean export against the mean import concentration for each country together with the 45 degree line. In terms of overall concentration, Figures 1.1(a) and 1.1(b), the vast majority of observed levels lie above the 45 degree line highlighting the fact that exports are more concentrated than imports for almost all countries. On the intensive product margin, Figure 1.1(c), the specialization level of exports is similar to imports with slightly higher levels of concentration for exports. Figure 1.1(d) plots the results for the extensive product margin with countries exporting fewer products than they import.
Table 1.1 summarizes the sample statistics with the average year-by-year in-dices over the 2880 country-year pairs. As implied by Figure 1.1, exports are more concentrated than imports on all margins. With respect to overall 2. I compute total net exports at the 6 digit product level and consider a country as an exporter of that product if net exports are positive and an importer otherwise.
3. In the appendix I present an alternative approach to account for observed intra-industry trade in the data. The basic idea is to develop a measurement device that enables the model to characterize trade within and across products. The suggested procedure converts the product units in the model to product units in the data and allows examining specialization patterns based on gross trade flows. In the rest of the paper, I follow the net trade flow approach. I present the estimation and results of the alternative procedure in the appendix.
Table 1.1 – Mean concentration indexes over 2880 country-year pairs
Gini Theil Exports (X) Theil Imports (M)
Exp Imp Mar. Mar.Ext. Int. Total Mar. Mar.Ext. Int. Total
Level of 0.98 0.91 2.60 2.13 4.73 1.10 1.61 2.71
concentration
% share of overall 55% 45% 40% 60%
concentration
concentration, the summary statistics reveal high levels of export and import concentration with a Gini coefficient of 0.98 for exports and 0.91 for imports. In the case of exports, the high level of concentration is due to the fact that countries export few products and hence specialization is primarily driven by the extensive margin. For imports, the decomposition favors an alternative explanation. Countries import a fairly wide range of products but concen-trate their trade in the value of few products. The share of the intensive margin with respect to overall concentration is 60 percent. Focusing on the gap between export and import concentration, Table 1.1 shows that differ-ences between exports and imports are mainly explained by the extensive margin with a Theil of 2.60 for exports versus 1.10 for imports. The Theil of 1.10 on the extensive margin implies that, on average, a country net imports a 33.3 percent of all products. On the other hand, the extensive Theil of 2.60 indicates that a country net exports 7.4 percent of the product space. In terms of the intensive margin, a country receives roughly 50% of its export revenues from 1% of the products it exports and spends 50% of its import expenditure on 2% of the products it imports. Overall, these results are con-sistent with the idea that openness to trade spurs countries to specialize in few exporting sectors and diversify the importing sectors.
Turning to cross country differences, the empirical evidence shows that larger economies diversify more than smaller economies. Figure 1.2 plots the log of the mean levels of concentration as a function of market size including the best linear fit for all margins. Market size is measured by the log of the average relative GDP to the United States (USA = 0) over the periods 1992 to 2009. As Figures 1.2(a) and 1.2(b) show, the overall Theil index
de-creases with respect to relative GDP, i.e. smaller economies specialize more. This relationship is more pronounced for exports than for imports with an R square of 0.58 compared to 0.41. The decomposition reveals that specializa-tion on the intensive margin does not vary with market size for both, exports (Figures 1.2(e)) and imports (1.2(f)). The main driver of specialization dif-ferences across countries is the extensive margin. Particularly robust is the linear relationship on the extensive margin for exports with an R square of 0.75. Bigger economies are more diversified because they export more
prod-ucts, which is consistent with Koren and Tenreyro [2007]’s observation that
larger economies are more diversified because they produce and export more products. The relationship between market size and specialization on the extensive margin of imports follows a L shape pattern. As the size of an economy increases, countries diversify on imports until reaching a certain market size after which concentration is roughly equal across countries. At this point, the key qualitative and quantitative facts have been estab-lished. First, exports are more specialized than imports on all margins. Sec-ond, the extensive margin drives concentration of exports and the intensive margin for imports. Third, the target levels of concentration are displayed in Table 1.1. Fourth, the cross-country patterns imply a negative relationship between market size and specialization caused by the extensive margin, i.e. larger economies export and import more products. The rest of the paper evaluates the Ricardian model’s ability to account for these stylized facts.
Next, I present the relevant parts of the Alvarez and Lucas [2007] extension
of the Eaton-Kortum framework.
1.3 Model
The Eaton–Kortum model is Ricardian, with a continuum of goods produced
under a constant-returns technology. In this paper, we focus on the Alvarez
and Lucas [2007] model, which builds on the Eaton Kortum framework. I
derive the relevant theoretical predictions on the pattern of trade and evalu-ate the importance of the key model parameters for specialization of imports and exports.
Consider a world economy with I countries, where each country produces tradable intermediate goods as well as non-tradable composite and final
goods. Following Alvarez and Lucas[2007], define x = (x1, ..., xI)as a vector of technology draws for any given tradable good and refer to it as “good x”
with x 2 RI
+. The production of an intermediate good in country i is defined
by:
qi(xi) = xi ✓si(xi) qmi(xi)1 .
Technology xi differs between goods and is drawn independently from a
com-mon exponential distribution with density and a country specific
technol-ogy parameter i, i.e. xi ⇠ exp(1/ i). Denote the wage by wi and the price
of the intermediate aggregate good by pm,i. The intermediate good sector
is perfectly competitive. Intermediate good producers minimize input costs and sell the tradable intermediate good at price
pi(xi) = Bx✓iwip 1
mi .
where B = (1 ) (1 ). The continuum of intermediate input goods x
enters the production of the composite good qisymmetrically with a constant
elasticity of substitution (⌘ > 0) qi = ˆ 1 0 q(x)1 1/⌘ (x)dx ⌘/(1 ⌘) .
The produced aggregate intermediate good qi can then be allocated costless
towards the production of final goods or being used as an input in the pro-duction of intermediate goods. Similarly, labor, as the only primary factor input, can be used either to produce intermediate or final goods. Finally, consumers draw their utility linearly from the final good. All markets are perfectly competitive. Since these features are not central to the implica-tions I derived in this paper, I omit them. The interested reader is refereed
to Alvarez and Lucas[2007] for the full description of the model.
1.3.1 General equilibrium
Once a country opens to international goods markets, the intermediate goods are the only goods traded. Final goods are not traded and labor is immobile between countries. Due to trade costs, factor prices do not equalize across countries. The intermediate goods needed to produce the composite good are acquired from the producer of good x in the country that operates at lowest unit costs.
Trading intermediate goods between countries is costly. We define “Iceberg”
transportation costs for good x from country i to country j by ij where
ij < 1 8 i 6= j and ii = 1 8i. As in Alvarez and Lucas [2007], we also
consider tariffs. !ij is the tariff charged by country i on goods imported from
country j. Tariffs distort international trade but do not entail a physical loss of resources. Incorporating the trade costs, composite good producers in country i will buy the intermediate good x from country j that offers the lowest price pi(x) = B min j " wjp1mj ij!ij x✓j # . (1.5)
Equation 1.5 shows that whether country i specializes in the production of good x depends on the productivity realizations, factor prices and trade costs. If country i does not offer a good at lowest costs in the local market, the good is imported. Following Alvarez and Lucas, the resulting price index of tradable goods in country i is
pmi = (AB) 0 @ I X j=1 wjp1mj ij!ij ! 1/✓ j 1 A ✓ (1.6)
where A = (1 + ✓(⌘ 1)) is the Gamma function evaluated at point (1 +
✓(⌘ 1)). Next, we calculate the expenditure shares for each country i. Let
Dij be the fraction of country i’s per capita spending pmiqi on tradables that
is spent on goods from country j. Then, we can write total spending of i on goods from j as
pmiqiDij = ˆ
Bij
pi(x)qi(x) (x)dx
where Bij defines the set of goods country j attains a minimum in equation
1.5. Note that Dij is simply the probability that country j is selling good x
in country i at the lowest price and calculated to be
Dij = (AB) 1/✓
wjp1mj pmiij!ij
! 1/✓
j. (1.7)
Equation 1.7 shows that in this model the sensitivity of trade between coun-tries i and j depends on the level of technology , trade costs !, geographic
barriers and the technological parameter ✓ (reflecting the heterogeneity of goods in production) and is independent of the elasticity of substitution ⌘. This result is due to the assumption that ⌘ is common across countries and does not distort relative good prices across countries. Note also that by the law of large numbers, the probability that country i imports from country
j is identical to the share of goods country i imports from j. In this sense,
trade shares respond to costs and geographic barriers at the extensive mar-gin: As a source becomes more expensive or remote it exports/imports a narrower range of goods. It is important to keep in mind that the number of intermediate input industries that enter the production of the composite good is fixed. Each country uses the whole continuum of intermediate goods to produce composite goods. There are no gains of trade due to an increased number of varieties. Welfare gains are realized through incomplete special-ization. Domestic production competes with imports and countries specialize through the reallocation of resources made available by the exit of inefficient domestic producers.
Finally, to close the model, we impose that total payments to foreigners (imports) are equal to total receipts from foreigners (exports) for all countries i Lipmiqi I X j=1 Dij!ij = I X j=1 LjpmjqjDji!ji (1.8)
The previous equation implies an excess demand system which depends only on wages. Solving this system, describes the equilibrium wage for each coun-try together with the corresponding equilibrium prices and quantities. Next, I describe the predictions on export and import concentration on both mar-gins.
1.3.2 Concentration of exports and imports
In the model, the pattern of trade is established by domestic producers com-peting with importers for selling intermediate goods in the local market. If foreign producers sell a particular good at a lower price than domestic pro-ducers, the good will be imported from the cheapest source. Given the equi-librium price, p(x), and quantity, q(x), the total expenditure that country i
RiM(x) = Lipi(x)qi(x) x /2 Bii
where Bii ⇢ RI+ is the set of goods where country i obtains the minimum
price at home. Equivalently, domestic producers export their good to all foreign markets where they offer the minimum price. The set of exporting goods is simply a collection of the set of goods country i exports to any
destination j, x 2 [I
j6=iBji. As a result, (f.o.b.) export revenue sales of good
x, Ri,X(x), are given by:
RiX(x) =
I X
k6=i
Lkpk(x)qk(x)ki!ki x2 [Ij6=iBji
Given the described pattern of trade, the concentration index for imports is identified. To show this, I decompose the overall concentration into a concentration measure for the intensive and extensive product margin. Using equation 1.3, the Theil index for the concentration of imports on the intensive production margin can be written as:
TiMint= ˆ x /2Bii RiM(x) ¯ RiM ln ✓ RiM(x) ¯ RiM ◆ (x)dx
In the appendix I show that the distribution of import expenditures follows a Fréchet distribution with shape parameter 1/✓(⌘ 1) and scale parameter
si. Solving the integral, the intensive Theil index of imports for country i
becomes:
TiMint = ln ( (1 + ✓(1 ⌘)))
ˆ 1
0
ln u( ✓(1 ⌘)) e udu (1.9)
where (.) stands for the Gamma function. Import specialization on the intensive margin is independent of equilibrium prices, trade costs, geogra-phy and the level of technology . It is solely determined by preferences (i.e the elasticities of substitution) and heterogeneity in production (i.e. the degree of comparative advantage). A higher elasticity of substitution (⌘) increases specialization by allowing producers in the composite intermediate good sector to better substitute cheap for expensive products and concen-trate expenditure towards these sectors. Similar, an increase in the degree of comparative advantage (✓), which corresponds to a higher variance of pro-ductivity realizations and therefore an increase in unit price differences across goods, heightens the degree of concentration.
To compute the concentration of imports on the extensive margin, note that the set of goods produced is disjoint form the set of goods imported. Con-sequently, we can express the share of goods imported as 1 minus the share
of goods produced, (1 Dii). The Theil index for the extensive margin of
imports is equal to : TiMext = ln ✓ N NiM ◆ = ln(1 Dii) (1.10) where Dii = (AB) 1/✓ ✓ wi pmi ◆ /✓ i
and depends on the level of technology and equilibrium prices.
To assess the level of specialization in exports, I simulate the model within a discrete product space in the following section. I then calculate the export concentration index on the intensive margin according to equation 1.3. The extensive Theil index on the extensive margin is given by the inverse share
of the number of goods exported, NiX, with respect to the total number of
simulated goods, N. TiXext= ln ✓ N NiX ◆
Having outlined the pattern of trade and the corresponding implications on the specialization pattern of exports and imports, the next section discusses the simulation of the model. It contains special cases of equilibria designed to spell out step-by-step the main implications of the model on export and import concentration and in further instance on specialization.
1.4 Calibration and simulation
To simulate the theoretical model, which assumes an infinite amount of goods, I "discretize" the Fréchet distribution of total factor productivity and calculate the respective trade value for each product x. Concerning the
Lucas [2007]. I assume a variance of individual productivities ✓ = 0.12, an elasticity of substitution of intermediate goods ⌘ = 2, an efficient labor share in the production of non-tradable final goods ↵ = 0.75 and an efficient labor share in the tradable goods sector of = 0.5. The simulation contains a to-tal of I = 160 countries. In the following subsections, I analyze import and export concentration in special cases of the equilibrium by assuming differ-ent trading schemes. Doing so builds intuition of how taste, technology and geography determine specialization. To illustrate the impact of each factor separately, it is instructive to start the analysis by assuming symmetric coun-tries and introduce heterogeneity across councoun-tries later on. Finally, I show that for a particular configuration of trade costs the Eaton-Kortum model is able to replicate the specialization patterns observed in the data.
1.4.1 Symmetric countries
All countries are identical with respect to their size Li = Land technology
parameter i = . Trade costs are symmetric and set to ij = 8 i 6= j with
ii = 1and !ij = 18i, j. I solve for the equilibrium wage in each country, all
goods prices and the value of imports and exports. Due to symmetry, wages and composite good prices equalize across countries. Trade costs distort international trade. In comparison to free trade, firms will not be able to buy good x from the cheapest producer world wide and rely more on home production. The corresponding trade share matrix D is symmetric and the
(i, j) element is given by:
Di,j =
()1/✓
1 + (I 1)()1/✓ 8i 6= j and Di,i=
1
1 + (I 1)()1/✓
where Dij is the set of goods country j exports to country i and Dii the set
of goods country i produces at home. In free trade, = 1, each country’s intermediate good producers specialize in a distinct set of goods equal to
the relative size of the economy and export all products produced, Dii =
Dij = 1/I. The corresponding share of imported products is 1 Dii =
(I 1)/I. Hence, the more countries participate in international trade, the
more countries specialize in exports and diversify in imports. In this case, Ricardian specialization forces are strongest and the gap between export and import concentration reaches a maximum.
Concentration on the Extensive Margin Including trade costs the con-centration index of imports equals the share of goods country i imports from all countries in the world and is given by:
TiMext= ln((1 Dii)) = ln(1 + (I 1)()1/✓) ln((I 1)()1/✓)
Concentration at the extensive margin of imports increases with trade barri-ers and decreases with the number of trading partnbarri-ers I 1 and the degree of comparative advantage ✓. Regarding exports, the extensive Theil index is given by the number of products exported to any destination divided by the total number of products in the world. Note that the randomness of the pro-ductivity distribution implies that in this model there is no fixed hierarchy
of export destinations as inMelitz[2003], i.e. goods that are exported to the
k + 1 “most popular” destinations are not necessarily exported to the k most
popular destinations.4 To count the number of products exported, define
the set of products exported as the union of the set of products exported
to each destination, Uex = [Ij6=iBji. Because the set of products exported
to destination j overlaps with the set of products exported to destination
k, Bji\ Bki 6= ;, I apply the Inclusion Exclusion principle to avoid double
counting. As I show in the appendix, under the assumption of symmetry, the extensive Theil index of exports is given by:
TiXext= ln I 1 X k=1 ( 1)k 1 ✓ I k ◆ ak !
where the share of products exported to k destinations, ak, is given by:
ak =
()1/✓
k + (I k)()1/✓
The concentration of exports at the extensive margin increases with geo-graphical barriers, the degree of comparative advantage and the number of trading partners. In general, a larger number of trading partners increases competition between production and imports in the domestic market result-ing in the production of fewer goods at home and an increase in the number
4. In the basic version of theMelitz[2003] model, exported goods obey a hierarchy, see
Eaton et al. [2011]. Any good sold to the k + 1st most popular destination is necessarily
sold to the kth most popular destination as well. In that model the total number of exported goods would simply be all the products exported to the most popular destination, i.e. the destination with the lowest trade costs.
of goods imported. Also, more trading partners increase competition among exporters in foreign markets forcing countries to specialize more on the ex-tensive margin of exports. Impediments to trade, i.e. a reduction in , and a higher degree of comparative advantage, ✓, reduce import competition and, as a result, fewer goods are exported and imported. Notice that in the spe-cial case of free trade all goods produced are exported and concentration of production equals concentration of exports. With trade costs, countries export a subset of produced goods leading to more concentration of exports relative to production.
Concentration on the Intensive Margin As noted previously the
dis-tribution of import expenditure follows a Fréchet disdis-tribution where the con-centration indexes depend on the elasticity of substitution (⌘) and the degree of comparative advantage (✓). Consequently, given ✓ and the concentration of imports observed in the data, I can pin down the elasticity of substitution. Concerning the distribution of export revenues across products, the simula-tion shows that it depends positively on the elasticity of substitusimula-tion (⌘), the degree of comparative advantage (✓) and geographical barriers (). The number of trading partners has non-monotone effects on the concentration of exports at the intensive margin. Few trading partners increase concentration because high revenue generating exports sell in more markets. However, as the number of trading partners increases, the degree of competition in the export markets also increases and low revenue generating products do not sell in foreign markets anymore. Thus, after a threshold level, concentration among export revenues reduces with the number of trading partners. In the case of free trade, countries export all their goods to all destinations and, given that preferences are identical, export and import concentration on the
intensive margin equalize.5
5. The intuition behind this result is that preferences are such that the import ex-penditure distribution is the same for each trading partner. In the appendix, I show in
detail that the expenditure distribution of bilateral trade, Eij(x), between importer i and
exporter j is the same for each source country j, i.e. Eij(x) = Ei(x), 8j 2 I.
Further-more, the bilateral import expenditure distribution, Ei(x), is Fréchet with common shape
parameter 1/(✓(⌘ 1)) and country specific scale parameter si. The shape parameters are
identical because preferences are common across countries. Note that the bilateral import expenditure distribution of country i, equals the export revenue distribution of country j. In free trade, the exporting country ships the exact same goods to all countries. As a consequence, overall export revenue distribution of country j is equal to the import expen-diture distribution of each country scaled up by the number of trading partners. Since the
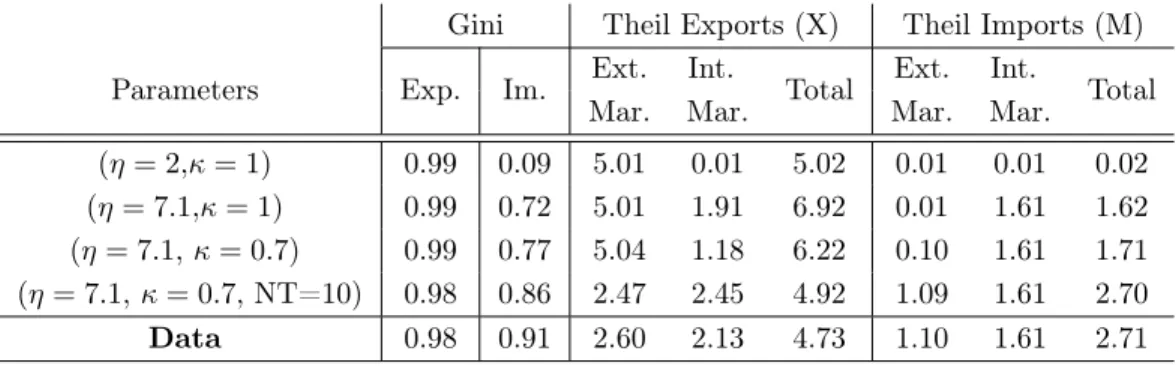
Table 1.2 – Simulated export and import concentration indexes for benchmark parameters.
Gini Theil Exports (X) Theil Imports (M)
Parameters Exp. Im. Ext. Int. Total Ext. Int. Total
Mar. Mar. Mar. Mar.
(⌘ = 2, = 1) 0.99 0.09 5.01 0.01 5.02 0.01 0.01 0.02
(⌘ = 7.1, = 1) 0.99 0.72 5.01 1.91 6.92 0.01 1.61 1.62
(⌘ = 7.1, = 0.7) 0.99 0.77 5.04 1.18 6.22 0.10 1.61 1.71
(⌘ = 7.1, = 0.7, NT=10) 0.98 0.86 2.47 2.45 4.92 1.09 1.61 2.70
Data 0.98 0.91 2.60 2.13 4.73 1.10 1.61 2.71
The results presented in Table 1.2 show that the free trade calibration of
Al-varez and Lucas [2007] is able to replicate the qualitative fact that, overall,
exports are more concentrated than imports. While the simulated overall level of export concentration attains the degree of specialization observed in the data, in the benchmark free trade parametrization countries diversify ex-cessively in imports. Focusing on the decomposition reveals the underlying reason: countries import too many goods and the value of those goods is too evenly distributed. Using the fact that for a given value of ✓, import concentration on the intensive margin can be determined by the elasticity of
substitution, I calibrate ⌘ = 7.1 to match the level observed in the data6.
As row 2 of Table 1.2 shows, this allows composite good producers to better substitute between intermediate inputs and alters the level of import con-centration.
To reduce the gap between export and import concentration caused by the
extensive product margin, I followAlvarez and Lucas[2007] and introduce 42
percent symmetric trade costs to all trading partners, = 0.7. Row 3 of Table 1.2 shows the results. Impediments to trade reduce the number of products exported and imported and concentration on the extensive margin increases concentration indexes are independent of scale, the concentration of exports and imports on the intensive margin equalize.
6. This value is consistent with previous ones found in the literature, see Broda and
for both. Note that higher trade costs lower the level of concentration on the intensive margin of exports. Due to the increase in trade costs, only efficient producers remain exporters allowing them to distribute their export revenues more evenly across products and trade partners. Although the gap between export and import concentration narrows slightly, the difference is still substantial. The reason for this is that the degree of competition countries face in export and domestic markets is too high. Creating trading blocks by introducing infinite trade costs with countries outside of the block limits the number of trading partners (NT ) and reduces competition in all markets. The fit of the model improves on all dimensions, fourth row of Table 1.2. Less competition in the domestic market increases the survival rate of domestic producers and reduces the amount of goods imported. Infinite trade costs reduce the number of countries competing in a particular market and increases the probability to export to any of them. As a result, the gap between export and import concentration diminishes. Note that revenues of exporting industries are now geographically more concentrated and hence specialization on the intensive margin of exports intensifies.
In sum, with the introduction of symmetric trade costs, the model can repli-cate the mean levels of concentration observed in the data. The key param-eters are the elasticities of substitution ⌘ and the trade cost function . In particular, by creating trade blocks, which amounts to introduce zeros in the bilateral trade matrix, we can calibrate the model to explain the pattern of specialization at the mean.
1.4.2 Asymmetric countries
In this section I analyze the effects of cross-country heterogeneity on special-ization. The empirical facts imply a negative relationship between specializa-tion and market size. For this reason, I introduce heterogeneity in technology
i and size Li to reflect the observed GDP differences in the data. To start
with, consider the model’s free trade equilibrium relationship between wages, size and technology:
wi = ✓ i Li ◆✓/( +✓) (1.11)