HAL Id: hal-00949941
https://hal.archives-ouvertes.fr/hal-00949941
Submitted on 20 Feb 2014
HAL is a multi-disciplinary open access
archive for the deposit and dissemination of
sci-entific research documents, whether they are
pub-lished or not. The documents may come from
teaching and research institutions in France or
abroad, or from public or private research centers.
L’archive ouverte pluridisciplinaire HAL, est
destinée au dépôt et à la diffusion de documents
scientifiques de niveau recherche, publiés ou non,
émanant des établissements d’enseignement et de
recherche français ou étrangers, des laboratoires
publics ou privés.
Freely Available Large-scale Video Quality Assessment
Database in Full-HD Resolution with H.264 Coding
Mikolaj Leszczuk, Lucjan Janowski, Marcus Barkowsky
To cite this version:
Mikolaj Leszczuk, Lucjan Janowski, Marcus Barkowsky. Freely Available Large-scale Video Quality
Assessment Database in Full-HD Resolution with H.264 Coding. IEEE Globecom 2013, Dec 2013,
Atlanta, United States. pp.1-6. �hal-00949941�
Freely Available Large-scale Video Quality
Assessment Database in Full-HD Resolution with
H.264 Coding
Mikołaj Leszczuk
and Lucjan Janowski
AGH University of Science and Technology 30 Mickiewicza Av.,
PL-30059 Krakow
Marcus Barkowsky
LUNAM Universit´e, Universit´e de Nantes IRCCyN UMR CNRS 6597, Polytech Nantes
Rue Christian Pauc BP 50609, F-44306 Nantes Cedex 3
Abstract—Video databases often focus on a particular use case with a limited set of sequences. In this paper, a different type of database creation is proposed: an exhaustive number of test conditions will be continuously created and made freely available for objective and subjective evaluation. At the moment, the database comprises more than ten thousand JM/x264-encoded video sequences. An extensive study of the possible encoding parameter space led to a first subset selection of 1296 configura-tions. At the moment, only ten source sequences have been used, but extension to more than one hundred sequences is planned. Some Full-Reference (FR) and No-Reference (NR) metrics were selected and calculated. The resulting data will be freely available to the research community and possible exploitation areas are suggested.
Index Terms—HDTV, free content database, objective evalua-tion, video quality, video coding impairments
I. INTRODUCTION
Video databases often focus on a particular use case. Databases exist that focus, for example, on the evaluation of coding degradations [1], or transmission degradations [2], [3]. There are also other video quality assessment databases, like the EPFL-PoliMI [4], [5] video quality assessment database, the LIVE Video Quality Database [6], [7], the TUM Datasets [8] etc. All these databases have been carefully designed and evaluated using subjective assessment tasks, and are there-fore particularly valuable for training objective video quality prediction algorithms or assessing the performance of such a model. Their drawback is that they are small compared to the application area or measurement scope of such algo-rithms, which will be used for a large variety of different consumer content and which will need to evaluate coding and transmission conditions well outside the design scope of these small databases. These databases are also usually missing several compression parameters for video sequences that are not fully supported by non-reference implementations of the compression standards, notably bit-stream analysers and commercial or free video decoders.
Therefore, in this paper a different type of database creation is proposed: an exhaustive number of test conditions will be created and made available for objective and subjective
evalu-ation. At the moment, the proposed Joint Effort Group (JEG) database contains 12,960 encoded video sequences, although so far only coding impairments have been considered and only ten source sequences have been used. It is obvious that such a large number of data-points can no longer be analysed by subjective assessment alone. Reliable objective measurement methods need to be combined to estimate the quality of the largest part of the database. This partly inverts the usual stepwise approach of algorithm development, training, and verification. It poses new challenges, such as estimating the reliability of scores obtained from several models and the possibility to perform algorithms’ scope determination based on their congruence with other models. Subjective assessment cannot be completely replaced, but may be reduced to cases in which models produce particular outlier cases. This also leads to establishing a comparably low-cost knowledge base of challenging content and challenging degradations for objective model developers.
This paper describes in detail the process of preparing the test video sequences. The processing method and the chosen parameters will be presented ranging from the preparation of the source sequence to the calculation of several No-Reference and Full-Reference video quality measurement algorithms.
The paper first discusses the general structure of such a database in Section II, and documents the above-mentioned first existing and freely available version in Section III. Several simple Full-Reference (FR) and No-Reference (NR) video quality measurement algorithms have already been evaluated on the database, as presented in Section IV and Section V respectively. Results of correlation analysis of FR metrics will be rapidly presented in Section VI. Possible application areas of this database are then discussed in Section VII.
II. STRUCTURING A LARGE SCALE MODULAR VIDEO DEGRADATIONS DATABASE
It is well known that structuring the contents of a large scale database is crucial to its usage. The current database uses a modular naming approach for the file names which may be extended later if need be. Following a typical transmission
chain, video content (‘source,’ or ‘SRC’ for short) needs to be encoded using a video encoder, which may or may not contain preprocessing steps such as down-sampling. During the transmission of the bit-stream to the sender, information may be lost, further degrading the video sequence, and then specific decoding and possibly post-processing is required, leading to another class of separate conditions. Finally, during the decoding, different error concealment strategies may be used, which leads to differences between the decoded video and the transmitted bit-stream. These conditions are then globally tabulated in a community accessible document, using, for example, one letter and six digits for specifying the corre-sponding content, followed by a predefined nomenclature of the corresponding condition, allowing for bijective references. In the SRC the letter refers to the type of content: “profes-sional”, “synthetic”, “user created”. For coding, it refers to the video coding standard, i.e. “H.264”, “H.265”, and for trans-mission it refers to the class of transtrans-mission system: “packet based”. Complex configurations need to be maintained, in particular for the coding conditions, including guidelines to store information about the encoder and its version as well as its execution environment. Virtual machines have proved to be advantageous for preserving exact conditions. Storing the configuration files, file digests and file revision information is considered mandatory.
III. THEJEG DATABASE
This section describes the JEG database. First, the selection of SRC is briefly introduced (Subsection III-A). The creation of Hypothetical Reference Circuits (HRCs) will be then de-scribed in detail (Subsection III-B).
A. Source Reference Circuits (SRC)
The current SRC database of JEG comprises about 200 video sequences from which 10 source video sequences (see Fig. 1) have been selected by experts from the Video Quality Experts Group (VQEG) [9] to serve as a critical minimum dataset. The selection criterion was to establish a database covering as many different features as possible. In particular, synthetic sequences, professionally shot natural content, and user generated content sequences have been chosen. The amount of motion, scene cuts, brightness, high frequency details, etc. has been analysed and equalized. All selected sequences are in progressive format at Full-HD 1920 × 1080 pixels resolution at 25 frames per second. These sequences have been also evaluated on a small set of video conditions in a subjective experiment [10].
B. Hypothetical Reference Circuits (HRC)
This section describes the creation of HRCs. Phases of pre-processing, including resolution change (Subsection III-B1), compression (Subsection III-B2) and post-processing (Subsec-tion III-B3) are detailed.
1) Pre-Processing: SRC have been preprocessed. The pro-cess is aimed at the conversion of both a video format and a spatial/temporal resolution. The source video is distributed in AVI file format using YCbCr colour space with 422 colour sub-sampling. For encoding, the colour space needs to be further sub-sampled in order to obtain the 420 input format. For this step, the ImageMagick tool has been used. The ImageMagick tool uses a Lanczos sub-sampling filter for this operation.
2) HRC Generation: The multidimensional coding param-eter space was divided into four categories that cover most of the important parameters in terms of video compression (see Table I). Each group of parameters intend to cover extensively the presented parameters. Nevertheless, the full matrix approach was not used since the some combinations are not so commonly used, and the matrix had to be limited. It should be noted that additional conditions need to be evaluated when analysing and optimizing transmission over error-prone networks.
3) Post-Processing: The ITU reference implementation for H.264 (JM version 18.3) [11] features compression parameters for video sequences that are not fully supported by other implementations of the standards, notably bit-stream analy-sers and commercial or free video decoders. Therefore, the decoding of JM-encoded sequences was performed with the reference (JM) implementation as well and the resulting video sequence was transformed into an uncompressed AVI file in order to simplify further analysis of the video quality. Care was taken to avoid unnecessary conversion steps in order that the quality of the sequences could be analysed by calculating objective video quality measurements. As a second encoder implementation, x264 version 0.107.x was chosen. Its output was stored in AVI container format directly in order to reduce file size for downloading the database. Decoding of these videos is believed to provide reliable results by using the
libavcodec version 52.72.2codec library.
IV. FULL-REFERENCE(FR) METRICSEVALUATION
Several simple Full-Reference (FR) video quality measure-ment algorithms have already been evaluated on the database, as presented in Subsection IV-A (Peak Signal-to-Noise Ratio – PSNR), Subsection IV-B (Structural Similarity Index Metric – SSIM), Subsection IV-C (Video Quality Metric – VQM), and Subsection IV-D (Visual Information Fidelity – VIF). Finally, in Subsection IV-E the diversity and complementarity in terms of modelling different aspects of the Human Visual System (HVS) by these measurement algorithms will be discussed.
A. Peak Signal-to-Noise Ratio (PSNR)
Undoubtedly, one of the simplest, best-known and most often-used measures of video quality is PSNR (Peak Signal-to-Noise Ratio). This measure is the ratio of the maximum signal power to the noise power distorting the signal. It is usually expressed as a logarithmic decibel measure[dB]. It is used to determine the visual similarity of the reference and distorted image. It does not apply any perceptual criteria to
Fig. 1. Video content (SRC) (source: [10]) TABLE I
COMPRESSION PARAMETERS’VALUES. ABBREVIATIONS DIA,ESA,AND UMH STANDS FOR:DIAMOND SEARCH WITH RADIUS1,EXHAUSTIVE SEARCH,
AND UNEVEN MULTI-HEXAGON SEARCH,RESPECTIVELY
Basic compression Temporal and spatial changes
Time prediction I, P, B frame size factors Bit-rate 1, 2, 4, 8, 16 Mbit/s
QP 26, 32, 38, 46
GOP length 8, 16, 32, 64 32, 64 Number of B frames 0, 2, 3, 7 2 B-pyramid strict, none none
Frame rate 25 12, 8 25
Resolution 1920x1080 960x540, 480x270 1920x1080 Integer pixel motion
estima-tion method
Default dia, esa, umh Default Maximum motion vector
search range
Default 4, 64 Default Number of reference frames Default 4, 16 Default Number of slices per
frame 1, 2 1
I to P frame ratio Default 0.8, 1, 1.2, 1.4 P to B frame ratio Default 0.5, 0.8, 1, 1.2, 1.4
the interpretation of the perceived noise. We performed PSNR on the Y Signal using255 as the maximum peak value.
B. Structural Similarity Index Metric (SSIM)
SSIM (Structural Similarity Index Metric) [12], [13] is a top-down approach which uses a simple functional model of the HVS. Evaluation of quality of video sequences using SSIM is divided into three layers: the local layer of a block-shaped region, the distortion map obtained at frame level, and the layer spanning the complete video sequence. Firstly, from the original and distorted video sequence 8 × 8 pixel blocks are extracted. At this level, the SSIM index is calculated for each block separately for each component of Y , Cb and Cr. In the second step, the local quality values are combined to form a value for the quality level of the frame. The quality of local regions is calculated in accordance with the level of brightness (dark areas are less susceptible to degradation of quality). In the last stage, quality is calculated for the entire video sequence. The quality level of the frame is weighted using frame motion vectors, because some types of distortion (e.g. blur) do not affect the perceived quality of the scenes in the presence of motion [12].
C. Video Quality Metric (VQM)
The VQM (Video Quality Metric) method was developed by the Institute for Telecommunication Science (ITS) [14], [15]. VQM exists in several different implementations that are optimised for specific areas. It takes the spatio-temporal behaviour of the HVS into consideration. As it is freely available, it is often used in comparison studies, and several studies exist which demonstrate that the results of VQM outperform those of PSNR [16].
D. Visual Information Fidelity (VIF)
VIF (Visual Information Fidelity) is a measure of image quality, which identifies the mutual information shared by the reference and distorted images, with respect to the information contained in the reference image. The term ‘information’ shall be understood here in its meaning introduced by Shannon. VIF uses NSS (Natural Scene Statistics) modelling together with the image degradation model and the model of HVS [17].
E. Complementarity/Diversity of Metrics
PSNR, as a simple energy difference metric, takes into consideration mostly the frame by frame differences between the video frames, and therefore is very accurate on individ-ually distorted frames. SSIM mostly focuses on the texture
components of each frame. The processing of both algorithms is straightforward which may improve robustness of prediction performance but may also lack modelling of higher order perceptual features. In particular, the temporal pooling is very simple. VQM works in spatio-temporal blocks and also cal-culates higher order perceptual features, aiming at modelling the Human Visual System. It has been shown to provide generally higher correlations than PSNR [16]. VIF follows an information theoretical approach, and therefore may provide complementary results. Its performance has been shown in simulations and studies [17].
V. NO-REFERENCE(NR) METRICS ANDPARAMETERS
EVALUATION
Two simple No-Reference (NR) video quality measurement algorithms have been evaluated on the database. They are presented in Subsection V-A (Blockiness) and Subsection V-B (Blurring).
A. Blockiness
Block artefacts are often caused by the use of lossy compression. This stems from independent coding of “N ×N ” pixel blocks (usually 8×8 pixels) in most of the cur-rently used video coding algorithms including H.261 – H.265,
MPEG-4 Part 2 and Part 10 or MPEG-2. These algorithms use a quantization of the cosine transform coefficients for each block separately, which causes noise shaping that leads to coding artefacts in the form of discontinuities for coded block boundary. Sudden color intensity changes are most evident in uniform areas of an image and are caused by the removal of the least significant coefficients of DCT. The results of the computed NR metric are elaborated in [18].
B. Blurring
Blur is caused by the removal of cosine transform coeffi-cients of high frequency, which leads to low-pass filtering. This effect can be seen as a loss of detail in the image, reducing sharp edges and texture of objects. Moderate blur effects may occur due to loop-filters in current encoding standards or due to the combination of image patches from bidirectionally predicted coding-blocks. While these effects usually lead to perceived smoothness for luminance signals, the same effects on chrominance coding may lead to smearing on the edges of areas with contrasting colour values. The results of the computed NR metric are elaborated in [18].
VI. CORRELATION ANALYSIS OFFRMETRICS
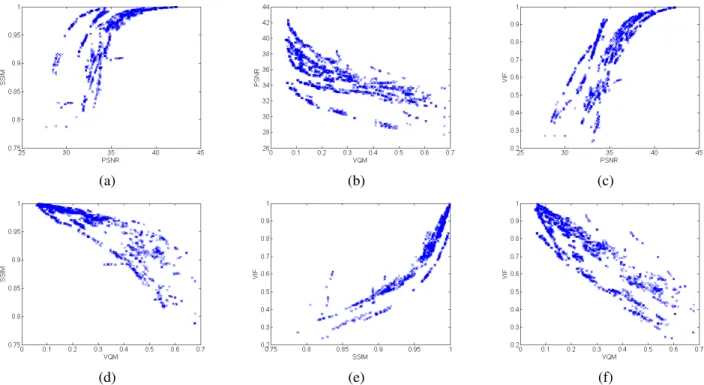
As a first example of the usefulness of this database, the previously-mentioned FR measurement algorithms will be compared. Two performance metrics will be used: The Pearson Linear Correlation Coefficient (PLCC), and the Spearman Rank Order Coefficient (SROCC) as described in the VQEG HDTV Test-Plan [19]. Due to the missing alignment, Root Mean Square Error (RMSE) is not appropriate. The results of the currently available FR measurement algorithms are shown in Table II. Please note that they do not indicate
any performance of the measurement algorithms in terms of agreement with perceived video quality. The individual scatter-plots in Fig. 2 show that the FR measurement algorithm behave very differently. Both from the performance metrics as well as from the scatter-plots it is evident that PSNR behaves differently from the other algorithms. The highest correlation is measured between VQM and VIF which is surprising, taking into consideration that the measurement algorithms use different features. The scatter-plot in Fig. 2(e) reveals that differences exist at any point of the quality scale. For comparing VIF to SSIM, the scatter-plot indicates that a simple linear relationship as assumed by the PLCC may not be sufficient, which is backed up by the high SROCC. In Fig. 2(d) it may be seen that SSIM and VQM behave similar for high quality videos but disagree at lower qualities. Whether this can be explained by the SSIM scale compression towards higher qualities requires further analysis.
TABLE II
CORRELATION AND DISTANCE OFFRMEASUREMENTS
FR comparison PLCC SROCC PSNR-SSIM 0.50 0.72 VQM-PSNR -0.68 -0.73 PSNR-VIF 0.77 0.83 VQM-SSIM -0.75 -0.90 SSIM-VIF 0.79 0.93 VQM-VIF -0.90 -0.86
VII. POSSIBLEAPPLICATIONS
Possible application areas of this database are discussed in this section. These example areas are grouped into develop-ment, training and verification of hybrid NR quality models for multimedia content (Subsection VII-A) and subjective evaluation using crowd-sourcing (Subsection VII-B).
A. Development, Training and Verification of Hybrid NR Quality Models for Multimedia Content
In the context of the JEG-Hybrid project of VQEG [20] and SYNAT (System for Science and Technique) project, this dataset will be used for development and training collabo-ratively developed Hybrid No-Reference models for assessing quality of video sequences. The ground truth for the NR metric development will be associated FR rating data. By combining different measurement methods and evaluating their individ-ual and combined performance, VQEG aims to continuously improve measurement algorithms in a similar way as this has been established for video coding over the last two decades, leading to successive ITU recommendations. As the algorithm development and the training database are open and welcome additions, the project will grow continuously.
B. Subjective Evaluation using Crowd-Sourcing
Subjective evaluation of such a large dataset in controlled lab conditions may be difficult to achieve, even if the number of sequences to be evaluated may be reduced significantly if objective measurements show a high correlation. A pos-sible solution to this problem may be found in the recent
(a) (b) (c)
(d) (e) (f)
Fig. 2. Scatter-plot of unaligned FR measurement algorithms
advances on crowd-sourcing [21]. Crowd-sourcing is currently considered as a rapid way of obtaining estimations of video quality. While their judgement performance is not as high as those obtained in standardised lab conditions, they may prove particularly useful in the scenario when objective metrics and subjective data are available. Such research is enabled with the proposed large database.
VIII. CONCLUSIONS
The paper proposed a study aimed at identifying the differ-ent codec configurations employed in a large video database and applying several quality metrics to study their objective evaluations. At the moment, ten source sequences have been used. After determining all the variables 12,960 JM/x264-encoded video sequences were prepared, which were used for calculating metrics. As a first approach to determining the quality and classification parameters for the video sequences, several FR and NR metrics were selected. The resulting data will be freely available to the research community, as they may enable and facilitate research in several domains as hinted in this paper. Researchers interested in obtaining access to the database may contact the JEG-Hybrid project [20]. Possible example application areas of this database are development, training and verification of hybrid NR quality models for multimedia content and subjective evaluation using crowd-sourcing.
ACKNOWLEDGMENTS
This research work has been supported in part by The Polish National Centre for Research and Development (NCRD) under Grant No. SP/I/1/77065/10 by the Strategic Scientific Research
and Experimental Development programme: “Interdisciplinary System for Interactive Scientific and Scientific-Technical In-formation”. This research work has been supported in part by PL-Grid Infrastructure. This research work has been supported in part by AGH University of Science and Technology under Department of Telecommunications statutory work.
REFERENCES
[1] M. Urvoy, M. Barkowsky, R. Cousseau, Y. Koudota, V. Ricorde, P. Le Callet, J. Gutierrez, and N. Garcia, “Nama3ds1-cospad1: Subjec-tive video quality assessment database on coding conditions introducing freely available high quality 3d stereoscopic sequences,” in Quality of
Multimedia Experience (QoMEX), 2012 Fourth International Workshop on, july 2012, pp. 109 –114.
[2] A. Moorthy, L. K. Choi, A. Bovik, and G. de Veciana, “Video quality assessment on mobile devices: Subjective, behavioral and objective studies,” Selected Topics in Signal Processing, IEEE Journal of, vol. 6, no. 6, pp. 652 –671, oct. 2012.
[3] A. K. Moorthy, L.-K. Choi, A. C. Bovik, and G. de Veciana, “Subjective analysis of video quality on mobile devices,” in Sixth International
Workshop on Video Processing and Quality Metrics for Consumer Electronics (VPQM) (invited article), Scottsdale, Arizona, December 2013.
[4] F. De Simone, M. Naccari, M. Tagliasacchi, F. Dufaux, S. Tubaro, and T. Ebrahimi, “Subjective assessment of H.264/AVC video sequences transmitted over a noisy channel,” in Proceedings of the First
International Workshop on Quality of Multimedia Experience (QoMEX 2009), 2009. [Online]. Available: http://www.qomex2009.org/ [5] F. De Simone, M. Tagliasacchi, M. Naccari, S. Tubaro, and T. Ebrahimi,
“A h.264/avc video database for the evaluation of quality metrics,” in Acoustics Speech and Signal Processing (ICASSP), 2010 IEEE
International Conference on, 2010, pp. 2430–2433.
[6] K. Seshadrinathan, R. Soundararajan, A. Bovik, and L. Cormack, “Study of subjective and objective quality assessment of video,” Image
Processing, IEEE Transactions on, vol. 19, no. 6, pp. 1427–1441, 2010. [7] K. Seshadrinathan, R. Soundararajan, A. C. Bovik, and L. K. Cormack, “A subjective study to evaluate video quality assessment algorithms,” in
Series, ser. Society of Photo-Optical Instrumentation Engineers (SPIE) Conference Series, vol. 7527, Feb. 2010.
[8] C. Keimel, A. Redl, and K. Diepold, “The tum high definition video datasets,” in Quality of Multimedia Experience (QoMEX), 2012 Fourth
International Workshop on, 2012, pp. 97–102.
[9] Video Quality Experts Group (VQEG), “Video Quality Experts Group (VQEG),” http://www.vqeg.org/.
[10] M. Barkowsky, N. Staelens, L. Janowski, Y. Koudota, M. Leszczuk, M. Urvoy, P. Hummelbrunner, I. Sedano, and K. Brunnstr¨om, “Subjec-tive experiment dataset for joint development of hybrid video quality measurement algorithms,” in 10th European Conference on Interactive
TV and Video, Proceedings; QoEMCS 2012 – Third Workshop on Qual-ity of Experience for Multimedia Content Sharing. Ghent University, Department of Information technology, 2012, pp. 1–4.
[11] K. S¨uhring, “H.264/AVC JM Reference Software,” http://iphome.hhi.de/ suehring/tml/.
[12] Z. Wang, L. Lu, and A. Bovik, “Video quality assessment using struc-tural distortion measurement,” in Image Processing. 2002. Proceedings.
2002 International Conference on, vol. 3, 2002, pp. III–65 – III–68 vol.3.
[13] Z. Wang, A. Bovik, H. Sheikh, and E. Simoncelli, “Image quality assess-ment: from error visibility to structural similarity,” Image Processing,
IEEE Transactions on, vol. 13, no. 4, pp. 600 –612, april 2004. [14] S. Winkler, Digital Video Quality – Vision Models and Metrics. John
Wiley & Sons, Jan. 2005.
[15] Y. Wang, “Survey of objective video quality measurements,” ftp://ftp. cs.wpi.edu/pub/techreports/pdf/06-02.pdf, EMC Corporation Hopkinton, MA 01748, USA, Tech. Rep., 2006, ftp://ftp.cs.wpi.edu/pub/techreports/ pdf/06-02.pdf.
[16] S. Wolf and M. Pinson, “Fast low bandwidth video quality model (vqm) description and reference code,” ITU-T Contribution COM9-C5-E, Geneva, February 2-6 2009.
[17] H. Sheikh and A. Bovik, “Image information and visual quality,” Image
Processing, IEEE Transactions on, vol. 15, no. 2, pp. 430 –444, feb. 2006.
[18] P. Romaniak, L. Janowski, M. Leszczuk, and Z. Papir, “Perceptual quality assessment for h.264/avc compression,” in Consumer
Commu-nications and Networking Conference (CCNC), 2012 IEEE, Jan., pp. 597–602.
[19] G. Cermak, L. Thorpe, and M. Pinson, “Test Plan for Evaluation of Video Quality Modelsfor Use with High Definition TV Content,” Video
Quality Experts Group (VQEG), 2009.
[20] The JEG Hybrid Group, “Video Quality Experts Group (VQEG),” http: //www.its.bldrdoc.gov/vqeg/projects/jeg/jeg.aspx.
[21] C. Keimel, J. Habigt, C. Horch, and K. Diepold, “Video quality evaluation in the cloud,” in Packet Video Workshop (PV), 2012 19th
![Fig. 1. Video content (SRC) (source: [10]) TABLE I](https://thumb-eu.123doks.com/thumbv2/123doknet/7957158.266579/4.918.86.838.79.258/fig-video-content-src-source-table.webp)