Considération du temps de collecte dans les mesures
d’accès aux sources d’approvisionnement en eau
potable dans les pays en voie de développement
Mémoire
Alexandra Cassivi
Maîtrise en aménagement du territoire et développement régional
Maître en aménagement du territoire et développement régional (M.ATDR)
Québec, Canada
Considération du temps de collecte dans les mesures
d’accès aux sources d’approvisionnement en eau
potable dans les pays en voie de développement
Mémoire
Alexandra Cassivi
Sous la direction de :
Edward Owen Douglas Waygood, directeur de recherche
Caetano Dorea, codirecteur de recherche
Résumé
Bien qu’il soit reconnu comme un droit humain par les Nations Unies, l’accès à l’eau potable constitue toujours une lacune à l’échelle mondiale. Malgré le caractère criant de cette problématique, il est évalué que 42,5% de la population mondiale n’avait pas accès à une source d’eau potable améliorée à domicile en 2015. Néanmoins, l’indicateur actuellement utilisé afin d’établir le portrait de la situation à l’échelle mondiale chiffre la proportion de population ayant accès à une source d’eau potable à 91%. Mise de l’avant par plusieurs organisations, cette statistique repose sur le type de source utilisé par les ménages, sans porter considération à la localisation de la source ni même à la qualité de celle-ci. L’objectif de cette étude est d’effectuer un portrait rigoureux des conditions d’accès et des inégalités actuellement observées dans les pays en voie de développement. En s’intéressant au temps de collecte nécessaire pour atteindre une source d’eau depuis son point d’utilisation, il est possible de déterminer le potentiel pour tous d’accéder aux services d’approvisionnement en eau potable. L’analyse des données des enquêtes démographiques et de santé (DHS) de l’Agence des États-Unis pour le développement (USAID) et des enquêtes à indicateurs multiples (MICS) de l’UNICEF permet de reconnaitre l’impact du temps de collecte pour 27 pays en voie de développement.
Abstract
Although it is recognized as a human right by the United Nations, a lack of access to safe drinking water still remains widespread worldwide. Despite its importance, an estimated 42.5% of the world’s population did not have access to an improved drinking water source on premises in 2015. However, the indicator currently used to monitor the global picture of access measured the proportion of the population with access to drinking water as 91%. This statistic is based on the type of source used by households, but does not consider the location nor the quality of the source. The objective of this study is to provide a rigorous picture of drinking water access conditions and inequalities currently observed in developing countries. By considering time required to reach a water source from its point of use, it is possible to determine the potential access for a sufficient amount of drinking water. The impact of water fetching collection time for 27 developing countries is determined through data analysis of household surveys from United States Agency for International Development (USAID) Demographic and Health Surveys (DHS) and UNICEF Multiple Indicator Cluster Surveys (MICS).
Table des matières
Résumé ... iii
Table des matières ... v
Liste des tableaux ... vi
Liste des figures ... vii
Liste des annexes ... viii
Liste des abréviations ... ix
Remerciements : ... x
Avant-propos ... xi
Chapitre 1. Introduction ... 1
Chapitre 2. ... 7
Revisiting water access MDG targets in terms of distance and time: Examples in Eastern Africa ... 8
Chapitre 3. ... 14
Access to Drinking Water in Least Developed Countries of Eastern Africa, Southern Africa and Southern Asia ... 15
Chapitre 4. ... 28
Access to Drinking Water : Time Matters ... 29
Chapitre 5. ... 37
Collection time inequalities : Fetching water in Ethiopia ... 38
Chapitre 6. Conclusion ... 45
Bibliographie ... 49
Liste des tableaux
Table C1- 1: Pays étudiés dans les articles insérés au présent mémoire ... 5
Table C3- 1: General information on data sources used. ... 18
Table C3- 2: Time needed to fetch water in minutes. ... 20
Table C4- 1 : General information on data used by country ... 31
Table C4- 2: Collection time in minutes by 30-minutes threshold and type of source ... 32
Table C5- 1 : Average collection time with regards to different household characteristics ... 41
Liste des figures
Figure C1- 1: Relation entre le temps de collecte et la quantité d’eau consommée (Cairncross et Feachem,
1993) ... 2
Figure C2- 1 : Proportion of the population using an improved drinking water source ... 10
Figure C2- 2 : Time to get water (round-trip) ... 11
Figure C2- 3 : Impact of the distance on access to water ... 12
Figure C3- 1 : National population with access to water according to the indicator ... 22
Figure C3- 2 : Type of water source used by the population who need more than 30 minutes to fetch water .. 24
Figure C4- 1 : Collection time needed to fetch water from an improved water source classified with a 30-minute threshold. ... 33
Figure C4- 2 : Water service level ... 34
Table C4- 1 : General information on data used by country ... 31
Liste des annexes
Annexe A : Contributions scientifiques ... 50 Annexe B : Liste des bénéficiaires de l’APD établie par le CAD. 2014-2015-2016 ... 61
Liste des abréviations
DHS : Demographic and Health Surveys / Enquêtes démographiques et de santé JMP : Joint Monitoring Programme for Water Supply and Sanitation
MDG/OMD : Millenium Development Goals / Objectifs du Millénaire pour le développement MICS : Multiple Indicator Cluster Surveys / Enquêtes à indicateurs multiples
SDG/ODD : Sustainable Development Goals / Objectifs de développement durable
UNICEF : United Nations International Children's Emergency Fund / Fonds des Nations Unies pour l'enfance UN/ONU : United Nations / Organisation des Nations Unies
USAID : United States Agency for International Development / Agence des États-Unis pour le développement international
WaSH : Water, Sanitation and Hygiene / Eau, assainissement et hygiène WHO/OMS : World Health Organization / Organisation mondiale de la santé
Remerciements :
La réalisation de ce projet de recherche et les résultats découlant permettent une avancée considérable des connaissances au sujet de l’accès à l’eau potable dans les pays en voie de développement. L’implication et les contributions de différentes parties pour l’accomplissement de cette recherche se doivent d’être soulignées. Ce projet de recherche fut, avant tout, possible grâce à l’instigation des professeurs E. Owen D. Waygood et Caetano Dorea. La plus grande gratitude leur est portée pour leurs innombrables idées, leur support sans limites et leur dévouement pour ce projet. Leur précieuse aide pour la réalisation de ces recherches a permis de mettre sur pieds un projet d’envergure et de développer d’importantes contributions scientifiques.
Une reconnaissance particulière est, par ailleurs, accordée à Richard Johnston pour sa présence à titre de superviseur lors du stage de recherche effectué à l’OMS et sa collaboration subséquente à titre de coauteur. Un grand remerciement est également porté à l’unité WaSH de l’OMS et plus spécialement à l’équipe UNICEF/WHO Joint Monitoring Programme for Water and Sanitation (JMP) pour leur accueil et leur expertise. Ce mémoire et les nombreuses contributions scientifiques furent possibles par le support financier du Conseil de recherches en sciences naturelles et en génie du Canada (CRSNG), de l’Institut Hydro-Québec en environnement, développement et société (Institut EDS) ainsi que par l’obtention de divers prix (AFDU Québec) et bourses (bourses de rayonnement et mobilité).
Avant-propos
Cette recherche a été réalisée dans le cadre de la maîtrise en aménagement du territoire et développement régional (M.ATDR) avec mémoire à l’Université Laval. Les résultats de cette recherche ont en partie été obtenus lors d’un stage de recherche effectué de mai à août 2016 au sein de l’unité Water, Sanitation and Hygiene (WaSH) de l’Organisation mondiale de la santé (OMS/WHO) à Genève en Suisse.
Ce présent mémoire de maîtrise, livrable pour l’obtention du grade M.ATDR, a été monté sous forme d’articles. Le document se divise en six chapitres contenant une introduction, quatre articles ainsi qu’une conclusion attenante.
Les articles insérés dans le mémoire constituent les dernières versions disponibles à ce jour. Aucune modification n’a été portée aux articles depuis leur insertion dans ce mémoire. Les articles scientifiques rédigés dans le cadre de ce mémoire sont exposés aux chapitres 2, 3, 4 et 5 du présent document. Pour une meilleure intégration dans le mémoire, un paragraphe introspectif fut ajouté au début de chaque article.
Le premier article (Chapitre 2) fut soumis pour une conférence et publié dans un acte de conférence (39th Water, Engineering and Development Centre (WEDC) International Conference. 11 au 15 juillet 2016). Cet article, rédigé en février 2016, a été produit avec des résultats préliminaires constituant ainsi un document de nature exploratoire. L’article visait à soulever la problématique associée au choix de l’indicateur utilisé pour mesurer l’accès à l’eau potable. Il a été ajouté au mémoire dans le but de démontrer les avancées autant au niveau des résultats que de la démarche.
Le deuxième article (Chapitre 3) a été soumis pour publication dans Transportation Research Record : Journal
of the Transportation Research Board en août 2016. Cet article présente un portrait du temps de collecte et des
inégalités entre les milieux urbains et ruraux dans les pays les moins avancés de l’Afrique et de l’Asie. Ne traitant pas suffisamment du domaine des transports, l’article fut refusé pour publication. Les auteurs se sont concentrés sur la rédaction d’autres articles (Chapitre 4 et 5) avec l’intention de publier dans un journal tourné davantage sur le domaine de l’eau. Néanmoins, des modifications pourront tout de même ultérieurement être portées au manuscrit pour une publication future.
Le troisième article (Chapitre 4) découla d’analyses étendues et approfondies effectuées avec l’Organisation mondiale de la santé (OMS). De type courte communication, cet article a été rédigé entre septembre et décembre 2016 donnant suite aux résultats obtenus lors des recherches effectuées au sein de l’OMS entre juin
et août 2016. Cet article présente un portrait global de l’accès à l’eau dans les pays en voie de développement. L’article a été soumis à Journal of Water and Health le 7 mars 2017 et est toujours en attente d’acceptation. Le quatrième article (Chapitre 5) a été rédigé avec le but d’approfondir l’étude des inégalités en termes d’accès à l’eau potable observées précédemment. Un seul pays, l’Éthiopie, a été sélectionné pour cette étude de cas. Rédigé en février 2017, cet article a été soumis pour une conférence (40th Water, Engineering and Development
Centre (WEDC) International Conference. 24 au 28 juillet 2017). L’article a été accepté en mars 2017 et sera publié dans les actes de conférence en juillet 2017.
Les résultats présentés dans ces quatre articles proviennent d’analyses effectuées par l’étudiante sous la supervision des coauteurs. Les articles ont entièrement été rédigés par l’étudiante de ce mémoire et ensuite révisés par les coauteurs. L’étudiante tient le rôle d’auteure principale pour les quatre articles. Les professeurs E. Owen D. Waygood, Ph.D (Université Laval, QC, Canada) et Caetano Dorea, Ph.D (University of Victoria, BC, Canada et Université Laval, QC, Canada) sont coauteurs pour les quatre publications. Par ailleurs, Richard Johnston, Ph.D (Organisation mondiale de la santé, Genève, Suisse) est coauteur de l’article présenté en chapitre 4.
Outre la rédaction d’articles, les recherches de l’étudiante ont faites l’objet de plusieurs présentations dans le cadre de conférences avec comité de sélection. Les propositions de communications soumises et acceptées pour les communications scientifiques suivantes se trouvent en Annexe A du présent mémoire.
- International Conference on Transport and Health (Juin 2017) - Midi-conférence de l’Institut EDS (Mars 2017) (Sur invitation)
- 21e Colloque étudiant pluridisciplinaire du Centre de recherche en aménagement et développement (Mars
2017)
- Colloque annuel de l’Institut EDS 2017 (Mars 2017) - 2017 Colorado WASH Symposium (Mars 2017)
- 2016 Water and Health Conference : Where Science Meets Policy at UNC Water Institute (Octobre 2016) - International Hydrological Programme (IHP) of UNESCO and International Association of Hydrological
Sciences (IAHS) Kovacs Colloquium (Juin 2016)
- 30th Eastern Canadian Symposium on Water Quality and Research (Mai 2016)
- Colloque annuel de l’institut EDS 2016 (Mars 2016) (Sur invitation)
- 5e Colloque étudiant en développement international de la Chaire en développement international (Février
Chapitre 1.
Introduction
[Note1 : Les renvois contenus dans ce chapitre réfèrent uniquement aux figures et tables du présent chapitre. Le préfixe C1 a été ajouté aux
figures et tables afin de rattacher les renvois au présent chapitre.]
L’accès à l’eau potable constitue toujours une lacune à l’échelle mondiale et plus particulièrement dans les pays les moins développés, bien qu’il soit reconnu comme un droit humain par les Nations Unies. Considérant que 42,5% de la population mondiale, soit plus de 3 milliards de personnes, n’ont pas accès à une source d’eau courante, il est essentiel de porter toute considération à cette grande proportion de la population qui doit aller chercher de l’eau pour survivre (ONU, 2015). La mesure de l’accès à l’eau potable est fortement influencée par sa définition et les indicateurs choisis. Généralement basées sur le type de source utilisé, les mesures d’accès couramment utilisés pour effectuer le portrait de l’accès à l’eau potable ne tiennent pas compte de la localisation de la source et du temps nécessaire pour l’atteindre depuis son point d’utilisation. En appliquant des variables relatives au temps de collecte, on observe l’impact de cette tâche sur l’évaluation globale d’accès à un service d’approvisionnement. Alors que plusieurs études traitent de composantes connexes, très peu d’études démontrent actuellement l’importance de la distance sur l’accès à l’eau potable dans les pays en voie de développement. Les études existantes sur le sujet ont été conduites dans les années 1960 et ont été effectuées dans un contexte anthropologique. Cette présente recherche prévoit donc pourvoir une meilleure compréhension des déplacements effectués pour aller chercher de l’eau, et ce dans le contexte des pays en voie de développement.
Revue de la littérature
L’année 2015 marque la fin des Objectifs du Millénaire pour le développement (OMD) mis en place en 2000 par les États membres de l’Organisation des Nations-Unies. La cible 7C des OMD était de réduire de moitié, de 2000 à 2015, le pourcentage de la population n’ayant pas accès à un approvisionnement en eau potable (ONU, 2015). L’indicateur établi pour les OMD était la proportion de la population utilisant une source d’eau améliorée, se rattachant plus particulièrement au type de système d’approvisionnement utilisé. Cette cible a été atteinte pour 2015 alors que la proportion de la population mondiale ayant accès à l’eau potable a augmenté de 76% à 91%.
Une source améliorée est une source qui, de par la nature de sa construction, protège l’eau de façon satisfaisante de toute contamination extérieure, en particulier des matières fécales (WHO/UNICEF, 2015). L’indicateur d’accès étant actuellement uniquement basé sur la technologie de la source d’eau (p. ex. connexion domestique, fontaine publique, sources et puits protégés, etc.). Le temps pour aller chercher l’eau, la quantité et la qualité de l’eau se voient ignorés dans la proportion de la population ayant accès à l’eau en 2015. L’omission de ces différentes caractéristiques entrainerait une surestimation de la proportion de la population ayant réellement accès à l’eau (Devi et Bostoen, 2009; Godfrey et al.,2011; Bain et al.,2012; Onda et al., 2012; Ho et al., 2014). En comparant l’accès à une source améliorée et l’accès à une source dite améliorée répondant aux normes de l’Organisation mondiale de la santé (OMS) quant à
la qualité microbienne et chimique de l’eau, une diminution dans la proportion de la population ayant accès à l’eau a notamment été observée (Bain et al.,2012). L’indicateur étant critiqué par plusieurs auteurs, il est essentiel de se questionner sur les progrès effectués dans le cadre des OMD. Au même titre que pour la qualité de l’eau, la distance de la source et la quantité d’eau utilisée sont des propriétés qui doivent être incluses dans l’indicateur d’accès. Afin de porter l’attention sur les populations qui doivent se déplacer pour s’approvisionner en eau, il importe plus particulièrement de s’intéresser aux mesures de distance.
La collecte d’eau implique différentes conséquences directes et indirectes sur la qualité de vie et sur la santé des individus. Le temps pour aller chercher l’eau influencerait d’abord la quantité d’eau collectée par les ménages (Cairncross et Feachem, 1993). Une relation non linéaire serait observée entre ces deux variables. Un temps de collecte inférieur à 3 minutes permettrait de transporter une grande quantité d’eau. Une importante diminution de la quantité d’eau serait ensuite observée après 3 minutes, se manifestant sous forme de plateau jusqu’à 30 minutes (Figure C1-1). Lorsque la source d’eau est située en deçà de 30 minutes de marche de son point d’utilisation, le fait de la rapprocher n’entrainerait pas une augmentation de la quantité d’eau consommée sauf si elle est installée à moins de 3 minutes. Enfin, une corrélation négative serait observée entre les variables lorsque le temps de collecte est supérieur à 30 minutes. L’augmentation du temps de collecte au-dessus de 30 minutes entrainerait effectivement une diminution de la quantité d’eau collectée (Cairncross et Feachem, 1993).
L’augmentation de la quantité d’eau potable collectée et ultérieurement utilisée est essentielle pour améliorer la santé et le bien-être des personnes. La prévalence des maladies diarrhéiques dans les pays en voie de développement résulte principalement de la présence de microorganismes pathogènes dans l’eau et les excréments. L’accès à une quantité d’eau suffisante pour la consommation et l’hygiène serait associée à une diminution générale des maladies
reliées à l’eau (Curtis, 1986; Cairncross et Feachem,1993; Cairncross, 1999; Bartram, 2005; Fry et al, 2010). Ces dernières touchent près de la moitié de la population des pays en voie de développement et les maladies diarrhéiques associées constituent la deuxième cause de mortalité infantile à l’échelle mondiale (Bartram, 2005). Plusieurs études confirment l’association entre l’amélioration de l’hygiène et la réduction des cas de diarrhée (Esrey, 1991; Cairncross et al., 2010; Wolf et al., 2013). La disponibilité en eau pouvant directement réduire l’incidence des maladies diarrhéiques, il incombe d’améliorer son accessibilité en vue d’assurer la santé globale des populations et de réduire la portée de ce fléau (WHO, 2013).
Une relation entre le temps de collecte et la prévalence de maladies chez les enfants peut également être attribuable au temps perdu pour effectuer la tâche. Certes, le temps et l’énergie nécessaires pour aller chercher l’eau ne peuvent être investis dans d’autres activités. Supposant que les déplacements pour aller chercher l’eau sont majoritairement effectués par les femmes et les enfants, il est nécessaire de connaitre l’impact de cette tâche sur les autres activités, notamment sur l’hygiène, l’éducation, le travail et les autres tâches parentales (Curtis, 1986). Le temps et l’énergie perdus lors de la collecte de l’eau constitueraient donc un coût indirect aux lacunes d’accessibilité. L’amélioration de la sécurité et des conditions de déplacements associés à la collecte d’eau pourrait par ailleurs permettre de réduire les risques de blessures encourues par les individus (Curtis, 1986).
En portant considération aux répercussions potentielles sur la santé des individus, il apparait nécessaire de prendre en considération la distance et ses impacts sur l’accès à l’eau potable. Pour faire suite aux Objectifs du Millénaire pour le développement, une nouvelle cible fut établie dans le cadre des Objectifs de développement durable (ODD) qui s’étendront, quant à eux, jusqu’en 2030. La cible correspondante est d’assurer l’accès universel et équitable à l’eau potable, à un coût abordable (PNDU, 2016). La couverture de l’accès à l’eau reposant néanmoins sur l’indicateur choisi, il s’avère essentiel de réviser les progrès effectués précédemment en vue d’assurer un approvisionnement en eau accessible, abordable et sécuritaire pour tous. Une connaissance plus approfondie de ces déplacements serait des plus bénéfiques pour assurer la mise en place de projet de développement propre à chaque population. Très peu d’études portent actuellement considération au temps de collecte nécessaire pour l’approvisionnement en eau potable alors que plus du tiers de la population mondiale n’a toujours pas accès à cette ressource à domicile. Cette réalité, souvent oubliée, constitue sans aucun doute l’un des problèmes les plus pressants à adresser pour pourvoir au développement des pays les moins avancés du monde.
Objectifs et hypothèses :
L’objectif général de cette recherche est de connaitre les impacts du temps de collecte sur l’approvisionnement en eau potable dans les pays en voie de développement. Deux objectifs spécifiques découlent de cette dernière :
1) Dresser le portrait de l’accès à l’eau potable dans les pays les moins développés en considérant le temps de collecte.
2) Révéler les inégalités occurrentes reliées au temps de collecte pour l’approvisionnement en eau potable au sein de pays en voie de développement.
Les hypothèses portées aux objectifs de cette recherche sont les suivantes :
1) L’ajout du temps de collecte dans les mesures d’accès aux sources d’eau potable aurait un impact sur les estimations de la couverture d’accès à l’échelle mondiale.
2) Différentes inégalités associées aux caractéristiques des ménages et des individus seraient percevables en ce qui a trait à l’accessibilité aux services d’approvisionnement en eau potable. Au niveau du ménage, la région ainsi que le milieu de résidence (urbain/rural) constitueraient des facteurs d’inégalités au sein des pays. Au niveau individuel, différentes caractéristiques sociales touchant l’éducation et le régime familial seraient déterminantes du niveau d’accès et du temps de collecte.
Les nouvelles connaissances apportées par la réponse à ses objectifs visent à soulever l’étendue de la problématique à l’échelle mondiale. Ultimement, ces résultats permettront de cibler les populations les plus vulnérables et ainsi d’assurer la mise en œuvre de programmes d’approvisionnement en eau potable centrés sur les besoins réels.
Méthodologie :
Cette recherche s’inscrit, globalement, dans le contexte des pays en voie de développement. Les pays considérés à titre de pays en voie de développement se retrouvent sur la liste des bénéficiaires d’aide publique au développement (APD). Tel que défini par la Direction de la coopération pour le développement (DCD-CAD), cette liste regroupe l’ensemble des pays à revenu national brut classé comme faible ou intermédiaire par la Banque mondiale, excluant les pays de l’Union européenne et les pays membres du G8 (Annexe B). Dans le cadre de ce mémoire, la priorité a été portée sur les pays les moins avancés (PMA), définis par l’Organisation des Nations Unies comme les pays les plus pauvres et les plus faibles du monde. Des analyses ont été effectuées sur l’ensemble des pays les moins avancés, mais certains pays ont toutefois été priorisés pour la rédaction des articles contenus dans le présent mémoire. Les quatre articles traitent chacun une zone d’étude différente, mais certains pays se retrouvent étudiés dans plusieurs articles (Table C1- 1). Un total de 27 pays seront traités dans le présent mémoire. Le choix des pays à l’étude est détaillé dans la section méthodologie de chaque article.
Région (UNICEF) Pays PMA Pays étudiés
Chapitre 2 Chapitre 3 Chapitre 4 Chapitre 5
Afrique de l'Est et australe Burkina Faso x x
Burundi x x x x Comoros x x x Éthiopie x x x x Kenya x Lesotho x x Madagascar x x x Malawi x x x Mozambique x x x Rwanda x x x Soudan du Sud x x x Tanzanie x x Ouganda x x x Zambie x x
Afrique de l'Ouest et du Centre Liberia x x
Niger x x Nigeria x Rép. centrafricaine x x Rép. démocratique du Congo x x Sierra Leone x x Tchad x x Togo x x
Amérique latine et Caraïbes Haïti x x
Asie du Sud Afghanistan x x
Bangladesh x x
Bhoutan x x
Népal x x
L’ensemble des données qui ont été analysées dans le cadre du présent mémoire proviennent des enquêtes démographiques et de santé (DHS) de l’Agence des États-Unis pour le développement international (USAID) et des enquêtes à indicateurs multiples (MICS) de l’UNICEF. Ces enquêtes auprès des ménages sont harmonisées et peuvent être utilisées communément lors d’analyses. Contenant un échantillon représentatif à l’échelle nationale, les enquêtes DHS et MICS utilisent l’échantillonnage par grappe stratifié en deux dégrées selon la région et le milieu (urbain, rural). L’utilisation d’une constante méthodologie pour ces enquêtes permet d’analyser et de comparer les données de différents pays. Le choix d’utiliser ces bases de données est justifié par leur utilisation pour mesurer la cible 7C des OMD par OMS/UNICEF Joint Monitoring Programme for Water Supply and Sanitation (JMP, 2015). Ces enquêtes contiennent d’ailleurs plusieurs centaines de variables traitant de sujets variés (p. ex. fertilité, planification familiale, éducation, transferts sociaux, énergie, utilisation d’insecticide, santé, hygiène) et utilisés pour mesurer d’autres cibles des OMD. Les variables concernant l’approvisionnement en eau potable (c.-à-d. type de source1, temps
de collecte, personne qui se déplace pour aller chercher l’eau, location de la source, traitements) et d’autres variables d’ordre général (c.-à-d. taille du ménage, lieu de résidence, quintile de richesse) ont été extraites des bases de données originales pour réaliser la présente recherche. Constituant actuellement le seul proxy disponible pour mesurer la distance entre le point d’utilisation et la source d’eau, l’utilisation du temps de collecte pour les analyses est justifiée quoique contestable. D’une part, les données, provenant des questionnaires d’enquêtes auprès des ménages, ont été autodéclarées et le caractère subjectif de la variable temporelle peut constituer une limite. D’autre part, certaines limitations quant à cette variable impliquèrent préalablement la désignation de différentes suppositions : tous les déplacements sont effectués à pied et incluent le temps d’attente à la source. Sans néanmoins constituer une mesure absolue, un seuil d’accès fixé à 30 minutes, tel que proposé dans des recherches antérieures (Cairncross et Feachem, 1993) apparait être un choix juste pour mesurer l’impact du temps de collecte sur l’approvisionnement en eau potable. Un indicateur de 30 minutes est par ailleurs utilisé par d’autres auteurs (Devi et al. 2009, Fry et al. 2010, Graham et al. 2016) et reconnu par l’Organisation mondiale de la santé.
Les résultats présentés dans les articles scientifiques sont le produit d’analyses statistiques effectuées avec IBM SPPS version 23 ou STATA MP version 14, tel que précisé dans chaque chapitre. Une méthodologie complète se retrouve respectivement dans chaque article présenté ici-bas.
1 Basée sur cette variable, la définition d’une source améliorée utilisée dans ce mémoire varie entre les chapitres 2-3 et 4-5. Cette variation
s’explique par le changement officiel de la définition par WHO/UNICEF JMP à l’été 2016. Pour les chapitres 4 et 5, les bouteilles/sachets d’eau ainsi que les camions citernes/à réservoir sont considérés comme des sources d’approvisionnement en eau améliorées.
Chapitre 2.
Une revue exhaustive de la littérature a permis de tirer profit des études précédentes et de confirmer l’importance d’approfondir les recherches portant sur l’accès à l’eau potable. Tel que soulevé par d’autres auteurs, le choix de l’indicateur utilisé pour mesurer la couverture d’accès à l’eau à l’échelle mondiale peut résulter en une représentation erronée de la situation. Avec la fin des Objectifs du Millénaire pour le développement et l’avènement des Objectifs de développement durable, la rédaction d’un premier article révisant l’indicateur d’accès et son impact sur les estimations semblait des plus appropriée.
Revisiting water access MDG targets in terms of distance and time:
Examples in Eastern Africa
[Note1 : Ce chapitre est un article de type ‘’Conference paper’’ publié dans les actes de conférence de la 39th WEDC International Conference
qui s’est tenue en juillet 2016 à Kumasi au Ghana. Le présent document est disponible en ligne
http://wedc.lboro.ac.uk/resources/conference/39/Cassivi-2502.pdf .]
[Note2 : Les références contenues dans ce chapitre sont celles de l’article original et sont rapportées indépendamment à la fin du présent chapitre]
[Note3 : Les renvois originaux contenus dans ce chapitre ont été modifiés pour faire uniquement référence aux figures et tables du présent
chapitre. Le préfixe C2 a été ajouté aux figures et tables afin de rattacher les renvois au présent chapitre.]
Authors / Auteurs: Cassivi A, Waygood EOD & Dorea CC Abstract / Résumé :
Data from WHO and UNICEF Joint Monitoring Programme (JMP) for Water Supply and Sanitation show that 91% of the worldwide population have access to an improved source of water in 2015. However, this indicator does not reflect the definition of water access considering distance to the source. This is an important factor to take into account considering that 42.5% of the world population don’t have access to water on their premises in 2015. This study examined accessibility data from the JMP by taking distance into account for 5 Eastern African countries. As reported by JMP, 72.6% of these countries population have access to an improved water source while our analysis revealed that this figure falls to 58.5 % when considering distance in the access criterion. To achieve universal and equitable access to safe and affordable drinking water for all, as desired in the new Sustainable Development Goals, this impact must be considered to ensure reasonable access to water.
Les données du Joint Monitoring Programme de l’OMS et de l’UNICEF pour l’approvisionnement en eau et l’assainissement (JMP) montrent que 91% de la population mondiale a accès à une source d’eau améliorée en 2015. Cependant, cet indicateur ne reflète pas la définition de l’accès à l’eau, en omettant la distance de la source. Néanmoins, c’est un facteur important à prendre en considération compte tenu du fait que 42,5% de la population n’a pas accès à une source d’eau potable à domicile en 2015. Cette étude examine les données de JMP sur l’accessibilité en eau potable en considérant la distance pour 5 pays de l’Afrique de l’Est. Comme indiqué par JMP, 72,6% de ces pays ont accès à une source d’eau améliorée alors que notre analyse relève que ce chiffre s’élève seulement à 58,5% en considérant la distance dans le critère d’accessibilité. Afin d’atteindre un accès universel et équitable à l’eau potable, à un coût abordable, tel que ciblé dans les nouveaux Objectifs de développement durable (ODD), cet impact doit être pris en compte pour assurer un accès raisonnable à l’eau potable.
Introduction and Background
Year 2015 marks the end of the Millennium Development Goals (MDG) established in 2000 and the start of the Sustainable Development Goals (SDG) that will extend until 2030. Target 7C of the MDG was to halve, by 2015, the proportion of the population without sustainable access to safe drinking water and basic sanitation. The target was said to be met as the proportion of the world population with access to water was reported to have increased from 76% to 91%. However, this may only be true if the time to acquire the water is ignored. Considering that the definition of access to water by the WHO and UNICEF Joint Monitoring Programme (JMP) includes measures of quality, quantity, and distance, the question remains what the percentage of the population with access to water would be if a more holistic measure (e.g. quality and distance) were used.
Following the previous objective (7C of the MDG), the SDG target is: By 2030, achieve universal and equitable access to safe and affordable drinking water for all. If one considers safe to be an improved water source, and affordable to relate to the time costs of accessing the water, it is clear that this goal requires the data to be analysed with respect to those two components, and not solely the first (improved water sources).
WHO and UNICEF Joint Monitoring Programme (JMP) for Water Supply and Sanitation ensures the follow-up of progress towards the established goals. According to their definition, access to safe drinking water must respond a few characteristics: the source must be at less than 1 kilometre from the home, it must be possible to get at least 20 litres per persons per day and it must meet the guideline for drinking water quality (WHO, 2003). In spite of this definition, the indicator chosen to measure access to water by WHO and UNICEF was the proportion of the population using an improved drinking water source. Thus, only quality is being taken into consideration, while quantity and distance or time are ignored. To measure the progress towards the goal 7C, JMP uses household datasets from the UNICEF Multiple Indicator Cluster Surveys and USAID Demographic and Health Surveys program that contain in particular the proportion of the population using improved water sources but also other variables related to water such as: the time needed to fetch water, which usually makes the trip, the location of the source, the availability of water and technologies used to ensure water quality. Despite the availability of such information, the indicator chosen to measure the progress towards the MDG goal 7C did not include the time to the water source nor the quantity of water consumed per day per person, but only if the water was an improved source. Moreover, as suggest by Bain et al. (2012) the quality of the source is not even assured in an improved water source. Consequently, one could suggest that the indicator does not reflect the definition of access to water provide by the JMP. This is reflected in Dar and Khan’s article (2011), where it was argued that the target was inadequately defined and measured.
Considering that 42.5% of the world population do not have access to water on premises, we are particularly concerned by this large segment of the population who must fetch water for their survival. By applying concepts from transportation modelling to issues surrounding distance to source and water quantity we can assess the influence of these components on drinking water accessibility.
Objective
Methodology
Data from the UNICEF Multiple Indicator Cluster Surveys and the USAID Demographic and Health Surveys program were used. These surveys contained different questions, but only the household data were selected because that is the unit used to measure the target by JMP. Data from these surveys are representative and available for over 90 countries worldwide, mostly developing countries. Here the last available country datasets of five Eastern Africa countries were studied at the national scale : Burundi (2010), Comoros (2012), Ethiopia (2011), Kenya (2009) and Uganda (2011). Through this research, IBM SPSS Statistics version 23 was used to conduct statistical analysis for different variables. In a way to estimate the progress in water accessibility with the distance, models were created with this data. To ensure realistic comparison, JMP official data were used (JMP, 2015).
Results and Discussion
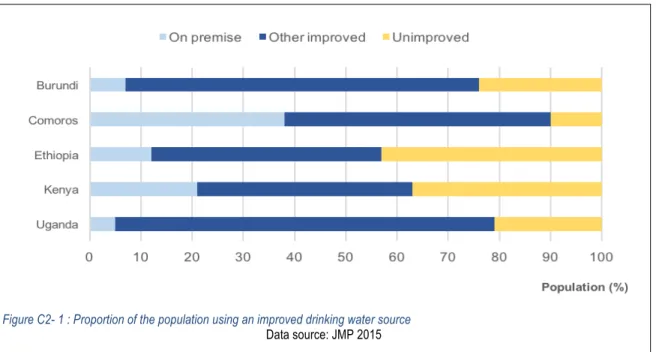
The target 7C of the Millennium Development Goals was said to have been met at the world scale in 2015 (ONU, 2015). However, the target was not met in every country, and particularly not in African countries. Indeed, only 23% of East African countries achieved the target to halve the proportion of the population with access to an improved water source (Ethiopia, Malawi and Uganda). Among East African countries, 63.2% of the population had access to an improved water source in 2015 against 38.2% in 1990. Despite this progress, if we consider water accessibility, the proportion of the population who gained access to an improved water source on premises is less impressive with 12.1% in 2015 against 7% in 1990 (ONU, 2015). Accordingly, in 2015, 87.9% of the population of East Africa needed to fetch water, whether they used an improved source or not. The types of source of water used by five African countries are shown in Figure C2-1.
Figure C2- 1 : Proportion of the population using an improved drinking water source
Time lost
By taking into consideration only the households needing to fetch water, the results shown in Figure 2 present the duration of time reported for accessing water in Burundi, Comoros, Ethiopia, Kenya and Uganda. Three of these countries (Ethiopia, Kenya, Uganda) had a median time of 30 minutes for the water-fetching trip. That is important as, according to the JMP definition of access to water, the source must be situated at less than 1 km from home. At a walking speed of 4 km/hour, a 2 km round trip, without queuing at the tap, could be made within 30 minutes. As queuing time data is not available, we assumed that round-trips at 30 minutes or less would be considered “accessible” by JMP’s definition. Therefore, for these three countries, 50% of the population still lack an accessible water source. For the other countries (Burundi and Comoros), the medians of the distribution are respectively 25 minutes and 20 minutes. As shown in Figure C2-2, the quartiles represent the distribution of the population with respect to the time required to fetch water. We can note that, for two countries (Ethiopia and Uganda), the last quartile starts at 60 minutes, which means that ¼ (25%) of the population still need more than 1 hour to get water.
Likewise, Cairncross (1999) suggest that when the water source is located farther than a 30 minutes round-trip, the quantity of water consumed would decrease with the time increment. According to the JMP definition of access to water, each household member should have at least 20L per day for drinking, cooking and personal hygiene. This, distance is an important factor to estimate the quantity of water possibly consumed. To ensure a realistic representation of the drinking water situation around the world, it’s necessary to take the distance to the source into consideration. Indeed, time costs and energy expenditure are associated to the task of fetching water and as the current Sustainable Development Goals for 2030 specifically mention affordability, this concept must be taken into account. Indeed, trips to the water source, often done by women or children, constitutes time lost at the expense of other activities and also a cost that call into question the affordability of water.
Figure C2- 2 : Time to get water (round-trip)
As shown by Devi and Bostoen (2009), adding the quantity and the distance to the type of source in the same indicator to measured progress leads to a decrease of the proportion of the population with access to water. Effectively, adding the 30 minutes round-trip distance to the proportion of the population using an improved water source results in a major change in the progress of the Millennium Development Goals. By taking distance into account in the measure of water accessibility, the result shows an overestimation of the proportion of the population with access to water. The figure C2-3 exposes the proportion of the population with access to an improved water source compared to the proportion of the population with access to an improved water source within 30 minutes of the house. First, the proportion of access to improved water according to JMP (2015) was compared with our estimations (model 1) and after they both were compared with the access to improved sources within 30 minutes. Model 1 corresponds to the proportion of the population with access to an improved water source recalculated with the survey available. The results may differ from the proportions published by JMP in 2015, as they extrapolated the last available data. This model was made to ensure a realistic base for model 2 which represent the population with access to an improved source within 30 minutes. Thus, these two models could be analysed and compared together.
The indicator choice clearly influenced the proportion of the population with access to water. For these five countries, the mean coverage for the proportion of people with access to an improved source is 72,6% (JMP 2015 and Model 1). By adding the 30 minutes distance component, the proportion of this population with access to water decreased to 58,7%. Each country comparison of accessibility confirmed the resulting overestimation related to the indicator used to measure the progress of the Millennium Development Goals. The biggest difference in the proportion is seen in Uganda with an overestimation of 21,4%. Of course, the proportion of the population with access to an improved water source was also
Figure C2- 3 : Impact of the distance on access to water
used to count the starting coverage of access to water. The use of this indicator therefore reflects the overall coverage of access to water. Thus, to ensure a representative achievement of the actual definition of access to water the indicator must be changed and the data recalculated since the beginning.
Conclusion
Despite the importance of distance and water quantity on life quality, these factors aren’t taken into consideration in the indicator used to measure the progress of the Millennium Development Goals. Moreover, it seems that this indicator does not represent the definition of access to water given by WHO and UNICEF Joint Monitoring Programme. The cost of time lost for this task is noteworthy and must be included in the indicator to ensure universal accessibility to water in the next decades. Furthermore, the quantity of water should also be considered in the indicator. The challenge facing the new Sustainable Development Goals is to address this problem. It is not enough to add “improved” sources countries to ensure a water access, access to a sufficient quantity of water at appropriate distances from their residence must also be considered.
Acknowledgements
The authors would like to thank Institut Hydro-Québec en environnement, développement et société (Institut EDS) for their financial support.
References
DAR, O.A. and KHAN, S.K. 2011 Millennium development goals and the water target: details, definitions and debate. Tropical Medicine and International Health Vol 16, No 5, pp.540-544.
DEVI, A. and BOSTOEN, K. 2009 Extending the critical aspects of the water access indicator using East Africa as an
example. International Journal of Environmental Health Research Vol 19, No 5, pp.329-341.
CAIRNCROSS, Sandy 1999 Trachoma & Water. Community Eye Health Vol 12, No 32, p.58-59.
JAMES, W.P.T. and SCHOFIELD, E.C. 1990 Human energy requirements. A manual for Planners and Nutritionists. Oxford University Press: New-York.
SOULE, R.S. and GOLDMAN, R.F. 1972 Terrain coefficients for energy cost prediction. Journal of Applied Physiology Vol 32, No 5, pp.706-708.
ONU 2015 Objectifs du Millénaire pour le développement: Rapport 2015. Organisation des Nations Unies. Département des affaires économiques et sociales de l’ONU.
WHO 2003 Domestic Water Quantity, Service Level and Health. World Health Organization. WHO Document Production Services: Geneva.
JMP 2015 WHO/UNICEF Joint Monitoring Programme (JMP) for Water Supply and Sanitation. www.wssinfo.org WHITE, Gilbert F., BRADLEY, David J. and White, Anne U. 1972 Drawers of Water. Domestic Water Use in East
Africa. The University of Chicago Press: Chicago and London.
Chapitre 3.
La pertinence des résultats obtenus dans le premier article justifie la rédaction d’un article plus complet sur le sujet. Il parut essentiel de confirmer que l’impact associé à l’ajout du temps de collecte dans l’indicateur d’accès était perçu à plus grande échelle. Offrant un portrait plus détaillé du temps de collecte, ce deuxième article permet de soulever les lacunes en termes d’accès à l’eau dans l’ensemble des pays les moins avancés de l’Afrique de l’Est et du Sud ainsi que de l’Asie du Sud (15 pays). La caractérisation du temps de collecte selon le milieu de résidence (urbain / rural) constitua un ajout essentiel pour assurer une plus grande précision quant aux estimations.
Access to Drinking Water in Least Developed Countries of Eastern
Africa, Southern Africa and Southern Asia
[Note1 : Ce chapitre est un article qui a été soumis le 1er août 2016 pour publication dans Transportation Research Record : Journal of the
Transportation Research Board (Ref. 17-02914). L’article fut refusé en octobre 2016 parce que l’aspect de transport n’était pas suffisamment
mis de l’avant. Certaines modifications ont ultérieurement été apportées au manuscrit soumis et apparaissent dans le présent chapitre. ]. [Note2 : Les références contenues dans ce chapitre sont celles de l’article original et sont rapportées indépendamment à la fin du présent chapitre]
[Note3 : Les renvois contenus dans ce chapitre réfèrent uniquement aux figures et tables du présent chapitre. Le préfixe C3 a été ajouté aux
figures et tables afin de rattacher les renvois au présent chapitre.]
Authors / Auteurs: Cassivi A, Waygood EOD & Dorea CC
Abstract / Résumé:
Despite the achievement of the Millennium Development Goals (MDGs) with regards to drinking water, time to collect water remains high in countries where water on premises is not commonly provided. In 2015, 42.5% of the world population did not have access to water on premises and needed to fetch it. By using collection time as a proxy, we aim to describe access to drinking water in the Least Developed Countries (LDC) of Southern Asia, Eastern Africa and Southern Africa. This study highlights the widespread burden of fetching water and the significant disparities between urban and rural areas. Results show that 25% of the Eastern and Southern African LDCs population need to walk more than 30 minutes. In all countries studied, the proportion of the population that need to walk more than 30 minutes to fetch water was found to be higher in rural than in urban areas. Considering the importance of time to fetch water on an individual’s health and well-being, we demonstrate how collection time impacts the coverage of access to water. Malgré la réalisation des Objectifs du Millénaire pour le développement (OMD) en ce qui concerne l’eau potable, le temps de collecte reste élevé dans les pays ou l’eau à domicile n’est pas communément fournie. En 2015, 42,5% de la population mondiale n’avait pas accès à l’eau à domicile et devait se déplacer pour la collecter. En utilisant le temps de collecte comme un proxy, nous cherchons à décrire l’accès à l’eau potable dans les pays les moins avancés (PMA) de l’Asie du Sud, de l’Afrique de l’Est et de l’Afrique du Sud. Cette étude met en évidence le fardeau généralisé de l’approvisionnement en eau et les disparités importantes entre les zones urbaines et rurales. Les résultats montrent que 25% de la population des PMA de l’Afrique de l’Est et de l’Afrique du Sud doit parcourir plus de 30 minutes pour collecter de l’eau. Dans tous les pays étudiés, la proportion de la population qui devait parcourir plus de 30 minutes était plus élevée dans les zones rurales que dans les zones urbaines. Compte tenu de l’importance du temps de collecte sur la santé et le bien-être des populations, nous démontrons comment le temps de collecte affecte les mesures d’accès à l’eau potable.
1. Introduction
Worldwide access to drinking water was reported to have increased from 76% in 1990 to 91% in 2015 (1). The proportion of the world’s population without access to an improved water source was reduced by half between 1990 and 2015, thus successfully attaining the target 7c of the Millennium Development Goals (MDGs) established in 2000. The progress was monitored by an indicator of the proportion of the country’s population using an improved drinking water source. (i.e. by the type of source and when it is properly used, an improved drinking water source adequately protects the source from outside contamination, particularly faecal matter (1)). However, this indicator has been criticised by several authors as, by taking into account only the technology of the source, this indicator for the most part omits quality, quantity and distance components (2-7).
The WHO’s definition of sustainable access to safe drinking water requires that certain criteria are met: access to drinking water means that the source is less than 1 kilometre away from its place of use and that it is possible to reliably obtain at least 20 litres per member of a household per day; safe drinking water is water with microbial, chemical and physical characteristics that meet WHO guidelines or national water quality standards (8). Considering that this definition of access to water includes measures of distance, quantity and quality, the question remains what the progress related to the proportion of the population with access to water would be if a more holistic measure was applied.
The aim of this present study is to describe access to water in terms of time needed to fetch water in the LDCs. The objectives of this study are to estimate the coverage of access to water in urban and rural areas by taking into account the impact of the distance on water fetching and thus giving a more accurate picture of where access to potable water is lowest and where efforts should be made towards the attainment of universal access to water.
2. Background
The proportion of the world’s population without access to an improved water source was reduced by half between 1990 and 2015, thus successfully attaining the target 7c of the Millennium Development Goals (MDGs) established in 2000. However, that is an average and certain countries did not achieve this goal. In countries that are designated as Least Developed Countries (LDC) (9), the target was not met since the proportion of the population with access to an improved water source only increased from 51% to 69%. In Southern Asia the target has been met in each LDC. However, in Eastern and Southern African LDC’s, only Ethiopia and Malawi has reduced by half the population with no access to an improved drinking water source.
Despite the high coverage of the world’s population with access to an improved water source, many people still do not have water on premises. According to the WHO and UNICEF Joint Monitoring Programme for Water Supply and Sanitation (JMP), in 2015 42% of the world’s population had no water on premises, meaning that they need to fetch water for their survival. Furthermore, in the LDCs, only 12% of the national population have access to water on premises in 2015. Disparities are also observed between urban and rural regions where the proportion of the population with access to water on premises in 2014 are respectively 32% and 3% in urban and rural areas (1). Further, previous
research has shown that the prevalence of the population without access to water on premises that need more than 30 minutes to collect water is higher in rural than in urban area in almost all Sub-Saharan countries (7).
Access to an improved drinking water source on premises needs to be raised. The task of fetching water can have different impacts on individual health. First, without access to piped water on premises, households are more likely to use alternative sources which can be located further away and, as a result, the quantity of water used is expected to be reduced (10) which is related health problems. The relationship between the distance to fetch water and the prevalence of water related diseases can be explained by the time associated to the trip and the possible quantity of water carried.
The relationship between the quantity of water used and the time to fetch water is non-linear. Previous research has shown that there is a steep decline from “on premises” to about three minutes, after which the amount used plateaus until 30 minutes where a further decline is observed. However, it was also shown that moving a source of water within 30 minutes will not necessarily enhance the water consumption unless the source is installed in the residence (10). Households with access to a piped water source will consume around three times more water per person compared to households without a piped connection (11; 12). An insufficient quantity of water available for consumption and hygiene enhance the exposition risk to feco-oral water-washed diseases (13). Globally, access to safe drinking water can prevent the incidence of diarrhoeal diseases that kills around 760,000 children under the age of five per year (14).
The problem related to personal health relates to time and energy costs expended through fetching water. Time and energy associated to collecting water can be considered lost at the expense other activities such as education, work, healthcare and childcare, which could lead to a lack of hygiene and other quality of life measures (15). Finally, the task of fetching water can result in different injuries like physical disorders, accident and violence (15; 16). Considering the impacts on the individual of health, time, and energy, the issue of water accessibility warrants further research. Taking into account that the current definition ignores distance, but that distance plays a crucial roles on those impacts, it is clear that including a distance measure in the portrait of accessibility will improve understanding of this critical problem.
3. Method
Countries classified as least developed by the United Nations were targeted for this study. This recognition is based on three criteria which are: the per capita income, human assets, and economic vulnerability. This group currently (as of May 2016) includes 48 countries (9). Countries from Eastern and Southern Africa (ESA) and Southern Asia (SA) regions of UNICEF were selected as the focus of this study because of their vulnerability in terms of access to water. In Eastern and Southern Africa, least developed countries (LDCs) are Burundi, Comoros, Eritrea, Ethiopia, Lesotho, Madagascar, Malawi, Mozambique, Rwanda, Somalia, South Sudan, United Republic of Tanzania, Zambia. Southern Asia LDC’s classified countries are Afghanistan, Bangladesh, Bhutan and Nepal.
Household surveys from the UNICEF Multiple Indicator Cluster Surveys (MICS) and USAID Demographic and Health Surveys (DHS) program were used in the analysis for each country. These datasets are available publicly and
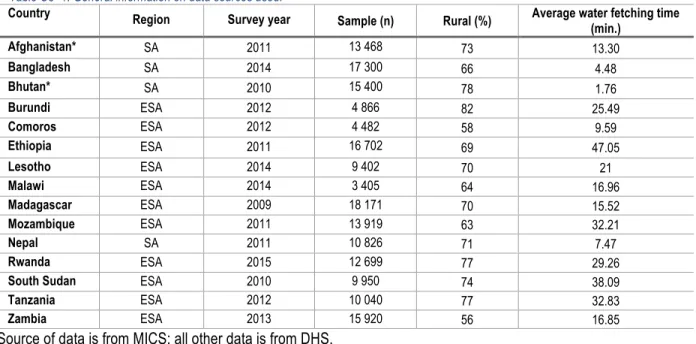
were downloaded online (17; 18). MICS and DHS surveys utilise a two-stage sample design and are nationally representative of the population. The two datasets use the same methodology and surveys for collecting information, thus they are compatible. Their results were compared for overlapping countries, and no statistically different results were found (analysis not shown in this paper). For this study, the most recent household survey for each country was selected. Eritrea and Somalia were excluded because no recent national datasets were accessible. A total of 15 countries were included in this study (Table C3-1).
Country Region Survey year Sample (n) Rural (%) Average water fetching time
(min.) Afghanistan* SA 2011 13 468 73 13.30 Bangladesh SA 2014 17 300 66 4.48 Bhutan* SA 2010 15 400 78 1.76 Burundi ESA 2012 4 866 82 25.49 Comoros ESA 2012 4 482 58 9.59 Ethiopia ESA 2011 16 702 69 47.05 Lesotho ESA 2014 9 402 70 21 Malawi ESA 2014 3 405 64 16.96 Madagascar ESA 2009 18 171 70 15.52 Mozambique ESA 2011 13 919 63 32.21 Nepal SA 2011 10 826 71 7.47 Rwanda ESA 2015 12 699 77 29.26
South Sudan ESA 2010 9 950 74 38.09
Tanzania ESA 2012 10 040 77 32.83
Zambia ESA 2013 15 920 56 16.85
*Source of data is from MICS; all other data is from DHS.
Different relevant variables were extracted from MICS and DHS datasets to be analysed: cluster number, household number, number of members per household, population weight, wealth index, region, type of place of residence, education level of head of household, source of drinking water, time to get to water source, location of water source and person fetching water. Of the variables available from the data set, the interval variable, "Time to get to the water source" reflects the time needed to fetch water as a round trip without consideration to the type of source. Previous research has found that after roughly three minutes, the quantity of water used by a household plateaus (10), but as this the time is not clearly stated (a graph demonstrates the relationship), and so here we use under five minutes as a threshold. Thus the variable was recoded in an ordinary categorical variable, which includes these categories "0 minutes", "Less than 5 minutes" "Between 5 and 30 minutes", "More than 30 minutes" and "Don’t know/ Missing". Second, with the available variables "Source of drinking water" and "Time to get to the water source", another variable was created to aggregate the different sources of water into service level categories: “Improved”, “On premises”, and “Improved source located at 30 minutes or less”. It is necessary to note that the category "On premises" only included people who answered that they have a source on their premise as the question asked the location of the source of water. Where the time to fetch water was not reported, the variable was coded as "On premises". This classification of the different sources was based on WHO/UNICEF JMP definitions of improved (i.e. Piped water into dwellings, piped water to yard/plot, public tab or standpipes, tubewell or borehole, protected dug well, protected spring and rainwater)
and unimproved (i.e. Unprotected spring, unprotected dug well, cart with a small tank/drum, tanker-truck, surface water, bottled of water) water sources (19). Bottles of water were considered as unimproved, excepted if the second source was an improved water source.
Finally, a variable “population weight” was created by multiplying the number of de jure members of the household (i.e. those that are usually present, regardless of whether they are present or absent at the time of the survey) by the existing household weight variable. Population weight was applied to all analysis in order to ensure an accurate representation of the national population. National results were also disaggregated by the type of place of residence to reduce disparities that can occur between urban and rural areas. The different analyses were conducted with STATA MP version 14.
4. Results 4.1 Collection time
Disparities in drinking water collection time are observed between Southern Asia (SA) and Eastern and Southern Africa (ESA), but also within the regions and among the countries (Figure C3-2).
In general, collection time is lower in Southern Asia countries than in Eastern and Southern African. The proportion of the population with access to water sources on site (0 minutes) is also greater in Southern Asia than in Eastern and Southern Africa with respective coverage of 69% and 16%. In Southern Asia, more than 25% of the population need more than 0 minutes but less than 30 minutes to fetch water. This proportion doubles in Eastern and Southern Africa where more than 55% of the population must walk up to 30 minutes to fetch water. The portion of the population who need to walk more than 30 minutes to fetch is 3% in Southern Asia, while in Eastern and Southern Africa nearly one quarter of the population (27%) must do so.
Within Southern Asia’s Least Developed Countries, important disparities can be observed between the countries. With coverage above 90%, Bhutan stands out from the other countries with a high level of access to water on site. At the opposite end, Afghanistan has an on-site coverage of 45% and the highest proportion of the population who need to walk more than 30 minutes to fetch water (8%).
In the Eastern and Southern African Least Developed Countries, time needed to collect water also varies. The proportion of the population with access to water on site is lower than 25% in all countries except Comoros where the coverage reaches 67% of the population. In more than one third of the countries, the proportion of the population with access on site is lower than 10% (Burundi; 6%, Ethiopia; 10%, Madagascar; 8%; South Sudan; 2%). Except in Comoros, the proportion of the population who need to walk more than 5 minutes to fetch water is higher than 65% for all of these LDCs. In South Sudan, 97% of the population walk more than 5 minutes to fetch water, which represents the highest proportion in all Eastern and Southern African LDCs.
Table C3- 2: Time needed to fetch water in minutes.
Country Survey/ Year Region N Population according to the time need to fetch water (%)
0 min < 5 min 5 -30 min > 30 min DK Southern Asia Afghanistan MICS 2011 Urban 3,681 74.2 0.4 20.58 3.9 0.92 Rural 9,787 36.93 1.64 49.94 9.2 2.3 National 13,468 43.52 1.42 44.74 8.26 2.06 Bangladesh DHS 2014 Urban 5,930 78.6 0.58 19.07 1.45 0.3 Rural 11,370 74.13 0.69 23.36 1.74 0.08 National 17,300 75.35 0.66 22.19 1.66 0.14 Bhutan MICS 2010 Urban 3,320 98 0.29 1.45 0.25 0.01 Rural 12,080 91.09 1.44 5.94 1.47 0.06 National 15,400 92.99 1.13 4.7 1.14 0.04 Nepal DHS 2011 Urban 3,148 79.16 1.59 17.72 1.42 0.12 Rural 7,678 54.98 1.17 40.57 3.23 0.05 National 10,826 58.17 1.22 37.56 2.99 0.06
Eastern and Southern Africa Burundi DHS 2012 Urban 880 53.07 3.32 35.97 7.61 0.02 Rural 3,986 0.62 1.37 70.11 27.84 0.07 National 4,866 5.59 1.55 66.87 25.92 0.06 Comoros DHS 2012 Urban 1,892 71.87 2.65 16.85 6.72 1.9 Rural 2,590 65.16 2.87 17.49 9.85 4.63 National 4,482 67.27 2.81 17.29 8.87 3.77 Ethiopia DHS 2011 Urban 5,112 49.08 1.28 36.13 13.22 0.29 Rural 11,590 1.37 1.42 52.84 44.2 0.17 National 16,702 9.96 1.39 49.83 38.62 0.19 Lesotho DHS 2014 Urban 2,798 69 2.4 25.48 3.06 0.05 Rural 6,604 6.14 4.47 65.21 23.93 0.25 National 9,402 23.5 3.9 54.24 18.16 0.2 Malawi DHS 2014 Urban 1,211 57.73 5.72 27.52 5.79 3.24 Rural 2,194 16.66 7.44 54.6 19.24 2.07 National 3,405 23.72 7.14 49.95 16.92 2.27 Madagascar DHS 2009 Urban 5,442 21.31 5.78 48.49 23.79 0.63 Rural 12,729 0.85 1.98 58.99 37.77 0.41 National 18,171 7.84 3.28 55.4 32.99 0.48 Mozambique DHS 2011 Urban 5,092 41.26 7.78 39.05 10.52 1.38 Rural 8,827 5.46 3.98 54.23 33.88 2.46 National 13,919 16.71 5.17 49.46 26.54 2.14 Rwanda DHS 2015 Urban 2,895 44.53 2.07 43.51 9.88 0 Rural 9,804 3.88 1.24 58.46 36.38 0.04 National 12,699 10.67 1.38 55.96 31.95 0.04 South Sudan DHS 2010 Urban 2,600 6.68 0.31 60.87 31.46 0.67 Rural 7,350 0.8 0.72 59.71 38.51 0.27 National 9,950 2.19 0.62 59.98 36.84 0.36 Tanzania DHS 2012 Urban 2,262 36.77 3.26 52.45 7.05 0.47 Rural 7,778 7.84 1.04 59.29 31.62 0.2 National 10,040 14.08 1.52 57.82 26.32 0.26 Zambia DHS 2013 Urban 6,957 47.6 6.01 39.34 6.4 0.64 Rural 8,963 9.81 2.76 69.3 15.99 2.14 National 15,920 24.62 4.04 57.56 12.23 1.55
In each country studied, without regarding to the region, similar trends can be observed. The proportion of the population with access to water on site (i.e. 0 minutes) is higher in urban than in rural areas. The most important difference between urban and rural on-site coverage is observed in Lesotho with a variation of 63%. In the Southern Asia LDCs the average proportion of the population who need to walk farther than 30 minutes is 1.8% in urban areas and 3.7% in rural areas; thus it is double in the rural areas. A larger difference can be found in the Eastern and Southern African LDCs where the urban and rural proportions are respectively 11% and 29% (nearly three times).
4.2 Distance as an indicator of access
Further to simply having access to an improved water source, the time needed to fetch water is an essential variable that needs to be considered in order to ensure an accurate picture of the access to water in Least Developed Countries. Three measures of access to an improved water source are shown in Figure C3-1. First, simply the percentage of the population with access to an improved source of water. Second, a threshold of 30 minutes’ collection time was added to that proportion. By considering that the improved water source needs to be located at no more than 30 minutes of distance from the point of use, the estimation of the proportion of the population with access to water at the national country scale will decrease from 0.5% to 3% with an average of 1.5% in Southern Asia (SA) and from 7 % to 23% with an average of 14% in Eastern and Southern Africa (ESA). More specifically, in Southern Asia, the average proportion of the population with access to an improved water slightly decreases from 86% to 84% with the addition of the 30 minutes threshold. In Eastern and Southern Africa, the average proportion of the population with access to an improved water source of 63% declines to 49% with that addition. In five countries, more than half of the population don’t have access to an improved water source at 30 minutes or less from the point of use: Ethiopia (33%), Madagascar (37%), Mozambique (41%), South Soudan (45%) and Tanzania (45%).
In urban areas, the difference between having access to an improved source and when the 30 minutes or less threshold is added oscillates from 0.2 % to 2.2% in SA and from 2.1% to 21.3% in ESA. Such differences are greater in rural areas where the proportion of the population with access to water decreases from 0.6% to 3.2% in SA and from 8% to 24.1% in ESA.
Significant differences are observed when the proportion of the population with access to an improved water source is disaggregated by the location of the source. Indeed, the proportion of the population with access to water on premises remains low, especially in ESA. Indeed, the coverage of access to improved water on premises only reaches 14% of the population at the national scale. Serious disparities are observed between areas in ESA where the coverage of access to water on premises in urban and rural areas is respectively 41% and 5%. In Southern Asia LDCs the average coverage of access to an improved water source is 66% at the national scale, 79% in urban areas and 63% in rural areas.
56.71 97.38 96.13 87.95 79.01 87.14 50.79 82.2 83.21 50.09 52.36 72.34 68.68 55.08 63.14 53.7 95.99 95.64 86.91 61.05 78 32.78 70.96 68.26 37.34 41.89 52.02 45.31 45.04 55.93 32.47 74.81 91.99 57.05 5.59 62.93 9.47 23.2 21.38 7.63 14.45 10.64 2.11 11.81 20.67 0 10 20 30 40 50 60 70 80 90 100 Afghanistan Bangladesh Bhutan Nepal Burundi Comoros Ethiopia Lesotho Malawi Madagascar Mozambique Rwanda South Sudan Tanzania Zambia So ut he rn As ia Ea st er n an d So ut he rn Af ric a Population (%)
Improved water source Improved water source by 30 minutes or less Improved water source on premises Figure C3- 1 : National population with access to water according to the indicator