Who are the most ‘violent’ young
adolescents?
Claire Gavray – Univ. Liège (Belgium)
Nicole Vettenburg – Univ. Gent (Belgium)
Ljubljana – 9-12 september 2009
Introduction
• Important issue
• Violence:
– attitude towards violence (valorisation of
violence)
– Gender
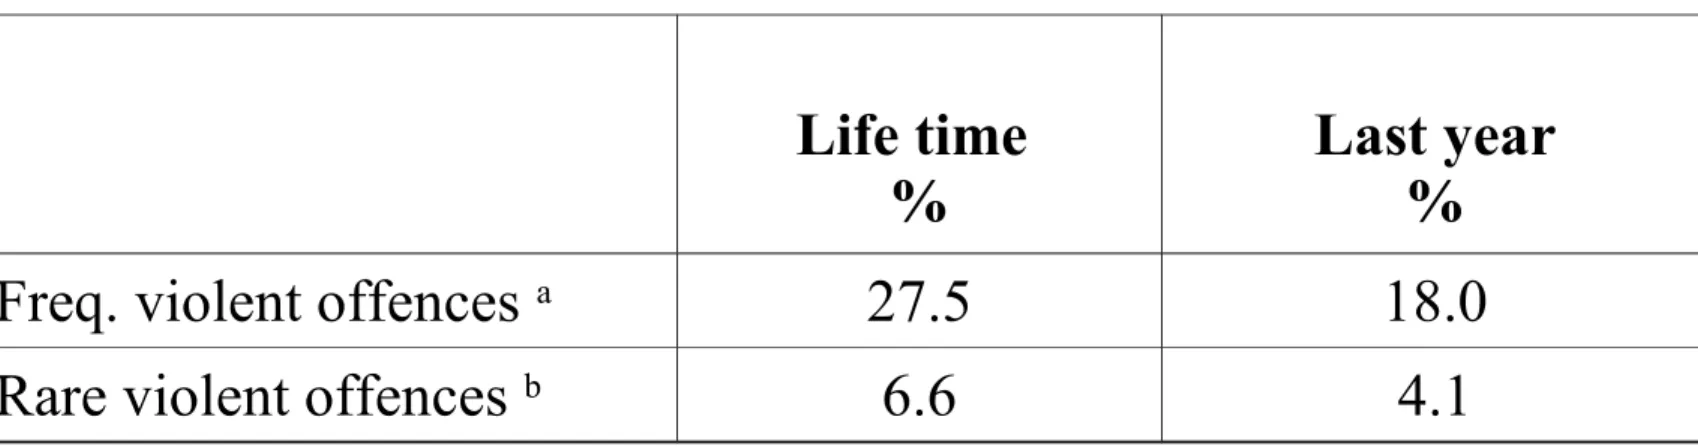
Tabel 1. Life-time and last year prevalence
Life time
%
Last year
%
Freq. violent offences
a27.5
18.0
Rare violent offences
b6.6
4.1
n = 2247, weighted data; prevalence based on valid cases
a group fight and carrying an object which can serve for protection or attack b pick pocketing/snatching, robbery/extortion, and assault
Delinquent behavior and attitude
Block 1: demographic Male 2.42 *** Age 1.08 Migrant (ref=native) 2nd generation 1.29 1st generation 0.98 Block 2: family Intact family 0.91Good relationship with mother 0.99 Good relationship with father 0.97
Tabel 2. Odds ratios of logistic regression for violent delinquent behaviours on demographic,
Block 3: school
Positive attitudes towards school 1.01 Negative attitudes towards school 1.28 *
Skip school 1.16
Grade (reference: 7th grade)
8th grade 0.69 9th grade 0.60 Block 4: lifestyle Alcohol 2.39 *** Drugs 2.28 *** Delinquent friends 2.23 *** Goes out 1.75 **
Time spent with (reference: alone)
Family 0.99 Friends 1.42 Discriminated 1.20 Victim 1.48 * Block 5:individual Low self-control 1.49 *
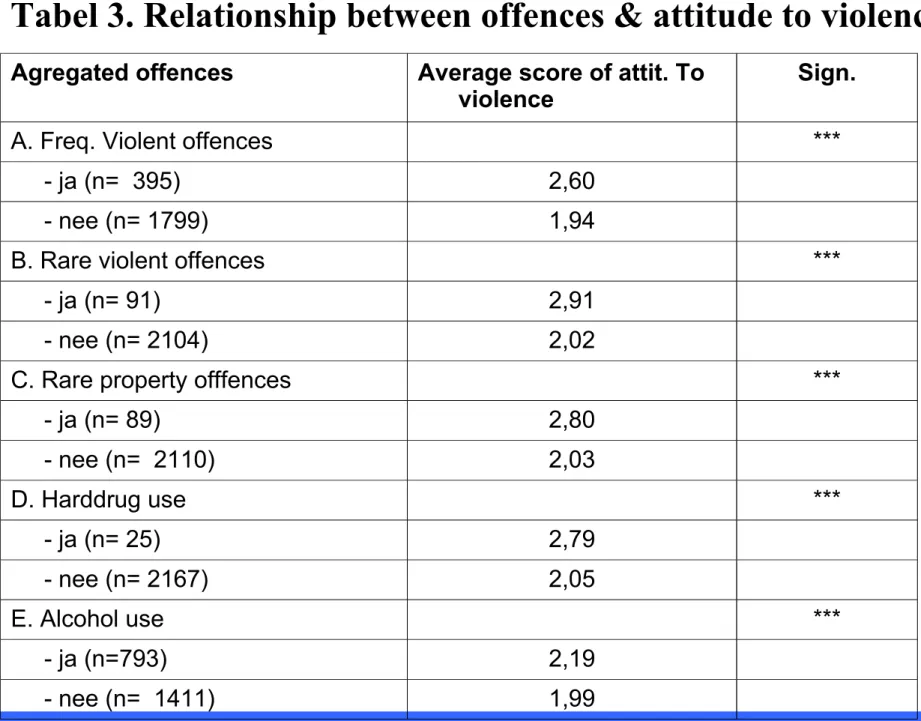
Agregated offences Average score of attit. To
violence Sign.
A. Freq. Violent offences ***
- ja (n= 395) 2,60
- nee (n= 1799) 1,94
B. Rare violent offences ***
- ja (n= 91) 2,91
- nee (n= 2104) 2,02
C. Rare property offfences ***
- ja (n= 89) 2,80 - nee (n= 2110) 2,03 D. Harddrug use *** - ja (n= 25) 2,79 - nee (n= 2167) 2,05 E. Alcohol use *** - ja (n=793) 2,19 - nee (n= 1411) 1,99
• In the descriptive analyses:
– Mutual relationship (behaviour – attitude)
– Gender differences concerning:
• Violence
Construction of a score of attitude towards
violence (valorisation)
Five items:
1. A bit of violence is part of the fun
2. One needs to make use of force to be respected
3. If somebody attacks me, I will hit him/her back
4. Without violence everything would be much more
boring
5. It is completely normal that men want to prove
themselves in physical fights with others
=> Possibility to answers: fully disagree – somewhat disagree –
Fully disagree
%
Girls
Boys
A bit of violence is part of the fun
57
32
One needs to make use of force to be respected
70
44
If somebody attacks me, I will hit him/her back
16
10
Without violence everything would be much more
boring
66
45
It is completely normal that men want to prove
themselves in physical fights with others
41
33
Creation of a new variable ‘highest attitude’:
in each gendergroup
=> 25% highest valorisation versus 75%
• Girls: 25% of 1096=280
• Boys: 25% of 1151= 323
Analyses:
– First step: total group (boys + girls)
Results: A. Total group
• Significant correlation between attitude to violence and:
– Problems of physical wealth and number of accidents
– High self-evaluated level of crime at school (a lot of
stealing, fighting, vandalism drugs…)
– School problems (repeating, truancy)
– Surinvestment in their group of friends, specially delinquent
ones
– Negatives relations with the parents, especially with mother
– Low level of selfcontrol
– Use of alcohol and drugs (own and parent’s ones)
– Delinquency rates and especially violent behaviour
Results: B. Gender groups
Similarities:
– use of alcohol and drugs
– physical wealth and number of accidents
– delinquency rates and especially violent behaviour
– level of selfcontrol
– surinvestment in group of friends, specially in
delinquent one
– desinvestment in school and schooling
– self-evaluated level of crime at school
– quality of relationships with parents
Differences:
Already differences concerning those factors between
boys and girls valorising most violence
• Relationships with peers
Member of a ‘gang’
54% boys 39% girls
Mixed group
• Relationships with school
girls
boys
repeated a grade
X X
truancy
X X
realistic self-eval.achievement X
like school X
good relationships / teachers X
>
boys : broader instrumental conception of school…
Very significant differences directly visible
in explicative analyses
Concerning
• Family, social and cultural characteristics
(Only) all those discriminant gender variables in a
explicative model of attitude towards violence
²girls boys Pr> F Pr > F • Depression 0.25 0.92 • Recently hit 0.04 0.78 • Birthplace 0.24 0.19 • Family omposition 0.02 0.33 • Father’s diplôme 0.40 0.90 • Mother at work 0.13 0.15
• Other spoken language 0.02 0.11 • Relations with mother 0.16 0.16 • Relations with facther 0.44 0.86
• Lost a brother or… 0.03 0.81
• Leisure otherwise than family 0.53 0.03
Signification of the model Pr > F 0.02 0.10