HAL Id: hal-00317612
https://hal.archives-ouvertes.fr/hal-00317612
Submitted on 7 Sep 2004
HAL is a multi-disciplinary open access
archive for the deposit and dissemination of
sci-entific research documents, whether they are
pub-lished or not. The documents may come from
teaching and research institutions in France or
abroad, or from public or private research centers.
L’archive ouverte pluridisciplinaire HAL, est
destinée au dépôt et à la diffusion de documents
scientifiques de niveau recherche, publiés ou non,
émanant des établissements d’enseignement et de
recherche français ou étrangers, des laboratoires
publics ou privés.
Retrieval of water vapor using SSM/I and its relation
with the onset of monsoon
R. P. Singh, S. Dey, A. K. Sahoo, M. Kafatos
To cite this version:
R. P. Singh, S. Dey, A. K. Sahoo, M. Kafatos. Retrieval of water vapor using SSM/I and its relation
with the onset of monsoon. Annales Geophysicae, European Geosciences Union, 2004, 22 (8),
pp.3079-3083. �hal-00317612�
SRef-ID: 1432-0576/ag/2004-22-3079 © European Geosciences Union 2004
Annales
Geophysicae
Retrieval of water vapor using SSM/I and its relation with the onset
of monsoon
R. P. Singh1,2, S. Dey1, A. K. Sahoo2, and M. Kafatos2
1Department of Civil Engineering, Indian Institute of Technology Kanpur-208016, India
2School of Computational Sciences, George Mason University, Fairfax, Virginia 22030, USA
Received: 23 February 2004 – Revised: 3 June 2004 – Accepted: 21 June 2004 – Published: 7 September 2004
Abstract. The seasonal variations and interannual variability
of total precipitable water (TPW) deduced from the Special Sensor Microwave Imager (SSM/I) satellite over oceanic re-gions of the Indian sub-continent during the years between 1988 to 1998 show characteristic behavior. The weekly pat-terns of TPW are found to be closely related to the dynam-ics of the climatic conditions and the onset date of monsoon. The present results show that the satellite monitoring of TPW may prove as a good and reliable indicator in forecasting In-dian monsoon.
Key words. Meteorology and atmosphereic dynamics
(cli-matology; tropical meteorology) – Oceanography; general (ocean prediction)
1 Introduction
Water vapor plays a major role in the dynamics of atmo-spheric circulation, as well as in radiation exchange with the atmosphere (Ross and Elliott, 1996). The knowledge of to-tal water vapor has paramount importance to the understand-ing of monsoon behavior, which, in turn, helps in weather forecasting. Numerous scientists have successfully deduced the surface temperature over land and ocean (McFarland et al., 1990), TPW over ocean surface (Alishouse et al., 1990), rainfall and clouds over oceanic region (Ferraro et al., 1996; Prabhakar et al., 1982; Stephens, 1990; Weng and Grody, 1994) and atmospheric water vapor over ocean (Schluessel and Emery, 1990) using passive microwave remote sensing data. Singh et al. (2000) have analyzed the monthly and seasonal TPW over the Arabian Sea and the Bay of Ben-gal, and have found a close relationship with monsoon. Si-mon and Joshi (1994) have studied the changes in TPW from NOAA/TOVS over various regions of the Indian Ocean, the Bay of Bengal and the Arabian Sea. Recently, Simon et al. (2001) have found a sharp increase in water vapor three Correspondence to: R. P. Singh
weeks before the onset of monsoon, based on Multi-scanner Microwave Radiometer (MSMR) data for a limited period of April–June 2000.
In the present paper, weekly and monthly averaged TPW over the Indian oceanic region (0–15◦N, 60–80◦E) for the years between 1988 to 1998 have been analyzed during May and June to examine the behavior of TPW over the Arabian Sea and the Indian Ocean around the monsoon onset period. The monthly averaged latitudinal variations of TPW have been compared with the sea surface temperature (SST) dur-ing 1994 to 1998. The onset dates of monsoon durdur-ing 1988– 1998 show a characteristic behavior, showing maxima TPW
near the southern Indian coast (10–15◦N) where the
mon-soon hits first. Efforts have been made further to find a close relation to the daily TPW with the onset dates of monsoon. Due to poor temporal resolution of SSM/I data, the present study is based on six days of averaged TPW, which show a maxima peak of TPW about 8–9 days prior to the onset day of monsoon.
2 SSM/I Data
SSM/I is flown on the Defense Meteorological Satellite Pro-gram (DMSP) Block 5D-2F8 spacecraft in a circular Sun-synchronous near-polar orbit at an altitude of 833 km with an inclination of 98.8◦ and an orbit period of 102.0 min. The orbit produces 14.1-full orbit rotation per day, and has a 06:13 a.m. local ascending node equatorial crossing. The SSM/I is a seven-channel, four-frequency, linearly polarized,
passive microwave radiometric system. It receives
verti-cally and horizontally linearly polarized radiations at 19.35, 37.0 and 85.5 GHz and only vertically polarized radiation at 22.235 GHz. The sensor samples every 12.5 km along-track at 85.5 GHz and every 25.0 km in all other frequen-cies (Hollinger, 1991). SSM/I covers the whole globe in two days with some gaps in data. The NOAA/NASA Pathfinder Programme EASE-Grid brightness temperature data have been obtained from the National Snow and Ice Data Center,
3080 R. P. Singh et al.: Retrieval of water vapor using SSM/I 9 Jun (4th) Jun (2nd) Jun (3rd) May (4th) Jun (1st) 35 40 45 50 50 50 40 50 45 50 55 55 50 50 50 45 45 50 60 45 55 50 60 65 50 45 6065 55 55 60 65 55 50 55 50 60 65 70 60 65 45 50 55 55 55 65 65 65 60 55 55
Fig. 1. Weekly variations of TPW prior and after monsoon onset during 1997 (June 2nd week figure corresponds to the monsoon onset week)
Fig. 1. Weekly variations of TPW (kg/m2) prior and after onset of monsoon during 1997 (June 2nd week figure corresponds to the monsoon
onset week).
Table 1. Monsoon onset day during 1988 to 1998 (from Indian Meteorological Department, Pune).
Year 1988 1989 1990 1991 1992 1993 1994 1995 1996 1997 1998
R. P. Singh et al.: Retrieval of water vapor using SSM/I 3081
10
Fig. 3a. Monthly Variations of TPW with Indian Ocean SST (IO SST) during 1994
to 1998 in 0-50 N (arrows indicate onset month of monsson)
26 27 28 29 30 31 32 Jan -94 Apr-94Jul-94Oct-9 4 Jan -95 Apr-95Jul-9 5 Oct-95Jan -96 Apr-9 6 Jul-96Oct-9 6 Jan -97 Apr-97Jul-97Oct-97Jan -98 Apr-98Jul-9 8 Oct-98 Month SS T (C ) 20 25 30 35 40 45 50 55 60 TP W (k g /m 2) IO SST (0 - 5 N, 66 - 72 E) TPW (0 - 5 N, 66 - 72 E)
Fig. 2. Scatter Plot between SSMI derived TPW and MSMR derived TPW for June 2000
y = 0.953x + 2.4206 R2 = 0.9829 25 30 35 40 45 50 55 60 25 30 35 40 45 50 55 60 SSM/I Derived TPW (kg/m2) MSM R Der iv e d T P W (k g/ m 2)
Fig. 2. Scatter Plot between SSMI derived TPW and MSMR
de-rived TPW for June 2000.
Boulder, Colorado, USA. The weekly and monthly averaged TPW (kg/m2) over the Indian sub-continent have been calcu-lated using the following algorithm (Alishouse et al., 1990):
TPW = 232.89 − 0.1486(TB19V) −0.3695(TB37V)
[−1.8291 − 0.006193(TB22V)](TB22V) , (1)
where TB19V, TB37V and TB22Vare brightness temperatures
at 19.35, 37 and 22.235 GHz in vertical polarization, respec-tively.
The TPW retrieved from SSM/I has been compared with the TPW retrieved from IRS P4 multifrequency scanning mi-crowave radiometer (MSMR) data of the same region using the algorithm given in Eq. (1). IRS P4 MSMR sensors on-board IRS–P4 (Oceansat - 1) which was launched by the In-dian Space Research Organisation on 26 May 1998. The MSMR provided global microwave brightness temperature measurements at 6.6, 10.65, 18.0 and 21.0 GHz frequencies with vertical and horizontal polarizations. For TPW calcula-tion using MSMR data, algorithm (Eq. 1) developed by Al-ishouse et al. (1990) was used with the brightness temper-ature 18 and 21 GHz vertical polarization instead of 19 and 22 GHz.
3 Results and discussion
Using Eq. 1, weekly averaged TPW have been computed to examine the behavior of TPW in the week of the onset of monsoon at the Kerala coast. Weekly variations of TPW over the adjacent oceanic regions bounded by 60 to 100◦E longi-tude and 0 to 25◦N latitude have been analyzed two weeks prior and two weeks after the monsoon onset. The behav-ior of TPW for the onset week of monsoon and two weeks prior and after the onset week are found to be very similar, with little change between 1988–1998. In Fig. 1, an exam-ple of TPW behavior for two weeks prior and two weeks af-ter the onset week of monsoon has been shown for the year 1997. The TPW over the Arabian Sea changes significantly
10
Fig. 3a. Monthly Variations of TPW with Indian Ocean SST (IO SST) during 1994
to 1998 in 0-50 N (arrows indicate onset month of monsson)
26 27 28 29 30 31 32 Jan -94 Apr-94Jul-94Oct-9 4 Jan -95 Apr-95Jul-9 5 Oct-95Jan -96 Apr-9 6 Jul-96Oct-9 6 Jan -97 Apr-97Jul-97Oct-97Jan -98 Apr-98Jul-9 8 Oct-98 Month SS T (C ) 20 25 30 35 40 45 50 55 60 TP W (k g /m 2) IO SST (0 - 5 N, 66 - 72 E) TPW (0 - 5 N, 66 - 72 E)
Fig. 2. Scatter Plot between SSMI derived TPW and MSMR derived TPW for June 2000
y = 0.953x + 2.4206 R2 = 0.9829 25 30 35 40 45 50 55 60 25 30 35 40 45 50 55 60 SSM/I Derived TPW (kg/m2) MSM R Der iv e d T P W (k g/ m 2) (a) 11
Fig. 3c. Monthly Variations of TPW with Arabian Sea SST (AS SST) during 1994
to 1998 in 10 – 150 N (arrows indicate onset month of monsoon)
Fig. 3b. Monthly Variations of TPW with Arabian Sea SST (AS SST) during 1994
to 1998 in 5 – 100 N (arrows indicate onset month of monsson)
27 28 29 30 31 32 Jan -94 Apr-94Jul-94Oct-94Jan -95 Apr-95Jul-95Oct-95Jan-96Apr-96Jul-96Oct-96Jan-9 7 Apr-97Jul-9 7 O ct-97 Jan -98 Apr-98Jul-9 8 Oct-98 Month SS T (C ) 20 25 30 35 40 45 50 55 60 TP W ( k g/ m 2) AS SST (5 - 10 N, 66 - 72 E) TPW (5 - 10 N, 66 - 72 E) 27 28 29 30 31 Jan -94 Apr -94 Jul-94Oct-94Jan -95 Apr-9 5 Jul-95Oct-95Jan -96 Apr-9 6 Jul-96Oct -96 Jan -97 Apr-97Jul-97Oct-97Ja n-98 Apr-9 8 Jul-98Oct-98 Month SS T ( C ) 20 25 30 35 40 45 50 55 60 TP W ( kg /m 2) AS SST (10 - 15 N, 66 - 72 E) TPW (10 - 15 N, 66 - 72 E) (b) 11
Fig. 3c. Monthly Variations of TPW with Arabian Sea SST (AS SST) during 1994
to 1998 in 10 – 150 N (arrows indicate onset month of monsoon)
Fig. 3b. Monthly Variations of TPW with Arabian Sea SST (AS SST) during 1994
to 1998 in 5 – 100 N (arrows indicate onset month of monsson)
27 28 29 30 31 32 Jan -94 Apr-94Jul-94Oct-94Jan -95 Apr-95Jul-95Oct-95Jan -96 Apr-96Jul-96Oct-96Jan -97 Apr-97Jul-9 7 O ct-97 Jan -98 Apr-98Jul-9 8 Oct-98 Month SS T (C ) 20 25 30 35 40 45 50 55 60 TP W ( k g/ m 2) AS SST (5 - 10 N, 66 - 72 E) TPW (5 - 10 N, 66 - 72 E) 27 28 29 30 31 Jan -94 Apr -94 Jul-94Oct-94Jan -95 Apr-9 5 Jul-95Oct-95Jan -96 Apr-9 6 Jul-96Oct-96Jan -97 Apr-97Jul-97Oct-97Ja n-98 Apr-9 8 Jul-98Oct-98 Month SS T ( C ) 20 25 30 35 40 45 50 55 60 TP W ( kg /m 2) AS SST (10 - 15 N, 66 - 72 E) TPW (10 - 15 N, 66 - 72 E) (c) Fig. 3. Monthly variations of TPW with SST during 1994 to 1998
in (a) 0–50◦N, (b) 5–10◦N and (c) 10–15◦N.
(see the contour values of TPW) before and after the mon-soon onset. During the onset of monmon-soon in the year 1997 (2nd week of June, Table 1), the maximum TPW value of
55 kg/m2 is found over the Arabian Sea coast. The
maxi-mum value of TPW persisted for about a week after the on-set of monsoon in the second week, and afterwards the TPW
3082 R. P. Singh et al.: Retrieval of water vapor using SSM/I
12
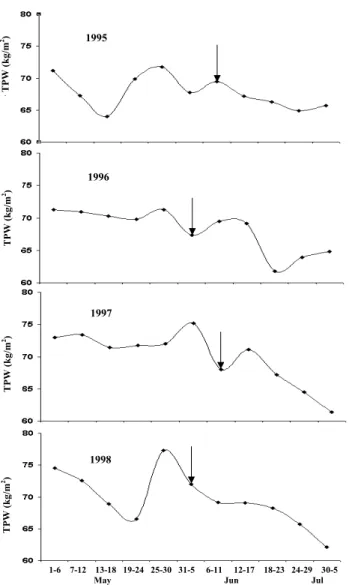
Fig. 4. Weekly Variations of TPW in the latitude zone 10 - 150 N for 1995 – 1998
(arrows indicate onset week of monsoon)
1-6 7-12 13-18 19-24 25-30 31-5 6-11 12-17 18-23 24-29 30-5 May Jun Jul
1995 1996 1997 1998 TPW (kg/ m 2) TPW (kg/ m 2) TPW (kg/ m 2) TPW (kg/ m 2)
Fig. 4. Weekly variations of TPW in the latitude zone 10–15◦N for 1995–1998.
value decreased during the 4th week. Such type of system-atic behavior has been observed during 1988 to 1998, but the results are shown here for the year 1997 only. It is difficult to validate the TPW deduced from satellite data especially over the ocean, however, we have shown the correlation between TPW obtained from SSM/I and MSMR (IRS-P4 Oceansat) sensors. We have compared the TPW retrieved from SSM/I with the TPW retrieved from MSMR for the same region. Here, one may note that the SSM/I data was available in the grid resolution of 25 km×25 km and MSMR data was avail-able in the grid of 50 km×50 km, the brightness temperature data were extracted for same bounded region and averaged for the month of June 2000 for comparison. The comparison of TPW retrieved from SSM/I and MSMR (Fig. 2) shows a very high correlation (R2=0.98). The details of the com-parison of SSM/I and MSMR data has also been discussed recently by Varma et al. (2002).
Figure 3 shows the variations of TPW and SST over the Indian Ocean and the Arabian Sea during 1994 to 1998 for
0–5◦N (Fig. 3a), 5–10◦N (Fig. 3b) and 10–15◦N (Fig. 3c)
latitude and 66–72◦longitude zones. The arrows show the
onset month of the monsoon over the Kerala coast of India. For latitudinal zone 0–5◦N, no correlation of TPW and SST has been observed (Fig. 3a), whereas for other latitude zones, higher correlation of TPW and SST (of the Indian Ocean and the Arabian Sea) are clearly seen (Figs. 3b and c). The
max-imum value of SST (∼30◦C or more) in the 5–15◦N
lati-tude zone is found one month prior to the maximum value of TPW or the onset of monsoon. The maxima of TPW shows a close relationship with the onset date of monsoon, which also has a close relationship with the SST of the Indian Ocean (IO SST). The close correlation shows that the monitoring of SST may give early information about the onset of monsoon one month prior to the TPW. The trend of increase of TPW to maximum after an increase in IO SST and SST of the Ara-bian Sea (AS SST) in the 5–15◦N latitude zone indicates the onset month of monsoon at the Kerala coast.
In order to examine a close relationship with TPW and the onset day of monsoon, six days averaged TPW have been computed. Due to poor daily temporal coverage, six days of averaged TPW has been considered for better accuracy and better temporal coverage, although the SSM/I sensor cov-ers the whole globe in two days with few areas missing in data due to various limitations. Figure 4 shows the varia-tions of six days of averaged TPW over the latitude region 10–15◦N and longitude 66–72◦E for the period 1995–1998.
In the latitude zone 10–15◦, maximum TPW is seen 7–12
days prior to the onset of monsoon. Maximum increase in
TPW (∼10 kg/m2) is seen in the year 1998 compared to a
3–5 kg/m2increase in the years 1995–1997 (Fig. 4), which may be attributed to the El-Nino effect. The TPW is seen to decrease during and after the week of the monsoon onset. We have also analyzed six days of averaged TPW for the 0– 5◦N and 5–10◦N latitude zones, but no significant relations of TPW with the monsoon onset were found.
4 Conclusion
The weekly and monthly variations of TPW over the Arabian Sea and the Indian Ocean are well correlated with onset day of monsoon over the Indian sub-continent. The maximum value of TPW in the 10–15◦N latitude zone is seen to appear 7–12 days prior to the monsoon onset at the Kerala coast and so this zone is a key zone for Indian summer monsoon pre-diction. The analysis of monthly TPW and SST data in the 5–15◦N latitude zone indicates the onset month of the mon-soon. Further, the analysis of six days averaged data of TPW reveals close relation of TPW with monsoon onset only in the 10–15◦N latitude zone. The present results suggest that the launch of microwave sensors with better spatial and tem-poral coverage may prove to be very useful useful to predict the onset of the Indian monsoon on the Kerala coast.
Acknowledgements. The NOAA/NASA Pathfinder Programme
EASE-Grid brightness temperature data were obtained from the Na-tional Snow and Ice Data Center, Boulder, Colorado, USA. We are grateful to M. Rajeevan, IMD, Pune for providing us monsoon on-set date. The SST data were supplied by IMD, Pune. One of the authors (RPS) is grateful to Space Application Center, Ahmedabad for the availability of MSMR data through Announcement of Op-portunity Program. We are grateful to the anonymous reviewer for his comments/suggestions which have helped us to improve the cur-rent version of the paper.
Topical Editor O. Boucher thanks a referee for her/his help in evaluating this paper.
References
Alishouse, J. C., Snyder, S. A., Jennifer, V., and Ferraro, R. R.: De-termination of oceanic total precipitable water from the SSM/I, IEEE Transactions on Geoscience and Remote Sensing, 28, 811– 816, 1990.
Ferraro, R. R., Weng, F., Grody, N. C., and Basist, A.: An eight-year (1987–1994) time series of rainfall, clouds, water vapor, snow cover, and sea ice derived from SSM/I measurements, Bull. American Meteorological Society, 77, 891–905, 1996.
Hollinger, J.: DMSP SSM/I calibration/validation, Final Report, parts 1 and 2, Nav. Res. Lab., Washington, D.C., 1991.
McFarland, M. J., Miller, R. L., and Neale, C. M. U.: Land surface temperature derived from the SSM/I passive microwave bright-ness temperatures, IEEE Transactions on Geoscience and Re-mote Sensing, 28, 839–845, 1990.
Prabhakar, C., Chang, H. D., and Chang, A. T. C.: Remote Sensing of Precipitable Water over the Oceans from Nimbus 7 Microwave Measurements, J. Appl. Met., 21, 59–68, 1982.
Ross, R. J. and Elliott, W. P.: Tropospheric Water Vapor Clima-tology and Trends over North America: 1973-93, J. Climate, 9, 3561–3574, 1996.
Schluessel, P., and Emery, W. J.: Atmospheric water vapour over oceans from SSM/I measurements, Int. J. Remot., 11, 753, 1990. Simon, B. and Joshi, P. C.: Determination of moisture changes prior to the onset of south-west monsoon over Kerala using NOAA TOVS satellite data, Meteorol. Atmos. Phys., 53, 223–231, 1994. Simon, B., Joshi, P. C., Thapliyal, P. K., Pal, P. K., Sarkar, A., Bha-tia, R. C., Jain, R. K., Singh, D., Mukherjee, S. K., and Gupta, H. V.: Monsoon onset-2000 monitored using multi-frequency mi-crowave radiometer on-board Oceansat-1, Current Sci., 81, 647– 651, 2001.
Singh, R. P., Mishra, N. C., Verma, A., and Ramaprasad, J.: Total Precipitable Water over Arabian and Bay of Bengal using SSM/I Data, Int. J. Remot., 21, 2497–2503, 2000.
Stephens, G. L.: On the Relationship between Water Vapor over the Oceans and Sea Surface Temperature, J. Climate, 3, 634–645, 1990.
Varma, A. K., Goirala, R. M., Mathur, A. K., Gohil, B. S. and Agar-wal, V. K.: Intercomparison of IRS-P4-MSMR derived geophys-ical products with DMSP-SSM/I and TRMM-TMI finished prod-ucts, Proc. Indian Acad. Sci. (Earth Planet. Sci.), 111, 247–256, 2002.
Weng, F., and Grody, N. C.: Retrieval of cloud liquid water using the special sensor microwave imager (SSM/I), J. Geophys. Res., 99, 25 535–25 551, 1994.