arXiv:astro-ph/0607170v1 10 Jul 2006
The XMM-LSS Survey: A well controlled X-ray cluster sample over
the D1 CFHTLS area
⋆
M. Pierre
1†, F. Pacaud
1, P.-A. Duc
1, J.P. Willis
2, S. Andreon
3, I. Valtchanov
4‡
B. Altieri
5, G. Galaz
6, A. Gueguen
1, J.-P. Le F`evre
7, O. Le F`evre
8, T. Ponman
9,
P.-G. Sprimont
10, J. Surdej
10,
C. Adami
8, A. Alshino
9, M. Bremer
11, L. Chiappetti
12, A. Detal
10, O. Garcet
10, E. Gosset
10,
C. Jean
10, D. Maccagni
12, C. Marinoni
8, A. Mazure
8, H. Quintana
6, A. Read
131DAPNIA/SAp CEA Saclay, 91191 Gif sur Yvette
2Department of Physics and Astronomy, University of Victoria, Elliot Building, 3800 Finnerty Road, Victoria, BC, V8P 1A1 Canada. 3INAF – Osservatorio Astronomico di Brera, Milan, Italy.
4Astrophysics Group, Blackett Laboratory, Imperial College of Science Technology and Medicine, London SW7 2BW, UK. 5ESA, Villafranca del Castillo, Spain.
6Departamento de Astronom´ia y Astrof´isica, Pontificia Universidad Cat´olica de Chile, Santiago, Chile. 7DAPNIA/SEDI CEA Saclay, 91191 Gif sur Yvette
8Laboratoire d’Astrophysique de Marseille, France
9School of Physics and Astronomy, University of Birmingham, Edgebaston, Birmingham B15 2TT, UK. 10Universit´e de Li`ege, All´ee du 6 Aoˆut, 17, B5C, 4000 Sart Tilman, Li`ege Belgium.
11Department of Physics, University of Bristol, Tyndall Avenue, Bristol BS8 1TL, UK. 12INAF – IASF Milan, Italy.
13Department of Physics and Astronomy, University of Leicester, Leicester LE1 7RH, UK.
Accepted for publication in MNRAS - July 2006
ABSTRACT
We present the XMM-LSS cluster catalogue corresponding to the CFHTLS D1 area. The list contains 13 spectroscopically confirmed, X-ray selected galaxy clusters over 0.8 deg2to a
redshift of unity and so constitutes the highest density sample of clusters to date. Cluster X-ray bolometric luminosities range from 0.03 to 5 × 1044erg s−1. In this study, we describe our
catalogue construction procedure: from the detection of X-ray cluster candidates to the compi-lation of a spectroscopically confirmed cluster sample with an explicit selection function. The procedure further provides basic X-ray products such as cluster temperature, flux and lumi-nosity. We detected slightly more clusters with a (0.5-2.0 keV) X-ray fluxes of > 2 × 10⁻¹⁴erg
s−1cm−2than we expected based on expectations from deep ROSAT surveys. We also present
the Luminosity-Temperature relation for our 9 brightest objects possessing a reliable tempera-ture determination. The slope is in good agreement with the local relation, yet compatible with a luminosity enhancement for the 0.15 < z < 0.35 objects having 1 < T < 2 keV, a population that the XMM-LSS is identifying systematically for the first time. The present study permits the compilation of cluster samples from XMM images whose selection biases are understood. This allows, in addition to studies of large-scale structure, the systematic investigation of clus-ter scaling law evolution, especially for low mass X-ray groups which constitute the bulk of our observed cluster population. All cluster ancillary data (images, profiles, spectra) are made available in electronic form via the XMM-LSS cluster database.
Key words: X-ray surveys - clusters of galaxies
⋆ Based on data collected with XMM, VLT, Magellan, NTT, and CFH
tele-scopes; ESO programme numbers are: 070.A-0283, 070.A-907 (VVDS), 072.A-0104, 072.A-0312, 074.A-0360, 074.A-0476
1 INTRODUCTION
The question of cosmic structure formation is substantially more complicated than the study of the spherical collapse of a pure dark matter perturbation in an expanding Universe. While it is possible to predict theoretically how the shape of the inflationary fluctua-tion spectrum evolves until recombinafluctua-tion, understanding the sub-sequent formation of galaxies, AGN and galaxy clusters is compli-cated by the physics of non-linear growth and feedback from star formation. Attempts to use the statistics of visible matter fluctua-tions to constrain the nature of Dark Matter and Dark Energy are therefore reliant upon an understanding of non-gravitational pro-cesses.
Clusters, as the most massive entities of the Universe, form a crucial link in the chain of understanding. They lie at the nodes of the cosmic network, possess virialized cores, yet are still growing by accretion along filaments. The rate at which clusters form, and the evolution of their space distribution, depends strongly on the shape and normalization of the initial power spectrum, as well as on the Dark Energy equation of state (e.g. Rapetti et al. 2005). Con-sequently, both a three dimensional map of the cluster distribution and an evolutionary model relating cluster observables to cluster masses and shapes (predicted by theory for the average cluster pop-ulation) are needed to test the consistency of structure formation models within a standard cosmology with the properties of clusters in the low-z Universe.
The main goal of the XMM Large Scale Structure Survey (XMM-LSS) is to provide a well defined statistical sample of X-ray galaxy clusters to a redshift of unity over a single large area, suitable for cosmological studies (Pierre et al. 2004). In this paper, we present the first sample of XMM-LSS clusters for which canon-ical selection criteria are uniformly applied over the survey area. In this way, we demonstrate the properties of the survey along with a description of data analysis tools employed in the sample construc-tion; the aim being to provide a deep and well controlled sample of clusters and to investigate evolution trends, in particular for the low end of the cluster mass function. The paper will therefore act as a reference for future studies using XMM-LSS data. The chosen region is located at 36 < R.A.(deg.) < 37, −5 < Dec.(deg.) < −4. This region is known as D1, one of the four Deep areas of the Canada-France-Hawaii-Telescope Legacy Survey1 (CFHTLS). It also includes one of the VIMOS VLT Deep Survey patches (VVDS; Ilbert et al. 2005) and was observed at 1.4 GHz down to the µJy level by the VLA-VIRMOS Deep Field (Bondi et al. 2003). The rest of the XMM-LSS survey surrounds D1 and corresponds to part of the wide W1 CFHTLS component (see Pierre et al. (2004) for a general lay-out and associated multi-λ surveys) for which the com-plete cluster catalogue will be published separately. The sample is the result of a fine tuned X-ray plus optical approach developed with the aim of understanding the various selection effects. We de-scribe the catalogue construction procedure in tandem with a com-panion paper presenting a detailed description of the X-ray pipeline developed as part of the XMM-LSS survey (Pacaud et al. 2006).
The deepest published statistical samples of X-ray clusters over a contiguous sky area to date are all based on the ROSAT All-Sky Survey (RASS): REFLEX (B¨ohringer et al. 2001), NO-RAS (B¨ohringer et al. 2000), NEP (Henry et al. 2001). In parallel, a number of serendipitous cluster surveys were conducted using deep ROSAT pointings with the goal of investigating the evolution of the cluster luminosity function e.g. Southern SHARC (Burke et al.
1 http://cdsweb.u-strasbg.fr:2001/Science/CFHLS/
1997), RDCS (Rosati et al. 1998), 160 deg2(Vikhlinin et al. 1998), Bright SHARC (Romer et al. 2000), BMW (Moretti et al. 2004). The advent of the XMM satellite has provided an X-ray imaging ca-pability of increased sensitivity and angular resolving power com-pared to ROSAT. The XMM-LSS employs 10-20 ks pointings and samples the cluster population to a depth of ∼ 10−14erg s−1cm−2–
a flux sensitivity comparable to the deepest serendipitous ROSAT surveys (Rosati et al. 2002). However, XMM observations possess a narrower PSF (FWHM ∼ 6′′for XMM vs ∼ 20′′for the ROSAT
PSPC) which suggests that the reliable identification of extended sources can be performed for apparently smaller sources. Instru-mental characteristics such as background noise and the complex focal plane configuration are also quite different. In this context, our dual aim of optimizing the XMM-LSS sensitivity and of quantify-ing the many selection biases led us to develop a dedicated source detection pipeline as well as specific optical identification and spec-troscopic confirmation procedures: special attention is given to ex-tended, X-ray faint sources whose identification requires deep op-tical/IR multi-color imaging. These steps are described in Section 2 along with the presentation of the D1 cluster catalogue. Section 3 presents the X-ray properties of the newly assembled sample and some optical characteristics. Section 4 summarizes the global prop-erties of our sample within the context of a “concordance” cosmo-logical model. We conclude with a discussion of our cluster selec-tion funcselec-tion in comparison with earlier works as well as the scaling laws for the low end of the cluster mass function.
Throughout the paper we assume ΩM = 0.27, ΩΛ = 0.73 and
H0= 71 km s−1Mpc−1. All X-ray flux measures are quoted in the [0.5-2] keV band. The generic name “cluster” refers to the entire population of gravitationally bound galaxy systems, while we use the term “groups” for those systems whose potential corresponds to an X-ray temperature lower than 2 keV.
2 THE X-RAY CLUSTER CATALOGUE 2.1 X-ray observations
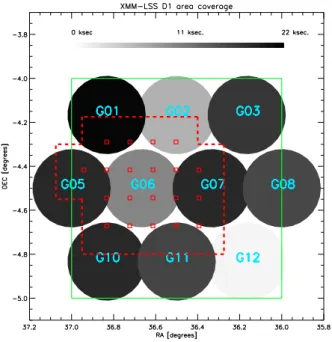
The XMM-LSS D1 region consists of a mosaic of 10 XMM point-ings that form part of the XMM Medium Deep Survey (XMDS; Chiappetti et al. 2005). The pointing layout is displayed in Figure 1 and the properties of individual pointings are shown in Table 1. The nominal exposure per pointing is 20 ks for this subregion2, with the exception of pointing G07, whose nominal exposure time of 40 ks was reduced to ∼ 20 effective ks as a result of solar activity. The raw X-ray observations (ODFs) were reduced using the standard XMM Science Analysis System (XMMSAS; version v6.1) tasks emchain and epchain for the MOS and PN detectors respectively. High background periods, related to soft protons, were excluded from the event lists following the procedure outlined by Pratt & Arnaud (2002). Raw photon images in different energy bands were then cre-ated with a scale of 2.′′5 pixel−1. A complete discussion of the image
analysis and source characterization procedures are provided by Pacaud et al. (2006). Cluster detection was performed in the [0.5-2] keV band and was limited to the inner 11 arcmin of the XMM field. The total scanned area is 0.81 deg2. Information regarding the individual pointings is summarized in Table 1 and the layout of the pointings on the sky displayed in Fig. 1.
2 Outside the XMDS, the nominal exposure per pointing for the rest of the XMM-LSS is 10 ks.
Table 1. Properties of individual XMM pointings. Quoted exposures are effective exposures computed after filtering high background periods.
Internal ID XMM ID RA (J2000) Dec. (J2000) MOS1, MOS2, pn exposure times (ks) G01 0112680201 02:27:20.0 -04:10:00.0 24.6, 25.3, 21.4 G02 0112680201 02:26:00.0 -04:10:00.0 10.1, 9.7, 6.7 G03 0112680301 02:24:40.0 -04:10:00.0 21.8, 21.7, 17.3 G05 0112680401 02:28:00.0 -04:30:00.0 23.5, 23.9, 12.5 G06 0112681301 02:26:40.0 -04:30:00.0 16.4, 16.6, 10.5 G07 0112681001 02:25:20.0 -04:30:00.0 22.5, 25.1, 18.6 G08 0112680501 02:24:00.0 -04:30:00.0 21.2, 21.3, 15.9 G10 0109520201 02:27:20.0 -04:50:00.0 24.7, 24.6, 18.5 G11 0109520301 02:26:00.0 -04:50:00.0 21.7, 21.8, 16.1
G12 0109520401 02:24:40.0 -04:50:00.0 not usable because of very high flare rate
Figure 1. The XMM pointing mosaic over the D1 area (green square). The
radius of the displayed pointings is 11 arcminutes. The grey-scale indi-cates effective mean exposure time per detector, after removal of high back-ground periods. The red squares show the centres of the VVDS pointings (Ilbert et al. 2005) and the red dotted line indicates the total area covered covered by the VVDS. The VLA-VIRMOS Deep Field encompasses ex-actly the D1 region
2.2 Cluster X-ray detection and optical identification procedure
The compilation of an X-ray cluster sample featuring positional and redshift data ultimately requires the input of optical and/or near-infrared (NIR) data in order to select putative cluster galaxies for which precise redshifts can be obtained. Therefore, although X-ray selection is employed to better avoid projection effects, to pro-vide direct clues about cluster masses and to propro-vide more easily tractable selection criteria, optical/NIR data for each cluster must be assessed in order to obtain cluster redshift data. The goal of XMM-LSS is to produce a faint, statistical cluster catalogue over a wide spatial area (several tens of square degrees) and a large red-shift interval (zero to unity). Cluster identification procedures must therefore identify robustly a wide range of cluster properties at both X-ray and optical/NIR wavelengths. Given the above requirements the XMM-LSS has developed over the last three years from initially
simple and very robust cluster selection procedures to a refined, quantitative approach focusing on key cluster selection parameters. Developing the X-ray pipeline was an essential part of the pro-cedure as is reflected in the successive publications. We summarise these developments below:
(i) Spectroscopic observations during 2002 were performed for a number of cluster candidates identified following the method de-veloped by (Valtchanov et al. 2001); extended X-ray sources were accepted as candidate clusters if associated with a spatial overden-sity of galaxies displaying a uniform red colour sequence deter-mined using either CFHT/CFH12K BVRI or CTIO/MOSAIC Rz imaging. This approach maximized the success rate of the first XMM-LSS spectroscopic observations (conducted in the last quar-ter of 2002) which demonstrated that clusquar-ters to a redshift of 1 are detectable with 10-20 ks XMM observations (Valtchanov et al. 2004; Willis et al. 2005).
(ii) In order to proceed toward a purely X-ray selected sam-ple – i.e. to reduce contamination by spurious extended sources – a maximum likelihood procedure named Xamin was combined with the wavelet-based detection algorithm developed previously (Pierre et al. 2004). The sample of candidate clusters thus gener-ated was investiggener-ated during the spectroscopic observations con-ducted in 2003 and 2004.
(iii) Finally, the combination of spectroscopic results for the above cluster sample with a detailed study of the simulated per-formance of the X-ray pipeline led to the definition of three clearly defined classes of X-ray cluster candidates.
The cluster identification procedure described above satisfies the goal of generating a relatively uncontaminated sample of X-ray clusters with a well defined selection function. A detailed descrip-tion of the X-ray parameters employed to generate each class of cluster candidate is described in the following section.
2.3 The cluster classification and sample
The ability to detect faint, extended sources in X–ray images is subject to a number of factors. Although the apparent size of a typ-ical cluster (Rc = 180 kpc) is significantly larger than the XMM
point spread function (PSF; on-axis FWHM ∼ 6′′) at any redshift
of interest3, it is incorrect to assume that all clusters brighter than a given flux will be detected – unless the flux limit is set to some high value. Cluster detectability depends not only on the instrumen-tal PSF, object flux and morphology but also upon the background
level and the detector topology (e.g. CCD gaps and vignetting), in addition to the ability of the pipeline to separate close pairs of point-like sources – all of which are a function of the specified en-ergy range (Scharf 2002). We thus stress that the concept of “sky coverage”, i.e. the fraction of the survey area covered at a given flux limit, is strictly valid only for point-sources because, for faint extended objects, the detection efficiency is surface brightness lim-ited (rather than flux limlim-ited). Moreover, since the faint end of the cluster luminosity function is poorly characterised at z > 0, it is not possible to estimate a posteriori what fraction of groups remain undetected, unless a cosmological model is assumed, along with a thorough modelling of the cluster population out to high redshift; the lower limit of the mass or luminosity function being here a key ingredient. To our knowledge, this has never been performed in a fully self-consistent way so far for any deep X-ray cluster survey (“Flim” ∼ 2−5×10⁻¹⁴erg s−1cm−2). It is also important to consider
that the flux recorded from a particular cluster represents only some fraction of the total emitted flux and must therefore be corrected by integrating an assumed spatial emission model to large radius. Consequently, with the goal of constructing deep controlled sam-ples suitable for cosmology we define, rather than flux limits, classes of extended sources. These are defined in the extension and significance parameter space and correspond to specific lev-els of contamination and completeness. As shown by Pacaud et al. (2006), extensive simulations of various cluster and AGN popula-tions generate detection probabilities as a function of sources prop-erties. This enables a simultaneous estimate of the source complete-ness levels and of the frequency of contamination by misclassi-fied point-like sources or spurious detections. X-ray source clas-sification was performed using Xamin and employs the output pa-rameters: extent, likelihood of extent, likelihood of
detection. The reliability of the adopted selection criteria has been checked against the current sample of 60 spectroscopically confirmed XMM-LSS clusters. We have defined three classes of extended sources:
• The C1 class is defined such that no point sources are
misclas-sified as extended and is described by extent > 5′′, likelihood
of extent >33 and likelihood of detection > 32. The C1 class contains the highest surface brightness extended sources and inevitably includes a few nearby galaxies – these are readily dis-carded from the sample by inspection of optical overlays.
• The C2 class is described by extent > 5′′ and
15 < likelihood of extent < 33 and typically displays a contamination rate of 50%. The C2 class includes clusters fainter than C1, in addition to a number of nearby galaxies. Contaminat-ing sources include saturated point sources, unresolved pairs, and sources strongly masked by CCD gaps, for which not enough pho-tons were available to permit reliable source characterization. Con-taminating sources were removed after a visual inspection of the optical/NIR data for each field and in some cases as a result of follow-up spectroscopy.
• The C3 class was constructed in order to investigate clusters
at the survey sensitivity limit, particularly clusters at high redshift. Sources within the C3 class typically display 2′′ < extent <
5′′ and likelihood of extent > 4. Selecting such faint,
marginally extended sources generates a high contamination rate. However, low selection thresholds are required to identify extended sources at the survey limit: faint sources will never be character-ized by high likelihood values. When refining the C3 class, the X-ray, optical and NIR appearance was examined thoroughly. Gen-erally speaking, C3 sources display low surface brightness or
ex-tended emission affected by a point source. Additional constraints included that the detection should be located at an off-axis angle
< 10′ and that the total detection should generate 30 photons or
greater (stronger constraint on the off-axis value is necessary be-cause weak objects are subject to strong distortions beyond 10 ar-cmin, thus hardly measurable). The most plausible C3 candidates were investigated spectroscopically and confirmed clusters are pre-sented.
The analysis of simulated cluster and AGN data permits the computation of selection probabilities for the C1 and C2 cluster samples4. The extent to which the C1 and C2 classes are compa-rable to flux limited samples is analyzed in detail by Pacaud et al. (2006) and further discussed in the last section of this paper. The selection probability for C3 clusters has not been determined.
2.4 Determination of cluster redshifts
The XMM-LSS spectroscopic Core Programme aims at the redshift confirmation of the X-ray cluster candidates; velocity dispersion may subsequently be obtained for a sub-sample of confirmed clus-ters as a second step programme. Spectroscopic observations were performed using a number of telescope and instrument combina-tions and are summarized in Table 2. Details of which observing configuration was employed for each cluster are presented in Table 3.
The minimum criterion required to confirm a cluster was spec-ified to be three concordant redshifts (±3000 kms−1) within a
pro-jected scale of approximately 500 kpc of the X-ray emission cen-troid, computed at the putative cluster redshift. For nearby X-ray clusters of temperature TX = 2 keV, a radius of 500 kpc
cor-responds to approximately 50% of the virial radius and encloses 66% of the total mass – with both fractions being larger for higher temperature clusters (Arnaud et al. 2005). The final cluster redshift was computed from the non weighted mean of all galaxies within this projected aperture and within a rest-frame velocity interval
±3000 kms−1of the interactively determined redshift peak.
Poten-tial cluster galaxies are selected for spectroscopic observation by identifying galaxies displaying a uniformly red colour distribution within a spatial aperture centred on the extended X-ray source (see Andreon et al. 2004 for more details). Cluster members flagged via this procedure are then allocated spectroscopic slits in order of de-creasing apparent magnitude (obviously avoiding slit overlap).
The exact observing conditions for each cluster form a het-erogeneous distribution. However, each cluster was typically ob-served with a single spectroscopic mask featuring slitlets of 8–10′′
in length and 1–1.′′4 in width. The use of a different telescope and
instrument configuration generally restricts the available candidate cluster member sample to a different limiting R–band magnitude (assuming an approximately standard exposure time of 2 hours per spectroscopic mask). Typical apparent R–band magnitude limits generating spectra of moderate (S/N > 5) quality for each tele-scope were found to be the following: VLT/FORS2 (23), Mag-ellan/LDSS2 (22) and NTT/EMMI (21.5). Spectroscopic data re-duction followed standard IRAF5procedures. Redshift determina-tion was performed by cross-correlating reduced, one-dimensional
4 The C1 and C2 classes are defined from simulations representative of a mean exposure time of 10 ks. In the present paper, we keep the same definition as the signal-to-noise ratio (S/N) increase is only√2.
5 IRAF is distributed by the National Optical Astronomy Observatories, which are operated by the Association of Universities for Research in
spectra with suitable templates within the IRAF procedure xcsao (Kurtz & Mink 1998) and confirmed via visual inspection. A more detailed description of the spectroscopic techniques employed by the XMM-LSS survey can be found in Valtchanov et al. (2004) and Willis et al. (2005). In addition to the above spectroscopic observa-tions, cluster redshift information was supplemented where avail-able by spectra contributed from the VVDS (see Tavail-able 3).
The D1 X-ray clusters with confirmed redshifts are presented in Table 3. C1 and C2 confirmed clusters constitute a controlled sample (following Sec. 2.3) and are associated with the label “XLSSC” and a three digit identifier6. This nomenclature is used to identify individual clusters in any later discussion. The complete-ness of C3 sources is not addressed. In the case where a particular cluster is present in two separate XMM pointings, only the pointing where the cluster is the closest to the optical centre has been used to measure its properties. Note that the off-axis restriction imposed on the C3 clusters excludes two faint clusters located at the very border of the D1 area and reported in the Willis et al. (2005) initial sam-ple (XLSSUJ022633.9-040348, XLSSUJ022628.2-045948). Clus-ter redshift values given in Table 3 are the unweighed mean of rel-atively small member samples and observed, in a few cases, using different spectrographs. As this approach may result in relatively large (several hundred kms−1) uncertainties in the computed
red-shift, the cluster redshift precision reported in Table 3 has been set to two decimal points (3000 kms−1). X-ray/optical overlays of each
cluster field are displayed in Fig. ??.
3 X-RAY PROPERTIES OF CONFIRMED CLUSTERS
The spectral and spatial X-ray data for each spectroscopically con-firmed cluster was analysed to determine the temperature, spatial morphology and total bolometric luminosity of the X-ray emitting gas.
3.1 Spectral modelling and temperature determination
A complete description of the spectral extraction and analysis pro-cedures as applied to X-ray sources with low signal levels us-ing the Xspec package (Arnaud 1996), together with a discussion on the accuracy of the computed temperatures, are presented in Willis et al. (2005). We summarise the principal steps below.
Spectral data were extracted within an aperture of specified radius (see Table 4) and a corresponding background region was defined by a surrounding annulus. Photons were extracted over the energy range [0.3–10] keV, excluding the energy range [7.5– 8.5] keV due to emission features produced by the pn detector sup-port. Analyses of simulated spectral data with less than 400 total counts indicated that using C-statistics on unbinned spectral data produced a systematic offset in the computed temperature. This bias is significantly reduced for such faint spectra when the data are resampled such that at least 5 photons are present in each spec-tral bin corresponding to the background spectrum. We determined that this approach produces reliable temperature measures for low temperature (T < 3 keV), low count level (< 400 photons) spec-tral data. The assumed fitting model employs an absorbed APEC plasma (Smith et al. 2001) with a fixed metal abundance ratio given
Astronomy, Inc., under cooperative agreement with the National Science Foundation.
6 The acronym is defined at CDS at the following URL
http://vizier.u-strasbg.fr/cgi-bin/Dic?XLSSC.
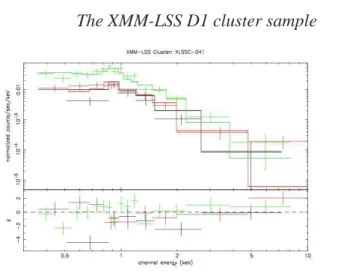
Figure 2. Fitted spectrum and residuals for cluster XLSSC 041; (MOS1:
black, MOS2: red, pn: green)
by Grevesse & Sauval (1999) and set to 0.3 of the solar value. Ab-sorption due to the Galaxy is modelled using the WABS function (Morrison & McCammon 1983), fixing the hydrogen column den-sity to the value given by Dickey & Lockman (1990) at the cluster position (typically ∼ 2.6 × 1020cm−2). Where the temperature
fit-ting procedure failed to converge to a sensible model (due to low signal levels), the source temperature was fixed at 1.5 keV. Results of the X-ray spectral analysis are presented in Table 4. An example of cluster spectrum and fit is shown in Figure 2.
3.2 Source morphology and spatial modelling
Sources detected using Xamin are initially compared to two surface brightness models describing the two dimensional photon distribu-tion: a point source and a circular β-profile of the form
S (r) = A
[1 + (r/Rc)2]3β−1/2
, (1)
where β = 2/3 is fixed while the core radius, Rc, and profile
nor-malisation, A, are permitted to vary (Cavaliere & Fusco-Femiano 1976). Each profile is convolved with the mean analytical PSF at the corresponding off-axis location and a comparison of the statis-tical merit achieved by each profile provides an effective discrimi-nator of point and extended sources in addition to an initial estimate of the source flux (see Pacaud et al. (2006)).
The photometric reliability of this procedure when applied to faint, extended sources is affected by the presence both of gaps in the XMM CCD array and by nearby sources (although both are de-scribed within the fitting procedure) – largely due to variations in the true source morphology and the fact that a larger fraction of the total emission is masked by the background when compared to brighter sources. Although such effects are naturally incorporated into the selection function appropriate for each cluster class via simulations (Pacaud et al. 2006), a further interactive spatial anal-ysis was performed on each spectroscopically confirmed cluster in order to optimize the measure of the total emission (i.e. flux and luminosity) within a specified physical scale.
The photon distribution for each confirmed cluster is modelled using a one-dimensional circular β-profile in which β, Rcand A are
permitted to vary. Photons from the three XMM detectors are co-added applying a weight derived from the relevant exposure map and pixels associated with nearby sources are excluded. Photons are binned in concentric annuli of width 3′′ centred on the
clus-Table 2. Observing resources employed to determine cluster spectroscopic redshifts.
Telescope Instrument Grism + Filter Approximate resolving power (R) Identifier
VLT FORS2 300V+GC435 500 1
VLT FORS2 600RI+GC435 1000 2
VLT FORS2 600z 1300 3
NTT EMMI Grism #3 700 4
Magellan (Clay) LDSS-2 medium-red 500 5
VLT VIMOS LRRED 220 6
Table 3. Spectroscopically confirmed X-ray clusters within the D1 area.
Source XLSSC RA (deg.) Dec (deg.) XMM Off-axis anglea Redshift # of membersb Observed
pointing (arcminutes) (see Table 2)
C1 XLSS J022404.1-041329c 029 36.0172 -4.2247 G03 9.0 1.05 5 3 XLSS J022433.5-041405 044 36.1410 -4.2376 G03 3.8 0.26 9 4 XLSS J022524.5-044042 025 36.3526 -4.6791 G07 10.3 0.26 10 5 XLSS J022530.6-041419 041 36.3777 -4.2388 G02 9.1 0.14 9 4 XLSS J022609.7-045804 011 36.5403 -4.9684 G11 8.1 0.05 7 4 XLSS J022709.1-041759d 005 36.7877 -4.3002 G01 7.8 1.05 5 2 XLSS J022725.8-043213e 013 36.8588 -4.5380 G05 8.1 0.31 11 5 XLSS J022739.9-045129 022 36.9178 -4.8586 G10 5.6 0.29 5 5 C2 XLSS J022725.0-041123 038 36.8536 -4.1920 G01 1.9 0.58 7 4 C3 XLSS J022522.7-042648 a 36.3454 -4.4468 G07 3.9 0.46 4 2 XLSS J022529.6-042547 b 36.3733 -4.4297 G07 5.8 0.92 7 6 XLSS J022609.9-043120 c 36.5421 -4.5226 G06 8.0 0.82 8 6 XLSS J022651.8-040956 d 36.7164 -4.1661 G01 6.6 0.34 5 1
a The off-axis angle is computed from the barycentre of the optical axes of the three telescopes using XMMSAS variables XCEN YCEN weighted by the mean detector sensitivity (see Pacaud et al. (2006)).
b Only galaxies within a projected distance < 500 kpc of the cluster centre are counted. c Listed by Andreon et al. (2005).
d Already published by Valtchanov et al. (2004). e Already published by Willis et al. (2005).
ter X-ray emission. Radial data bins are subsequently resampled to generate a minimum S /N > 3 per interval. The background is computed at large radius assuming a constant particle contribution plus vignetted cosmic emission. The above resampling procedure is then applied to the circular β-profile convolved with the mean an-alytical PSF7computed at the corresponding cluster off-axis angle (Ghizzardi 2002). Model cluster profiles are realised in this manner over a discrete grid of β and Rcvalues with the best-fitting model for
each cluster determined by minimising the χ2statistic over the pa-rameter grid. Finally, the best-fitting spatial profile (at this point in units of photon count rate) is integrated out to a specified physical radius and converted into flux and luminosity units using standard procedures within Xspec.
The majority of confirmed clusters are apparently faint, dis-playing total photon counts of order a few hundred, and the
ob-7 The convolution of the two profiles models the photon distribution factor introduced by the two dimensional convolution (Arnaud et al. 2002).
served photon distribution in many cases represents only a fraction of the extended X-ray surface brightness distribution. Under such conditions the parameters β and Rcare degenerate when fitted
si-multaneously, limiting the extent to which “best-fitting” parameters can be viewed as a physically realistic measure of the cluster prop-erties, although providing a useful ad hoc parametrisation. For this reason we do not quote best fitting values of β and Rcderived for
each confirmed cluster. The uncertainty associated with the pro-cedure is evaluated using a large suite of simulated observations (and subsequent analyses) of clusters of specified surface bright-ness properties (i.e. β, Rcand apparent brightness - Pacaud et al.,
in preparation). The fractional uncertainty can then be quoted as a function of the number of photons collected within the fitting ra-dius Rf it(the maximum radius out to which the resampling
crite-rion S/N > 3 was achieved) and the radius to which the profile is calculated (possibly, extrapolated). Note that, as shown in the next section, almost all clusters have Rf itgreater than the physical
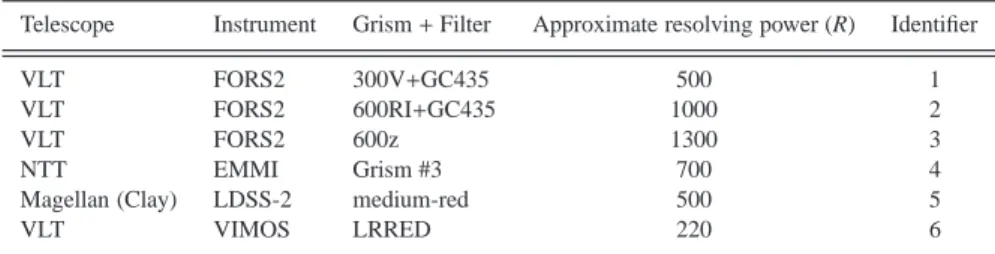
Table 4. Spectral X-ray parameters. The radius of the circular aperture used for the spectral extraction is denoted by Rspec. Computed source counts are
summed over the three detectors. The suffix “F” applied to temperature values indicates that a reliable temperature fit was not achieved and a gas temperature of 1.5 keV was assumed for the computation of bolometric luminosity.
Cluster Rspec Source counts in Rspec T C-stat r500
(arcscec) [0.3-7.5]+[8.5-10] keV (keV) (per d.o.f) (Mpc) (arcsec)
XLSSC 029 33 311 4.1+1.7 −1.0 1.08 0.52 67 XLSSC 044 55 234 1.3+0.2 −0.2 1.15 0.40 100 XLSSC 025 35 661 2.0+0.5 −0.3 1.06 0.53 129 XLSSC 041 45 523 1.3+0.3 −0.1 1.00 0.43 172 XLSSC 011 68 425 0.6+0.2 −0.1 1.04 0.28 272 XLSSC 005 35 164 3.7+3.5 −1.4 1.02 0.49 60 XLSSC 013 30 161 1.0+0.2 −0.2 0.92 0.33 73 XLSSC 022 39 1304 1.7+0.2 −0.2 0.91 0.47 109 XLSSC 038 33 118 1.5F – 0.37 56 cluster a 24 160 1.5F – 0.40 69 cluster b 30 <100 1.5F – 0.30 38 cluster c 30 <100 1.5F – 0.32 42 cluster d 25 157 0.9+0.2−0.2 0.74 0.31 65
very faintest clusters (those with total photon counts less than ∼ 100) a simple sum within a circular aperture was applied.
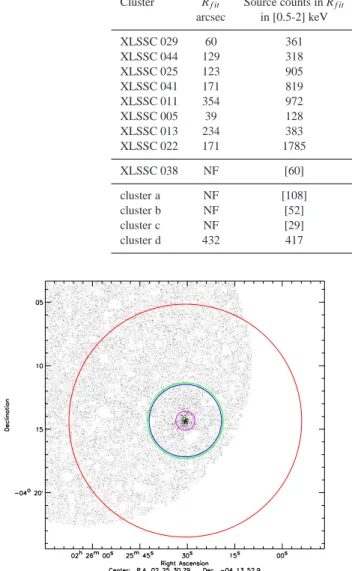
As an example of the above spatial fitting procedure, Figure 3 shows the data analysis regions applied to the cluster XLSSC 041. Figure 4 displays the resulting one dimensional radial profile and the best-fitting surface brightness model for the same cluster.
3.3 Determination of cluster flux and luminosity
Values of flux and luminosity for confirmed clusters are obtained by integrating the cluster emission model, described by the appro-priate Xspec plasma emission and surface brightness models, out to a specified physical radius. We use a different physical radius for flux measures as opposed to luminosity - mainly because tabulated flux values for cluster surveys present in the literature prefer an es-timate of the “total” flux within a limited energy interval whereas luminosity values are computed as the bolometric emission within a physical radius corresponding to a constant overdensity in an evolv-ing universe (e.g. r500).
Flux values are computed by integrating the best-fitting β-profile to a radius of 500 kpc. The specified aperture includes a substantial fraction of the total flux (approximately 2/3 of the flux from β-profile described by β = 2/3 and Rc= 180 Mpc) yet avoids
uncertainties associated with the extrapolation of the profile to large radii.
In order to obtain cluster luminosities within a uniform phys-ical radius, we have integrated the best–fitting β-profile for each cluster to r500 i.e. the radius at which the cluster mass density reaches 500 times the critical density of the universe at the clus-ter redshift. Values of r500 for each cluster were computed using the mass-temperature data of Finoguenov et al. (2001) which, when converted to our assumed cosmology and fitted with an orthogonal regression line, yield the expression r500= 0.391 T0.63h70(z)−1Mpc for clusters in the 0.7 < T < 14 keV interval. As reported in Willis et al. (2005), values of r500from this formula agree well with those derived from assuming an isothermal β-profile for clusters display-ing T . 4 keV.
For each cluster in the confirmed sample, with the exception of XLSSC 005, the computed values of r500lie within radius of, or close to, the region employed to fit the β-profile; (hence, for this
cluster alone, the photometric errors are large as reported in Table 5). Bolometric X–ray luminosities were calculated for each cluster by extrapolating the APEC plasma code corresponding to the best– fitting temperature to an energy of 50 keV. Values of r500, flux and luminosity for each confirmed cluster are listed in Tables 4 and 5.
In Appendix A we analyse the impact of further sources of un-certainty affecting the luminosity and temperature measurements.
Appendix B gather notes on the individual clusters and in-vestigate, among others, the possibility that the computed clusters brightness values may be contaminated by AGN emission. We con-clude that none of the C1 and C2 clusters (i.e. those used for de-tailed population statistics) contained in the D1 sample are signifi-cantly contaminated by AGN emission.
3.4 Trends in the LXversus TXcorrelation
Figure 5 displays the LXversus TX distribution of the D1 clusters
for which it was possible to measure a temperature (eight C1 and one C3 objects). Although the D1 area represents only a subset of the anticipated XMM-LSS area, the C1 sample is complete and reli-able temperature information is availreli-able for all systems. It is there-fore instructive to consider trends in the LX versus TX distribution
in anticipation of a larger sample of C1 clusters from the continu-ing survey. The location of C1 clusters in the LX versus TX plane
is compared to a regression line computed for a combined sample of local sources based upon the group data of Osmond & Ponman (2004) and cluster data of Markevitch (1998). The computed re-gression line takes the form, log LX = 2.91 log TX + 42.54, for
bolometric luminosity computed within r500. A complete discus-sion of the regresdiscus-sion fit will be presented by Helsdon & Ponman (2006).
One issue of interest concerns the properties of intermediate redshift (z ∼ 0.3) X–ray groups (i.e. TX ∼ 1 − 2 keV). Such
sys-tems dominate the XMM-LSS numerically and, when compared to higher temperature, higher mass clusters, are expected to demon-strate to a greater degree the effects of non–gravitational physics in the evolution of their X–ray scaling relations with respect to self–similar evolution models. The luminosity of X-ray sources in XMM-LSS may be compared to those of local sources at the same temperature by computing the luminosity enhancement
fac-Table 5. Results of the spatial analysis for confirmed clusters. See text for the definition of the fitting radius Rf it. The net source counts are computed within
Rf itand are uncorrected for vignetting. A value of “NF” indicates that no reliable spatial fit was possible for the cluster: the source counts, flux and luminosity
were computed applying a circular aperture of radius 500 kpc.
Flux values are computed by integrating the best-fitting cluster β-profile out to a radius of 500 kpc. The photometric precision indicates the mean 1 σ errors estimated from analyses of simulated cluster data and accounts for the profile fitting uncertainties only (see text for details).
Cluster Rf it Source counts in Rf it F[0.5−2] Lbol(r500) Photom. acc.
arcsec in [0.5-2] keV 10−14erg/s/cm2 1044erg/s
XLSSC 029 60 361 3.1 4.8 20% XLSSC 044 129 318 2.5 0.11 15% XLSSC 025 123 905 9.4 0.52 15% XLSSC 041 171 819 20.6 0.24 15% XLSSC 011 354 972 16.4 0.015 15% XLSSC 005 39 128 1.1 1.5 60% XLSSC 013 234 383 2.7 0.15 20% XLSSC 022 171 1785 9.8 0.65 10% XLSSC 038 NF [60] 0.3 0.09 -cluster a NF [108] 0.7 0.1 -cluster b NF [52] 0.4 0.4 -cluster c NF [29] 0.3 0.3 -cluster d 432 417 0.83 0.078 20%
Figure 3. An example of the spatial and spectral analysis regions applied
to cluster XLSSC 041. The photon image is displayed. The purple circle indicates the spectral extraction region. The green circle indicates r500. The blue circle indicates R3σ= Rf it. All X-ray sources, except the cluster of
interest, are masked. The external red circle delineates the region used for the fit.
tor, F = Lobs/Lpred, where Lobs is the observed cluster X–ray
luminosity within a radius, r500, and Lpred is the luminosity
ex-pected applying the fitted LXversus TX relation computed for the
local sources and the XMM–LSS measured temperature. Sources XLSSC 013, 022 and 041 have a luminosity enhancement factors
Figure 4. The radially averaged X-ray emission profile for cluster XLSSC
041. The red curve indicates the best-fitting model compared to the data (black histogram with blue crosses). The vertical lines follow the same colour coding as Figure 3. The red horizontal line marks the background level.
F ≈ 3 − 4, compared to a value 1.15 expected from self–similar8 luminosity scaling within r500.
From the local universe, we know that low temperature groups show a larger dispersion in the L-T relation than massive clusters (Helsdon & Ponman 2003). This reflects their individual formation histories, since they are particularly affected by non-gravitational effects, as well as the possible contributions from their mem-ber galaxies. The apparent biasing toward more luminous objects and/or cooler system could come from the fact that we detect more easily objects having a central cusp, i.e. putative cool-core groups.
8 Self-similar implies that the luminosity scales as the Hubble constant when integrated within a radius corresponding to a fixed ratio with respect to the critical density of the universe as a function of redshift (Voit 2005).
Figure 5. LX(r500) versus TXrelation for the clusters for which it was
pos-sible to derive a temperature; all of them but cluster d (displayed as an upside-down triangle) are C1. The solid line gives the mean local LX− TX
relation (see text), while the dotted line is the expected luminosity enhance-ment assuming self-similar luminosity scaling within r500at z = 0.5. Differ-ent plotting symbols indicate clusters located within three differDiffer-ent redshift intervals.
This has the effect of both decreasing the temperature and increas-ing the luminosity. The bias could also simply reflect the fact that we can measure a temperature only for the brightest objects.
In order to test this hypothesis, we have considered a few or-ders of magnitude. The local L-T relation predicts a luminosity of 1.1 1043and 2.6 1043erg/s for a T=1.5 and T=2 keV group respec-tively. A factor of 2 under luminosity for such objects would thus correspond to 5.6 1042and 1.3 1043erg/s. In Table 5, we note that (i) the lowest flux cluster (XLSSC 005) is detected with some 150 photons in Rf it; the X-ray image appears moreover to be quite flat;
(ii) group XLSSC 044 (z= 0.26) has a luminosity of 1.1 1043erg/s, for some 300 photons in Rf it. From this, we infer that we could have
detected groups around z ∼ 0.25, having 1.5 < T < 2 keV that are under luminous by a factor of 2, if any were present in our sample. Below 1.5 keV, these objects are likely to remain undetected.
The coming availability of the larger XMM-LSS sam-ple will permit a more reliable assessment of such effects on the morphology–luminosity–temperature plane for such groups (Pacaud et al, in preparation).
4 DISCUSSION AND CONCLUSION
We have used 20 ks XMM images to construct a deep sample of galaxy clusters. The total cluster surface density of 15.5 deg−2 is
approximately five times larger than achieved previously with the deepest ROSAT cluster surveys (e.g. RDCS, Borgani et al. (2001)). On the one hand, from the optical point of view, we note that none of the detected clusters shows strong lensing features, hence the likely absence of massive clusters in the D1 area9. This is consistent with the fact that the highest cluster X-ray temperature is only 4 keV: this temperature corresponds to a mass of ∼ 3 1014
M⊙ and, in a standard ΛCDM halo model (Pacaud et al. 2006), the density of clusters more massive than this limit, i.e. those most likely to produce strong lensing, is ∼ 0.8 deg−2. On the other hand, it is
9 With the caveat that the presence of giant arcs requires not only a large mass concentration but also a specific lens/source configuration
indeed a salient property of the XMM-LSS to unveil for the first time the bulk of the 1 < T < 2 keV group population in the 0.1 < z < 0.4 range along with its capability of detecting z ≥ 1 clusters. We further review below the main properties of the sample.
The C1 cluster sub-sample corresponds to a purely X-ray se-lected sample (zero contamination) and displays a surface density of ∼ 9 deg−2. Reliable temperature information is available for all
C1 sources and optical spectroscopic observations are required only to confirm the cluster redshift. Relaxing the selection criteria used to generate the C1 sample creates additional samples labelled C2 and C3. However, optical imaging and spectroscopic data are re-quired to identify bona-fide clusters within these samples. The C2 sample possesses a well-defined X-ray selection function (approx-imately 50% of sources are confirmed as clusters) and the surface density of C1+C2 clusters is ∼ 11 deg−2. Sources labelled C3
repre-sent significant detections outwith the C1 and C2 selection criteria and, given the high contamination rate, we do not compute a selec-tion funcselec-tion for these sources. The C3 sample contains potentially interesting objects and points to our ultimate sensitivity for cluster detection which appears to be around 5 × 10⁻¹⁵erg s−1cm−2;
how-ever, we stress that the full selection function for the C1 and C2 samples is multi-dimensional (see below). Noting this caveat – for comparison purposes only – the quoted flux sensitivity corresponds to a cluster of ∼ 7×1043erg s−1(T ∼ 3 keV) at z = 1 and to a group
of 3.5 × 1042erg s−1(T = 1 keV) at z = 0.3. We further note that no
C1 or C2 cluster emission appears to be significantly contaminated by AGN activity – partly a result of the high threshold put on the extent likelihood for these samples.
Having the D1 XMM-LSS sample now assembled, it is in-structive to examine in what manner it differs from a purely flux limited sample. This question is phenomenologically addressed by Pacaud et al. (2006) as the answer depends on two major ingredi-ents; (1) the pipeline efficiency (involving itself the many instru-mental effects) - this is quantified by means of extensive simula-tions; (2) the characteristics of the cluster population out to a red-shift of unity at least - this latter point being especially delicate as the low-end of the cluster mass function, critical for the survey sen-sitivity, is poorly known and cluster scaling law evolution, still a matter of debate. Hence the need for a self-consistent approach ba-sically involving a cosmological model, a halo mass spectrum and some LX(M, T, Rc, z) function10describing the evolution of the
cluster intrinsic properties that directly impact on the cluster de-tection efficiency. The principal conclusion regarding the use of a single flux limit is that, to obtain a cluster sample displaying a high level of completeness and reasonably low contamination, the flux limit has to be set to some high value, e.g. F > 5×10⁻¹⁴erg s−1cm−2
in the case of XMM-LSS. The present study demonstrates on real data the advantage of using the C1 set of criteria as a well defined sample that includes groups down to T = 1 keV and fluxes as low as 10−14erg s−1cm−2and, consequently, significantly increases the
size of the purely X-ray selected sample. Although the C1 criteria, even fully controlled, might at first sight appear more pipeline de-pendent and, thus, less physical than a simple flux limit, we stress that any X-ray detection algorithm is bound to miss low luminosity clusters in a way that is pipeline dependent - the loss of efficiency not being a simple flux limit. For these reasons, we favor the
con-10 The function is normalized from local universe observations and its evo-lution constrained by available high-z data, numerical simulations and other possible prescriptions such as self-similarity evolution; one of the main un-knowns being the role of non gravitational physics in cluster evolution
cept of controlled sample (in the C1 selection sense) rather than of complete flux limited sample.
Our D1 sample contains 7 clusters displaying a flux in ex-cess of 2 × 10⁻¹⁴erg s−1cm−2 (all C1). This corresponds to a
sur-face density of ∼ 8 deg−2and is larger than the 4–5 clusters deg−2
implied by the RDCS log N − log S relation (Rosati et al. 1998) – the only ROSAT cluster sample complete to 2 × 10⁻¹⁴erg s−1cm−2
(Rosati et al. 2002) – in addition to the shallow XMM/2dF survey (Gaga et al. 2005), reporting 7/2.3 = 3 deg−2at the same flux limit.
The probability to obtain 8 clusters deg−2from the RDCS number density is 5-10 %, assuming simple Poisson statistics. Given the relatively small fields covered in each case, the effects of cosmic variance upon any such comparison may well be important (the XMM/2dF survey and deepest regions of the RDCS cover 2.3 and 5 deg2respectively). For comparison, the simple cluster evolution plus cosmological model presented by Pacaud et al. (2006) predicts a surface density of ∼ 7.5 clusters deg−2displaying T > 1 keV and
a flux F > 2 × 10⁻¹⁴erg s−1cm−2.
We have computed reliable temperature values for nine of the thirteen confirmed clusters – in particular, the C1 sample is “tem-perature” complete. This is important as it displays the potential for survey quality XMM observations to investigate the evolution of X-ray (and additional waveband) cluster scaling relations in a statistical manner over a wide, uniformly-selected redshift interval. Together with the initial sample presented by Willis et al. (2005), the D1 sample is the first sample to investigate the LXversus TX
re-lation for 1 < T < 2 keV groups at 0.15 < z < 0.35, for the simple reason that this population was previously undetected. XMM-LSS therefore samples a relatively complete, high surface density pop-ulation of clusters displaying temperatures T > 1 keV at redshifts z . 1 and provides an important new perspective for the study the cluster and group evolution employing only moderate XMM expo-sure times.
All data presented in this paper – cluster images taken at X-ray and optical wavebands in addition to detailed re-sults for the spectral and spatial analyses – are available in electronic form at the XMM-LSS cluster online database:
http://l3sdb.in2p3.fr:8080/l3sdb/login.jsp.
ACKNOWLEDGMENTS
We are grateful to M. Arnaud for providing her profile convolu-tion routine. We thank J. Ballet, R. Gastaud and J.-L. Sauvageot for useful discussions. A. Gueguen acknowledges a CNES CDD position. G. Galaz and H. Quintana thank the support of the FON-DAP Center for Astrophysics # 15010003. S. Andreon acknowl-edges financial contribution from contract ASI-INAF I/023/05/0. The results presented here are based on observations obtained with XMM-Newton, an ESA science mission with instruments and con-tributions directly funded by ESA Member States and NASA. The cluster optical images were obtained with MegaPrime/MegaCam, a joint project of CFHT and CEA/DAPNIA, at the Canada-France-Hawaii Telescope (CFHT) which is operated by the National Re-search Council (NRC) of Canada, the Institut National des Sci-ences de l’Univers of the Centre National de la Recherche Scien-tifique (CNRS) of France, and the University of Hawaii. This work is based in part on data products produced at TERAPIX and at the Canadian Astronomy Data Centre as part of the Canada-France-Hawaii Telescope Legacy Survey, a collaborative project of NRC and CNRS.
REFERENCES
Andreon S., Valtchanov I., Jones L. R., Altieri B., Bremer M., Willis J., Pierre M., Quintana H., 2005, MNRAS, 359, 1250 Arnaud K. A., 1996, in ASP Conf. Ser. 101: Astronomical Data
Analysis Software and Systems V, p. 17
Arnaud M., Majerowicz S., Lumb D., Neumann D. M., 2002, A&A, 390, 27
Arnaud M., Pointecouteau E., Pratt G. W., 2005, A&A, 441, 893 B¨ohringer H. et al., 2001, A&A, 369, 826
B¨ohringer H. et al., 2000, ApJS, 129, 435 Bondi M. et al., 2003, A&A, 403, 857 Borgani S. et al., 2001, ApJ, 561, 13
Burke D. J., Collins C. A., Sharples R. M., Romer A. K., Holden B. P., Nichol R. C., 1997, ApJ, 488, L83
Cavaliere A., Fusco-Femiano R., 1976, A&A, 49, 137 Chiappetti L. et al., 2005, A&A, 439, 413
Dickey J. M., Lockman F. J., 1990, ARA&A, 28, 215
Finoguenov A., Reiprich T. H., B¨ohringer H., 2001, A&A, 368, 749
Gaga T., Plionis M., Basilakos S., Georgantopoulos I., Geor-gakakis A., 2005, MNRAS, 363, 811
Ghizzardi S., 2002, XMM-SOC-CAL-022 & 029 Grevesse N., Sauval A. J., 1999, A&A, 347, 348 Helsdon M., Ponman T., 2006, in preparation Helsdon S. F., Ponman T. J., 2003, MNRAS, 340, 485
Henry J. P., Gioia I. M., Mullis C. R., Voges W., Briel U. G., B¨ohringer H., Huchra J. P., 2001, ApJ, 553, L109
Ilbert O. et al., 2005, A&A, 439, 863 Kurtz M. J., Mink D. J., 1998, PASP, 110, 934 Markevitch M., 1998, ApJ, 504, 27
Moretti A., Campana S., Lazzati D., Tagliaferri G., 2003, ApJ, 588, 696
Moretti A. et al., 2004, A&A, 428, 21
Morrison R., McCammon D., 1983, ApJ, 270, 119 Osmond J. P. F., Ponman T. J., 2004, MNRAS, 350, 1511 Pacaud F., Pierre M., et al , 2006, MNRAS, in press
Pierre M. et al., 2004, Journal of Cosmology and Astro-Particle Physics, 9, 11
Pratt G. W., Arnaud M., 2002, A&A, 394, 375
Rapetti D., Allen S. W., Weller J., 2005, MNRAS, 360, 555 Romer A. K. et al., 2000, ApJS, 126, 209
Rosati P., Borgani S., Norman C., 2002, ARA&A, 40, 539 Rosati P., della Ceca R., Norman C., Giacconi R., 1998, ApJ, 492,
L21
Scharf C., 2002, ApJ, 572, 157
Smith R. K., Brickhouse N. S., Liedahl D. A., Raymond J. C., 2001, ApJ, 556, L91
Valtchanov I., Pierre M., Gastaud R., 2001, A&A, 370, 689 Valtchanov I. et al., 2004, A&A, 423, 75
Vikhlinin A., McNamara B. R., Forman W., Jones C., Quintana H., Hornstrup A., 1998, ApJ, 498, L21
Voit M., 2005, Rev. Mod. Phys. (in press) Willis J. P. et al., 2005, MNRAS, 363, 675
APPENDIX A: ERROR BUDGET ON THE CLUSTER LUMINOSITY AND TEMPERATURE MEASUREMENTS
This Appendix investigates the impact of specific sources of uncer-tainty on the cluster temperature and flux measurements. The cal-culations are performed for 3 clusters representative of the flux and temperature ranges covered by the present sample, namely XLSSC 41, 29, 13.
-1- Cluster luminosities are computed within r500, a quantity empirically derived from the temperature (Sec. 3.3), while the pho-tometric errors quoted in Table 5 results from the spatial fit only. In Table A1 we provide the uncertainty on the luminosity induced by the errors from the temperature measurements, as propagated through the derivation of r500 (the spatial fit is then assumed to be exact). The results show that they are negligible compared to the accuracy level of the spatial fits.
-2- Cluster temperatures are estimated fixing the metal abun-dance to 0.3 solar (Sec. 3.1). Since many of our clusters have T <2 keV, for which the contribution from emission lines is significant, some temperature-abundance degeneracy could occur in the spec-tral fitting - all the more so since the number of photons involved in the spectral fit is small. In Table A1 we provide further temperature measurements fixing the abundance to 0.1 or 0.6 solar. The results show that the impact on the derivation of the temperature and as-sociated errors is negligible. In all these trials, the Galactic column density is held fixed.
-3- Finally, we investigate whether the contribution of unre-solved AGNs to the integrated cluster emission is statistically sig-nificant at our sensitivity. We proceed here assuming the XMM LogN-LogS for point sources (Moretti et al. 2003) since no in-formation on the AGN environment of low-luminosity clusters is available to date. For each ring of the cluster spatial profile, we compute the limiting flux for which a point source is to be detected at the 3 σ level. We then integrate the LogN-LogS over the cluster area out to R = 500 kpc, between the varying flux limit and the background flux level. Results are gathered in table A1 and show that, statistically, the point source contribution is negligible. In Ap-pendix B we further inspect, for each cluster, the possibility that the core of the cluster emission could be contaminated by an AGN.
APPENDIX B: NOTES ON INDIVIDUAL CLUSTERS
In this Appendix, we provide additional information for confirmed clusters. We have paid particular attention to whether the X-ray spectra and spatial emission of each cluster displays evidence for contamination by AGN emission. For each cluster we have com-pared the results generated by fitting the spatial emission having either included or excluded the central radial bin (radius of 3 or 6 arcsec.). Although in some cases the best-fitting values of β and Rcvaried significantly, in all cases the integrated countrate within
r500 showed variations less than 10%. The small number of pho-tons contributed by the central few arcseconds of each cluster pre-vented a separate spectral analysis of the central regions. Finally, we have investigated all examples of spatial coincidence between radio sources presented in Bondi et al. (2003) and the D1 cluster sample. We discuss individual clusters below.
In parallel, we have discovered a point-like source, XLSS J022528.2-041536, which is associated, at least in projection, with a group at redshift z ∼ 0.55 (more than 5 concordant redshifts). However, the group emission, which is embedded in that of XLSSC 041, appears totally dominated by the point source and conse-quently, this object does not enter the C1 or C2 or C3 classes. A radio source (Stot = 0.28 mJy, ∼ 5′′ extent) is present at 2′′from
the X-ray centre. XLSS J022528.2-041536 is located in the field of XLSSC 041 and the group member galaxies are indicated in the overlay of Fig. 6. In a further study involving optical, radio and IR data, we will assess the fraction of clusters that remain unclassified because of strong AGN contamination.
XLSSC 029: The presence of a radio source (Stot = 1.5 mJy, ∼
2′′extent) some 11′′from the cluster centre might suggest that the
X-ray emission is contaminated by an AGN. However, examination of a recent 100 ks XMM pointing on this object (obs 0210490101, PI L. Jones) shows that the astrometry of the original XMM-LSS survey image is correct within 1′′, and does not reveal a secondary
maximum coincident with the radio source.
XLSSC 044: This cluster is of very low surface brightness and
displays elongated emission. Its X-ray morphology, galaxy distri-bution and temperature of ∼ 1 keV suggest a group in formation.
XLSSC 025: A weak radio source (Stot = 1.0 mJy, ∼ 5′′
ex-tent) lies at the centre of the cluster emission, however, the cen-tral galaxy spectrum displays no strong emission lines (rest-frame wavelength interval 3000 − 6000Å is sampled). The X-ray spatial profile is peaked yet exclusion of the central 3′′radial bin, does not
change significantly the fitted value of Rc(it changes from 5′′to 6′′
while β = 0.44 remains constant). We thus exclude any strong con-tamination by a central AGN, and favor the cool core hypothesis.
XLSSC 041: No radio source was identified within 30′′ of the
cluster emission centroid. But,
XLSSC 011: The X-ray and optical appearance of this system
are suggestive of a compact group of galaxies. All point sources within a radius of 350′′have been removed from the spatial
anal-ysis. However, it was not possible to estimate the extent of any contribution from the central galaxy to the group emission.
XLSSC 005: No radio sources are identified within the projected
area covered by the X-ray emission. This system displays dou-ble peaked X-ray emission morphology, with each peak associated with a distinct velocity component. The photometric uncertainty for this system is large as less than 200 photons were available for the spatial fit which was limited to Rf it∼ r500/2. The system is further discussed in Valtchanov et al. (2004).
XLSSC 013: No radio sources are identified within 1′of the
Table A1. Error budget for secondary effects. r−
500and r
+
500are the extreme possible values for r500derived from the temperature uncertainties quoted in Table 4
XLSSC 41 29 13
source counts in Rf it,Rspec 819, 523 361, 311 383, 161
r−
500,r500,r+500 171, 179, 196 arcsec 66, 55, 82 arcsec 76, 69, 84 arcsec
LX(r−/+500)−LX(r500)
LX(r500) -2% /+ 4% -1% /+ 0.6% -5% /+ 6%
Ab = 0.1 T = 1.3 (1.1, 1.5) keV T = 4.2 (3.1, 6.1) keV T = 1.0 (0.8, 1.2) keV Ab = 0.3 T = 1.3 (1.2, 1.6) keV T = 4.1 (3.0, 5.8) keV T = 1.0 (0.9, 1.2) keV Ab = 0.6 T = 1.5 (1.3, 1.7) keV T = 4.0 (3.0, 5.5) keV T = 1.0 (0.9, 1.3) keV Undetected AGN contribution
R < 500 kpc 0.6 % 0.5 % 0.8 %
yet does not affect the cluster classification procedure and the point source is removed from the subsequent spatial and spectral analy-sis.
XLSSC 022: The X-ray profile is peaked and here is a weak radio
source within 2′′of the X-ray emission centroid (S
tot= 0.15 mJy,
no extent). The spectrum of the central galaxy displays no signif-icant emission features consistent with AGN activity. The cluster morphology is very similar to XLSSC 025 in that Rcand β values
do not vary significantly depending upon the inclusion of the cen-tral bin in the spatial analysis. We therefore favour the cool core hypothesis for this system.
cluster a: The X-ray centroid coincides with a radio source (Stot = 0.21 mJy, no extent) within 2 arcsec. The optical spectrum
ob-tained for this object is faint and did not allow us to secure its redshift; however, no emission line is apparent in the spectrum. The photometric redshift is 0.98, with a SBI starburst as best fit-ting spectrum. The flux at 24 µm is 0.4 mJy which is rather high. This suggests that the coincidence between this red object and the X-ray centroid might be fortuitous, but the contamination by an ac-tive nucleus cannot be excluded.
cluster b: An X-ray point source is located some 30′′ from the
X-ray emission centroid and was subsequently removed from the spatial and spectral analyses.
cluster d: A radio source is located within 3′′of the X-ray
emis-sion centroid (Stot= 0.08 mJy, no extent). The optical spectrum of
the central galaxy does not show significant emission features. With an extent of 2.′′5 and a extent likelihood = 21 this marginal