HAL Id: hal-01716289
https://hal.archives-ouvertes.fr/hal-01716289
Submitted on 15 Feb 2019HAL is a multi-disciplinary open access
archive for the deposit and dissemination of sci-entific research documents, whether they are pub-lished or not. The documents may come from teaching and research institutions in France or abroad, or from public or private research centers.
L’archive ouverte pluridisciplinaire HAL, est destinée au dépôt et à la diffusion de documents scientifiques de niveau recherche, publiés ou non, émanant des établissements d’enseignement et de recherche français ou étrangers, des laboratoires publics ou privés.
Voids in short fibre-reinforced injection-moulded parts:
density control vs. mass control
G Saint-Martin, Fabrice Schmidt, Pierre Devos, Christophe Levaillant
To cite this version:
G Saint-Martin, Fabrice Schmidt, Pierre Devos, Christophe Levaillant. Voids in short fibre-reinforced injection-moulded parts: density control vs. mass control. Polymer Testing, Elsevier, 2003, 22 (8), pp.947-953. �10.1016/S0142-9418(03)00045-X�. �hal-01716289�
Voids in short fibre-reinforced injection-moulded parts:
density control vs. mass control
G. Saint-Martin
a, F. Schmidt
a,∗, P. Devos
b, C. Levaillant
aa Ecole des Mines d’Albi-Carmaux, Campus Jarlard, route de Teillet, 81013 Albi Cedex 9, France bDRIRE Midi Pyre´ne´es, 12 rue Michel Labrousse, B.P. 1345, 31107 Toulouse Cedex 1, France
Abstract
Injection-moulded thick plates were produced using a short glass fibre-reinforced thermoplastic. We studied the effect of processing parameters on voids rate inside the parts. Voids rate was measured using an optical microscope. Mass and density measurements were compared with each other in order to define the most relevant method for voids detection. The hydraulic holding pressure level is the most relevant process parameter. As this parameter increases, we found a two-domain relationship between density and mass. In the first two-domain, injection-moulded parts include voids, and mass is proportional to density, with the volume of the part as slope. In the second domain, the slope is different from this volume, parts are void free, but residual stresses appear. We defined an optimum hydraulic holding pressure level, leading to voids free parts. This optimum cannot be detected using mass measurements, but it is easily detectable using density measurements.
Keywords: Injection moulding; Voids; Quality; Mass; Density
1. Introduction
A policy of weight reduction of aeroplanes had been followed for the last 10 years. Equipment designers have been trying to substitute conventional metallic alloys (steel, titanium, aluminium, etc.) for non-structural aero-plane parts. As a consequence, there is currently con-siderable interest in short fibre-reinforced thermoplastic composites. These materials are easily processed and they also offer advantages of low cost and mass or spe-cial characteristics (chemical and fire resistance), very useful in the civil aeronautical field. The injection-moulding process allows the creation of very complex shapes without post machining, and can even be justified with relatively short runs (high added-value parts).
How-∗ Corresponding author. Tel.: 33-5-6349-3089; fax:
+1-33-5-6349-3242.
E-mail address: schmidt@enstimac.fr (F. Schmidt).
ever, the substitution of die cast metallic parts by injec-tion-moulded reinforced polymer parts often leads to very important thickness changes which can result in the generation of void defects [1].
The aeronautical industry produces very complex parts (fan wheels, butterfly valves, etc.) which have to support important stresses for a long time (usually 60 000 h for a civil plane). As voids can lead to stress concentrations and premature breaking[2,3], their detection in injection-moulded parts is crucial. The most common method used to detect voids consists of the observation of cut sections in critical thick regions. However, this method is destruc-tive and it cannot be used when the quality control has to be done on 100% of the parts. In that case, parts are often controlled by their mass. This global parameter can be a good indicator for voids detection, but it is very sensitive to volume variations [4]. Moreover, mass con-trol does not take into account density variations inside the part.
con-trol method which can be used as an alternative to tra-ditional mass measurements: density control. This method is evaluated using short fibre-reinforced injec-tion-moulded thick parts. We first briefly studied the effect of holding pressure, mould and melt temperature, and injection speed on the density of the injection-moulded parts. Then, several holding pressure levels are used to produce the parts. We also proceed to comp-lementary destructive controls in order to have a better understanding of density variations throughout the thick-ness, and to detect voids inside the injection-moulded parts. This leads to the definition of an optimum interval for the holding stage of the injection-moulding process, set using density measurements.
2. Experimental
2.1. Material
The polymer we used for the study is a natural Ultem 2300–1000 supplied by General Electric Plas-tics. It is a 30% short glass-fibre reinforced polyetherim-ide. This grade is widely used in the aeronautical field because of its good mechanical properties. Moreover, in case of fire, its smoke rate and toxicity are very low. The given mass density for this polymer is 1.51 g/cm3.
2.2. Injection-moulding equipment
The parts were manufactured on a 175-ton DK-Codim injection-moulding machine. The maximum injectable volume is 319 mm3. If necessary, the polymer melt
tem-perature can be set up to 420 °C, and the mould tempera-ture can be set up to 230 °C. For Ultem grades, a dry-ing operation is necessary before processdry-ing, which is realised at 140 °C for 5 h with an air-circulating oven.
The mould cavity geometry is a set of two 7-mm thick plates, constituting two modular inserts (seeFig. 1). The
Fig. 1. The injection mould and the manufactured bunch.
gates are optimised in order to have a linear flow front along the plate width. A complete real-time data acqui-sition system is added together with the injection-mould-ing machine. Data acquisition is based on self-developed Labview software, using up to 16 data channels. Press-ure transducers and temperatPress-ure sensors can help to understand the polymer thermodynamic evolution inside the mould cavity during the injection moulding cycle.
2.3. Injection moulding experiments
A first experiment series was realised using the Tagu-chi method [5]. The studied processing parameters are listed below:
! Mould temperature (level 1, 140 °C ; level 2, 180 °C) ! Melt temperature (level 1, 380 °C ; level 2, 420 °C) ! Hydraulic holding pressure (level 1, 0 MPa; level 2,
10 MPa)
! Injection speed (level 1, 20 mm/s; level 2, 50 mm/s). All other process parameters were kept constant. The output data of the experiment series is the apparent den-sity of the injection-moulded parts. Each plate of the set was cut at the end of the gate (see Fig. 1). The density measurements were realised using the ISO1183 standard. The immersion liquid was distilled water at 23 °C. The part apparent density was calculated as below:
dapp!
M1
M1"M2
(1) where M1is the mass of the part, and M2is the mass of
the immersed part.
The hydraulic holding pressure level explains 80% of the effects on the apparent density. Both mould and melt temperatures explain 5% of the effects. The injection speed effect is not significant. Some moderated interac-tions appear between the holding pressure and tempera-tures. Considering these results, we decided to study the effect of the holding pressure level in further experi-ments.
The second series of injection moulding experiments involved variation of the hydraulic holding pressure with the levels set at 0, 1, 2.5, 5, 7.5, 10 and 12 MPa. The holding stage duration was set to 20 s, and was kept constant like all the other process parameters. Melt and mould temperatures were respectively set to 406 and 180 °C. The injection speed was set to 30 mm/s for the filling of the plates. The feed channels were fed at an injection speed of 20 mm/s, and the gates at 10 mm/s in order to avoid a slight jetting phenomenon.
A superposition of the different polymer pressure cycles inside the cavity is presented on Fig. 2 (where HPL means hydraulic pressure level). The packing level is similar for all cycles. The slight variations are due
Fig. 2. Injection-moulding pressure cycles.
to the packing-holding shift, which is realised using an imposed hydraulic pressure. When the hydraulic pressure level increases, the polymer pressure decreases more slowly, and the shrinkage compensation becomes more efficient. All injection-moulded parts did not present any visible faults which leads to very strong solidified skins during holding and cooling stages. As a consequence, the thermal shrinkage phenomenon leads to void creation instead of surface shrinkage.
2.4. Global mass and density measurements
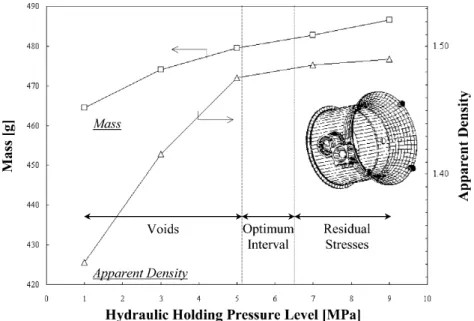
Fig. 3 shows mass and apparent density vs. the
hydraulic holding pressure level (HPL). We notice an almost linear variation for the mass and an important saturation effect for the apparent density when HPL
Fig. 3. Mass and apparent density vs. hydraulic holding press-ure level.
increases. Fig. 4presents mass vs. the apparent density. Two distinct regions appear for this relationship. The first one corresponds to HPL going from 0 to 5 MPa. The slope in this region corresponds to the volume of the part:
!
∂M∂dapp
"
HPL#5 MPa! V (2)
where M is the mass, dapp the apparent density, and V
the volume of the controlled part (50 cm3in this case).
For HPL values over 5 MPa, Eq. (2) is not valid. This second region does not respect the basic physical relationship between mass and apparent density, but is a saturation effect corresponding to the creation of wire edges, mould opening and residual stresses [6].
2.5. Density measurements throughout thickness
Previous apparent density measurements only give us global information. It is well known that the thermodyn-amic history of the polymer has an effect on the density
[7,8]. As this thermodynamic history can change through the thickness, we made destructive apparent density measurements as presented inFig. 5.
Three 20 × 20 × 7 mm3square samples are cut in the
middle of the parts. They correspond to HPL values of 0, 5 and 10 MPa. Successive polishing operations and apparent density measurements were made, as shown in
Fig. 5. Each layer’s density can then be measured, using a reverse recurrence method:
∀ k![1 ; n"1] , dk! 1 Hk"Hk"1 ·
!
HkDk (3) "#
n"1 i ! k hidi"
and hn! Hn; dn! DnFig. 6 shows the evolution of the polymer density
through the thickness for the three HPL levels tested. First, HPL has a slight effect on the thickness of the part. Then, the density of both skin and core layers of the thickness are not much affected by HPL. The most important differences are located in intermediate layers. Many voids are observed inside intermediate layers for HPL = 0 MPa. Some small voids are still observed at the same place for HPL = 5 MPa. For HPL = 10 MPa, no voids are observed but the density changes through the thickness. Hence, the global apparent density of a part corresponds to the average value of a complex vari-ation.
Fig. 5. Density measurement method throughout thickness.
Fig. 6. Polymer density variation throughout thickness.
2.6. Global voids rate measurements
Ten parallelepiped samples were cut from each injec-tion-moulded plate, as shown in Fig. 7. Their sections were polished and observed with an optical microscope coupled to a CCD camera. An image analysis was then performed using Aphelion software. Voids were detected with a threshold operation and we calculate a global void rate tV as:
tV! 1 V·
#
k Vk$
#
i!
Svi Si"%
(4) where i is the image number, Si the image surface, Svithe void surface in the image, k the number of the paral-lelepiped sample, Vk the volume of the parallelepiped
Fig. 7. Voids rate measurement method.
InFig. 8, the evolution of void rate is plotted vs. the hydraulic holding pressure level. For HPL over 5 MPa, the injection-moulded parts are void free. Below this value, voids rate increases when HPL decreases.
3. Discussion
The hydraulic holding pressure level has a significant effect on void rate (seeFig. 8). In our experiments, the minimum HPL value leading to void free parts is between 5 and 7.5 MPa. Complementary injection-moulding experiments and void observations show that this minimum value is 6.5 MPa [4].
While increasing HPL, the mass increases with an almost linear profile (see Fig. 3). On the contrary, the apparent density increases with a significant change of slope, corresponding to the minimum HPL value leading to void free parts. Then, from this point of view, apparent density measurements are more accurate than mass measurements for void detection.
HPL = 5 MPa is also an important factor (see Fig. 4). This means that a high HPL leads to a volume increase, but not to a density increase (mould opening, wire edges creation, etc.). This is a very common error in the indus-try when injection moulders are setting a process. They usually measure the mass and define processing para-meters, only using these measurements. This application shows that this method is relatively imprecise. It can lead to void-free parts, but also, for example, to important residual stresses. Therefore, if dissection is not possible (because of cost or time problem for example), apparent density measurements can be a good alternative.
The apparent density control method needs a double mass measurement (one in the air, and one immersed). The investment required for its application is not accept-able for most of the industrial cases (high productivity fields). Nevertheless, it is mainly intended for high added-value products, where cycle time does not really matter. The aeronautical field is a good example.
The particular case of this 7-mm thick plate still has to be checked on another geometry. Other injection moulding experiments were then realised on a butterfly-valve body. While increasing HPL values, we measured mass and apparent density of the produced parts. The results are reported in Fig. 9. The material is a black Ultem 2300-1000 from General Electric Plastic. The results are similar to the ones we described for the thick plate. While HPL increases, the mass increases with an almost linear profile. On the contrary, the apparent den-sity presents a slope change corresponding to the begin-ning of the optimum HPL interval (approximately from 5.1 to 6.5 MPa). Over this interval, the butterfly-valve bodies include significant residual stresses and become fragile. Below this interval, destructive dissections show
Fig. 9. Mass and apparent density vs. HPL for an industrial part.
some voids. Thus, this phenomenon of slope change with the apparent density vs. HPL is applicable to other cases. Density measurements through the thickness show some significant variations, even for high HPL values
(see Fig. 6). This is due to the thermodynamic history
of the polymer. Cooling is, for example, slower in the core layer than in the skin layer [6–8]. Therefore, an apparent density must be considered as an average value. The local density depends on the position through the thickness and on the position in the part. This explains why average density values reported on Fig. 6 are slightly different from the ones reported in Fig. 3. Pre-dicting a local density of an injection-moulded part is a complicated scientific challenge [4,6,7], but this study shows that it is possible to use global apparent density measurement as a quality control tool for void detection and process setting.
4. Conclusions
This study suggests that apparent density control can be a good non-destructive method for void detection. Mass control is not able to indicate void presence to injection moulders, or even on residual stresses creation. Therefore, for high added-value products that cannot be tested by a destructive method (100% control), mass measurements are not sufficient for setting the process.
This study also shows an interesting phenomenon con-cerning voids location. In Fig. 6, we notice that voids are located in intermediate layers of the thickness. This is a surprising result, because we first expected voids to be in the core layer (where the polymer temperature is the highest). As a consequence, we are currently
study-ing the effect of HPL and reinforcement rate on void location and morphology (shape, size, quantity, etc.)[4]. We are also currently evaluating other non-destructive methods in order to detect voids in thick injection-moulded parts. Ultrasonic and X-rays controls appear to be interesting and very sensible approaches for detecting this defect [4]. However, for a complicated geometry (butterfly-valve body, for example) theses methods are hardly applicable due to thickness variations. Then, the apparent density control is again the easiest and cheapest method to use for non-destructive void detection. Acknowledgements
The authors wish to thank S. Leroux for assistance with image analysis, and E. Jourdain for helpful work on this project. Special thanks go to C. Rossignol (Liebherr Aerospace) for the injection-moulding experiments on butterfly-valves bodies.
References
[1] M.J. Bevis, P.S. Allan, P.C. Emeanuwa, Thick section reinforced thermoplastics injection moulding, in: 2nd
Inter-national Conference: Fiber Reinforced Composites, Liver-pool, England, 1986.
[2] G.L. Beall, Thick walls encourage sink marks and voids, Kunststoffe German Plastics 82 (1992).
[3] G.L. Beall, Uncontrollable dimensions sink marks and internal voids, Kunststoffe German Plastics 83 (1993). [4] G. Saint-Martin, F. Schmidt, P. Devos, C. Levaillant,
Advanced controls and measurements for the injection moulding of a short fiber reinforced polymer, in: Proceed-ings of the 18th Polymer Processing Society Annual Meet-ing, Guimara˜es, Portugal, 2001.
[5] M. Pillet, Introduction aux plans d’expe´riences par la me´thode Taguchi, Les Editions d’Organisation, Paris, 1994 In French.
[6] M. Vincent, T. Giroud, Evaluation of residual stresses in injection moulded thermoplastics and fiber reinforced thermoplastics, in: Proceedings of the 18th Polymer Pro-cessing Society Annual Meeting, Guimara˜es, Portugal, 2001.
[7] J.F. Agassant, P. Avenas, J.P. Sergent, P. Carreau, Polymer Processing, Hanser, 1991.
[8] G. Re´gnier, Anisotropie des proprie´te´s dimensionnelles et me´caniques des polyme`res injecte´s, in: Proceedings of the CNRS Thematic Summer School, Agay, France, 2002 (In French).