HAL Id: hal-00719014
https://hal.archives-ouvertes.fr/hal-00719014
Submitted on 19 Jul 2012
HAL is a multi-disciplinary open access
archive for the deposit and dissemination of
sci-entific research documents, whether they are
pub-lished or not. The documents may come from
teaching and research institutions in France or
abroad, or from public or private research centers.
L’archive ouverte pluridisciplinaire HAL, est
destinée au dépôt et à la diffusion de documents
scientifiques de niveau recherche, publiés ou non,
émanant des établissements d’enseignement et de
recherche français ou étrangers, des laboratoires
publics ou privés.
Nitrate elimination by denitrification in hardwood forest
soils of the Upper Rhine floodplain - correlation with
redox potential and organic matter
Ingrid Brettar, Michèle Trémolières, Jose-Miguel Sanchez-Perez
To cite this version:
Ingrid Brettar, Michèle Trémolières, Jose-Miguel Sanchez-Perez. Nitrate elimination by
denitrifica-tion in hardwood forest soils of the Upper Rhine floodplain - correladenitrifica-tion with redox potential and
organic matter. Hydrobiologia, Springer, 2002, vol. 469, pp. 11-21. �10.1023/A:1015527611350�.
�hal-00719014�
O
pen
A
rchive
T
OULOUSE
A
rchive
O
uverte (
OATAO
)
OATAO is an open access repository that collects the work of Toulouse researchers and
makes it freely available over the web where possible.
This is an author-deposited version published in :
http://oatao.univ-toulouse.fr/
Eprints ID : 5686
http://dx.doi.org/10.1023/A:1015527611350
To cite this version
: Brettar, Ingrid and Sanchez-Pérez, José-Miguel and
Trémolières, Michèle Nitrate elimination by denitrification in hardwood forest
soils of the Upper Rhine floodplain – correlation with redox potential and
organic matter.
(2002) Hydrobiologia, vol. 469 (n°1-3). pp. 11-21. ISSN
0018-8158
Any correspondance concerning this service should be sent to the repository
administrator: [email protected]
.Nitrate elimination by denitrification in hardwood forest soils of the Upper
Rhine floodplain – correlation with redox potential and organic matter
Ingrid Brettar
1, Jos´e-Miguel Sanchez-Perez
2& Mich`ele Tr´emoli`eres
31GBF – German Centre for Biotechnology, Dept. Environmental Microbiology, Mascheroder Weg 1,
D-38124 Braunschweig, Germany
Tel: +49-531-6181-440. Fax: +49-531-6181-411. E-mail: [email protected]
2CESAC (UMR CNRS), 29 rue Jeanne Marvig, F-31055 Toulouse C´edex, France
3Centre d’Etudes et de Recherches Eco-G´eographiques (CEREG) (UMR 7007 CNRS/ULP), 28, rue Goethe,
F-67083 Strasbourg, France
Key words: hardwood forest, floodplain soil, redox potential, denitrification, nitrate reduction, Upper Rhine valley
Abstract
Denitrification in floodplains is a major issue for river- and groundwater quality. In the Upper Rhine valley, floodplain forests are about to be restored to serve as flood retention areas (polders). Besides flood attenuation in downstream areas, improvement of water quality became recently a major goal for polder construction. Redox potential monitoring was suggested as a means to support assessment of nitrogen elimination in future floodplains by denitrification during controlled flooding. To elucidate the relationship between redox potential and denitri-fication, experiments with floodplain soils and in situ measurements were done. Floodplain soil of two depth profiles from a hardwood forest of the Upper Rhine valley was incubated anaerobically with continuous nitrate supply. Reduction of nitrate was followed and compared with redox potential and organic matter content. The redox potential under denitrifying conditions ranged from 10 to 300 mV. Redox potential values decreased with increasing nitrate reduction rates and increasing organic matter content. Furthermore, a narrow correlation between organic matter and nitrate reduction was observed. Experiments were intended to help interpreting redox potentials generated under in situ conditions as exemplified by in situ observations for the year 1999. Results obtained by experiments and in situ observations showed that monitoring of redox potential could support management of the flooding regime to optimize nitrogen retention by denitrification in future flood retention areas.
Introduction
Floodplains are of great relevance for the water quality of river- and groundwater. The potential of floodplains to retain or eliminate nitrogen has been demonstrated by several studies (e.g. Lowrance et al., 1984; Peter-john & Correll, 1984; Haycock et al., 1993). The high nitrogen load of the Rhine is a major problem affect-ing groundwater and the North sea as the recipient ecosystem (Trémolières et al., 1992; Behrendt et al., 1999; Caraco & Cole, 1999). Nitrogen elimination in floodplains could be a means to reduce the nitrogen load of the Rhine. At the Upper Rhine, a major reduc-tion of the nitrogen load in floodplains would result from elimination of groundwater derived nitrogen that finally would reach the river. Especially, in the light of
the actual situation that floodplain forests are about to be restored at a large scale in the Upper Rhine valley (Dister, 1991; Ministerium Umwelt & Verkehr Baden– Württemberg, 1996), enlarged floodplain area would be available for N-elimination. In the 19th and 20th century, the pristine floodplain had been reduced by about 90% due to regulation and channelization meas-ures of the Upper Rhine, thereby reducing the pristine floodplain forests to about 1% of their pristine exten-sion and resulting in increased flooding downstream of the regulated sector. To counteract flooding, flood re-tention areas (polders) are now about to be built along both sides of the Upper Rhine. Besides the goal to retain floods, restoration of floodplain forests, mainly hardwood forests, and improvement of water quality are major issues for the polders.
Denitrification can be a major factor for elimin-ating nitrogen in forested floodplains (Brinson et al., 1984; Lockaby & Wallbridge, 1998). Denitrification can contribute to reduction of the N-load of the flood-plain soil, the ground- and surface waters (run off, flood water), and thus protect the river from land derived N-load. As denitrification is enhanced by oxy-gen defiency, wetting of floodplain soils by flooding or rising groundwater supports denitrification due to reduced oxygen supply (Megonical et al., 1993). Man-agement of flooding in a way to optimize nitrogen elimination by denitrification could be an appealing task that could be approached in the future restored floodplain forests of the Upper Rhine. As a tool to assess denitrification, measurements of redox poten-tials can be conceived. Redox measurements can be run in a continuous way, are non-destructive and do not influence the conditions prevailing in the soil, as all sampling and sample handling tends to do (Patrick et al., 1996). Some authors attributed ranges of redox potential to specific biogeochemical processes such as denitrification, iron reduction, or methanogenesis (Masscheleyn et al., 1993; Patrick et al., 1996). Fur-thermore, the organic matter is of interest as a ma-jor regulatory factor of denitrification in floodplains (DeLaune et al., 1996).
The relationship between nitrate elimination by de-nitrification, redox potential and organic matter was analyzed in experiments with soils of the Upper Rhine floodplain forests. A major goal was to test the util-ity of redox potential as a tool to assess denitrific-ation during controlled flooding of the upper Rhine floodplain forests. Besides these experiments, redox potential measurements in a hardwood forest of the Upper Rhine were performed during dry and flooded periods and interpreted by using the experimentally derived relationships. Possible applications of redox potential for managing the flooding regime of polders for nitrogen elimination will be discussed.
Materials and methods
Study site and sampling
The study area is a hardwood forest station in the natural reserve of Rhinau, France, 50 km south of Strasbourg. The natural reserve of Rhinau comprises one of the few relicts of natural floodplain forests of the Upper Rhine valley with a nival flooding re-gime. Major floods occur in summer due to snow
melting in the alpine watershed, resulting in a rise of the groundwater table by 2–3 m. The vegetation of the hardwood forest is dominated by oak (Quercus
robur), ash (Fraxinus excelsior) and poplar (Populus alba). The soil are very calcareous (25% total
carbon-ate, pH>7.5) and young (Fluvent A/C type, USDA). The soils are silty to silty-clayey in the upper horizons with increasing sand content with depth; they become coarse-textured with greater depth (>1 m: sand and gravel). More details on the study site are given else-where (Sanchez-Perez et al., 1993; Trémolières et al., 1998).
This study concentrated on the levées (or ridges, as called by Lockaby & Wallbridge, 1998), i.e. the sandy terraces that represent the major fraction of the area of the hardwood forests. Groundwater table is on average at 1.30 m below soil surface unless dur-ing flooddur-ing. Details on general soil characteristics are given in Table 1.
Samples were obtained from two depth profiles (A,B) of the levées (0–105 cm depth) sampled in a dry summer period (late June) with soil temperatures
around 15◦C. Soil was dry and oxic with redox
po-tential values ranging from 450 to 510 mV, with lower values in the top soil. Samples were stored 4 weeks in
glass jars at 2–3◦C until the start of the experiments.
More details on the sampled levée soils are given in Table 2.
Experimental set up and activity measurements
Samples obtained from four depths (0, 30, 60 and 100 cm, see Table 2) of two depth profiles (A,B) of the levées were used to set up experiments on the denitrification capacity of the floodplain soil under conditions of permanent nitrate surplus.
Per sample, 500 g of soil were freed from roots and homogenized. Subsamples were frozen for later analysis (N-compounds, organic matter). Twenty g of soil sample was added to a 150 ml gas tight glass jar equipped with a butyl rubber stopper. The
experi-ment was started by adding 50 ml of nitrate (KNO3,
10 mg N/l) and flushing the samples with purified nitrogen (>99.995). The experiment was run in five replicates per soil sample, i.e. a total of 40 assays consisting of five replicates of four depths taken from two profiles. Incubation was done in the dark on a
rotary shaker at 20◦C. Nitrate solutions were added
by syringe through rubber stoppers in a way that the nitrate supply always exceeded consumption. High ni-trate additions at the beginning of the experiment were
Table 1. General characterization of floodplain soils of hardwood forest (lev´ee) of Rhinau (France)
Horizon Depth pH Sand Silt Clay CaCO3 Corg Norg NO−3 NH+4
(cm) (%) (%) (%) (%) (gC kg−1) (gN kg−1) (gN kg−1) (gN kg−1) Al 0–30 8.0 10.0 59.7 30.3 29.0 23.9 2.4 8.0 31.6 C 30–100 8.4 36.2 42.6 21.2 28.9 7.2 0.7 4.6 9.0 Cg 100–140 8.7 87.8 11.2 4.9 17.5 2.4 0.2 0.2 2.2
avoided in order not to create high nitrite concentra-tions. To monitor the nitrogenous compounds, small subsamples (0.2–0.5 ml) were taken with syringes and
analyzed for NO−3, NO−2 and NH+4. Samples were
taken just after the start of the experiment (0-sample:
5.5 h after KNO3 -addition), on day 1 (17.5 h after
0-sample), 6, 9, 15 and 23.
Redox potential measurements were made on day 23. Measurements were done under an Argon atmo-sphere. Samples were stirred and values recorded after obtaining a stable reading. Redox potentials measure-ments were not done before day 23 because maesure-ments were only possible when the vials were opened. Opening of the vials was restricted to day 23 in order to avoid loss of any volatile substances (C or N-compounds), that could function as electron donor or acceptor in the ongoing experiment. Redox measure-ments were repeated after continuing the incubation for 5 months with nitrate supply.
Nitrate reduction rates given are calculated based on the disappearance of nitrate and nitrite. The nitrate plus nitrite consumption rates can be regarded as de-nitrification rates because the ammonium production was too low and could be attributed to mineralization of the organic matter, but could not account for dis-similatory nitrate ammonification (Brettar et al., un-publ. results). The acetylene inhibition method could not be used to quantify denitrification, because acet-ylene can be used as a carbon source after prolonged incubation and may influence kinetics of denitrifica-tion (Culbertson et al., 1981; Brettar & Rheinheimer, 1992).
Analysis of soil and soil suspensions
Nitrogenous compounds (NO−3, NO−2, NH+4) were
analyzed using colorimetric methods as described by Grasshoff et al. (1983). For analysis of soil samples, analysis was preceeded by soil extraction with
ul-trapure water (NO−3, NO−2) or 0.5 M K2SO4(NH+4).
The dry weight of the soil was determined as
weight loss during drying of the soil sample at 105◦C
to weight constance. pH was determined in a aqueous solution (1:2 soil/water) with fresh soil.
Organic matter was determined as loss on ignition
by combustion of dried sample (pre-dried at 105◦C to
weight constance) at 375◦C for 16 h (Ball, 1964;
Dav-ies, 1974) as outlined by Sanchez-Perez (1992). This
method was used because of the very high CaCO3
-content (up to 30%) of the soils. A comparison of loss-on-ignition with determination of organic carbon
after oxidation by sulfochromic acid at 135 ◦C for
Rhine floodplain soils (Sanchez-Perez, 1992) gave a factor of 0.43 (S.D. 0.12) to convert the values ob-tained for organic matter by loss-on-ignition to organic carbon. We assume that the conversion factor from loss on ignition to organic carbon is somewhat higher. Brinson et al. (1984) used a conversion factor of 0.5
after igniting the sample at 500◦C. The lower
temper-ature we used can be assumed to burn a lower fraction of the organic matter, thus the conversion factor to organic carbon should be somewhat higher than 0.5.
Redox potential measurements were done by us-ing platin electrodes against Ag/AgCl-reference elec-trodes. Electrodes were constructed and measure-ments were done according to Faulkner et al. (1989). In the experiment, Eh-measurements were done in an Argon atmosphere. In the field, two Pt-electrodes were permanently installed per depth. In the levées, elec-trodes were permanently installed at 5, 35, 60, 70 and 120 cm from spring 1998 to autumn 1999. To check proper working of the electrodes, new electrodes were introduced and the measurements compared after 1 and 2 days of installation. Reading of redox values was done after reaching stable values. Redox potentials are corrected for the Ag/AgCl-reference electrodes by adding 217 mV for the field (for an average
temperat-ure of 10◦C), and 210 mV for measurements at room
temperature (experiments) as indicated by the manu-facturer (Ingold GmbH, Frankfurt). Corrections of the
T able 2 . Char acter ization o f soil sam ples of le v ´ees of a h ardw ood fores t (Rhinau) before and after incubation: (v alues g iv en are av erage v alues of sa m p les from p rofile A and B, in br ack ets : S .D .) Depth O rg anic m atter D ry weight pH pH a Eh Eh a Eh a NO − 3-re duc ti o n a NO 3 -re duc ti o n a (c m ) (% los s/ignition. ) (%) in situ (+ NO − 3,2 3 d ) in situ (+ NO − 3,2 3 d ) (+ N O − 3, 150 d) day 1 day 2 3 (m V) (m V) (m V) (m gN kg − 1day − 1)( m g N k g − 1day − 1) A b BA b B 0–5 6. 91 (0. 66) 68. 9 (0. 8) 7. 79 (0. 01) 7. 73 (0. 04) 459 (16) 24 (11) 140 (25) 16. 9 (1. 1) 15. 6 (3. 0) 26. 0 (0. 6) 23. 0 (0. 3) 30–35 2. 28 (0. 57) c 79. 2 (0. 4) 8. 13 (0. 07) 7. 84 (0. 09) 501 (15) 134 (99) d 292 (18) 28. 7 (1. 9) 12. 9 (1. 2) 8. 1 (0. 6) 5. 3 (0. 6) 60–65 0. 84 (0. 16) 81. 5 (2. 9) 8. 45 (0. 07) 7. 93 (0. 16) 521 (13) n. d. 250 (34) 3. 2 (0. 6) 1. 2 (1. 2) 3. 0 (0. 3) 1. 2 (0. 8) 100–105 0. 41 (0. 22) 80. 0 (0. 9) 8. 52 (0. 05) 8. 38 (0. 15) 513 (6) 258 (25) 281 (18) n. d. n. d. 0. 8 (0. 3) 0. 6 (0. 3) aMeas ured after incubation w ith nitrate containing w ater . bV alues of profile A and B are gi v en separately , per p rofile and depth: n =5. cProfile A: 2. 68%; profile B : 1. 87%. dProfile A: 40 m V (12); p rofile B : 225 m V (24). n. d. : not determ ined.
Eh measurements for pH were not done as suggested by Patrick et al. (1996).
All data on soil refer to fresh weight of soil. The dry weight of the samples is given in Table 2. Fresh weight was preferred over dry weight because addition of soil to the single assays was on a fresh weight basis (20 g fresh soil per glass jar). In this way, the para-meters can be directly related to the concentrations in the single assays. This was of specific interest for the redox potential that was supposed to be related to the actual concentrations in the assays.
Statistical analysis
All data evaluation was done with the Statgraph-ics statistical graphStatgraph-ics systems (Statistical GraphStatgraph-ics Corp.). All regressions (least-squares) were calcu-lated with a 95% confidence limit (=inner line (long dashes); outer line (dots)=95% prediction limits).
Results and discussion
Experiments with floodplain forest soil Nitrate reduction vs. sample origin
Nitrate reduction, measured as consumption of nitrate and nitrite, was followed for 23 days in soils from two depth profiles of a hardwood forest of the Up-per Rhine valley. The nitrate reduction rates decreased with soil depth, i.e. the surface samples showed higher consumption rates than samples derived from deeper layers (Table 2). Nitrate reduction rates were constant over time for this time period to a major extent, ex-cept for day 1. Nitrate reduction during the observation period of 23 days ranged from 24.5 mg N (S.D. 0.5 mg N) per day and kg fresh soil for 0–5 cm samples to 0.7 mg N (S.D. 0.3 mg N) for samples from 100 to 105 cm, respectively. On day 1, nitrate reduction rates of samples from 0 to 5 cm and 30 to 35 cm differed from observations on the following days: rates of samples from 0 to 5 cm were lower (by a factor of 1.5), while samples from 30 cm were higher (by a factor of 3.5 for depth profile A, and 2.4 for profile B, respectively) (Table 2).
Nitrate reduction rates vs. redox potential
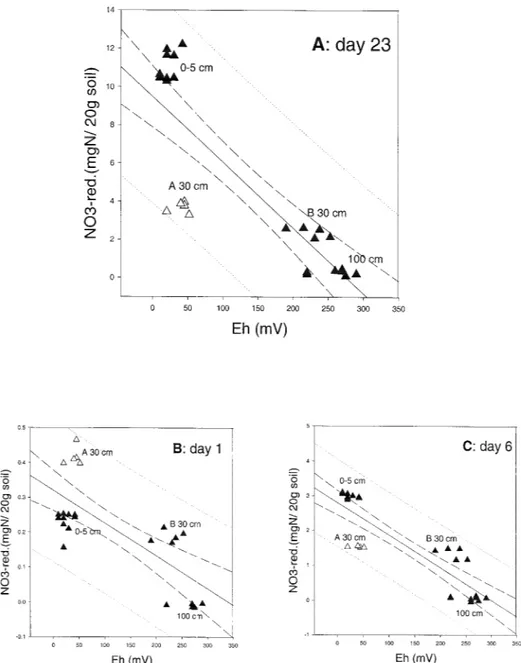
Redox potential was measured after 23 days in assays of samples from 0, 30 and 100 cm. Redox potentials ranging from 10 to 50 mV were obtained for assays of samples from 0 to 5 cm depth from both profiles
and for one sample from 30 cm (profile A, sample A-30). Assays of samples from 100 cm and one sample from 30 cm (profile B) had redox potentials ranging from 190 to 290 mV. Plots of redox potential vs. ni-trate reduction show as a general tendancy, that higher nitrate reduction rates resulted in a lower redox poten-tial (Fig. 1a). After a 5 months incubation with nitrate, redox potentials increased for surface samples to about 140 mV; while samples from deeper horizons ranged between 250 and 290 mV (Table 2); nitrate reduction rates had dropped to about 5.2 mg (S.D. 2.2) N/kg fresh soil×day for the surface samples, and were close to detection limit for deeper horizons.
For a comparison, redox potential (measured on day 23) was plotted vs. nitrate reduction for all sampling days (1–23). All sampling days except day one (Fig. 1b) showed a similar pattern as day 23. As an example, day 6 is given in Figure 1c. On day 1 (Fig. 1b), the increased reduction rates of sample A-30 and the decreased ones of the surface samples (0–5 cm) measured on day one resulted in a different pattern. The opposite was observed for all following sampling days, i.e. the nitrate reduction rates of the surface samples were higher than those of sample A-30.
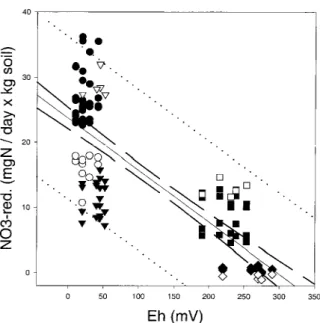
Figure 2 displays the nitrate reduction rates per day and kg fresh soil of all sampling days vs. the redox po-tential measured on day 23. This figure demonstrates the dynamics of the nitrate reduction rates during the incubation period, mainly caused by the change of ni-trate reduction rates between day 1 and the following days. The latter days gave a rather condensed pattern, because the nitrate reduction rates were rather constant from day 6 to 23. The major field of dynamics is in the area with low redox potential values, where one can observe the upward moving of the nitrate reduc-tion rate of the surface samples, and the downward moving of sample A-30. On the other hand, this figure demonstrates that all samples had a time slot within the 23 days where they were very close to the calculated regression line. This means that the nitrate reduction rate is related to the redox potential, on the one hand. On the other hand, it must be taken into consideration that the redox potential might reflect a higher nitrate reduction rate that had occurred some time before the redox measurement was taken.
Redox potential vs. organic matter
A comparison of redox potential with the content of organic matter shows lower redox potentials for samples with higher content of organic matter (Fig. 3). Regression analysis reveals a similar relationship
Figure 1. (a–c) Nitrate reduction plotted vs. redox potential (Eh) as observed for assays of 20 g soil supplied anaerobically with nitrate
containing water. Redox potential was measured on day 23 Nitrate reduction vs. redox potential is shown by (a) for day 23 (r=−0.837, when samples A-30 were omitted: r=−0.978). For a comparison, nitrate reduction rates of day 1 [(b) 17.5 h after 0-value; r=−0.733], and day 6 (c) (r=−0.870) were additionally plotted vs. redox potential values of day 23. Samples of profile A, 30 cm, are shown as white triangles, all other samples are shown as black triangles. Samples from the same depths usually showed similar redox values, irrespective profile A or B, except for samples from 30 cm. Therefore, only sample depths are indicated for 0–5 and 100 cm, but profile and depths are indicated for 30 cm.
between redox potential and organic matter (Fig. 3) as observed for redox potential and nitrate reduction (Fig. 1a). Redox potentials increased after an incubation period of 5 months with nitrate addition in comparison to the measurements after 23 days (Table 2). Con-sumption of organic carbon during the incubation time can be considered as a reason for this observation.
Nitrate reduction vs. organic matter
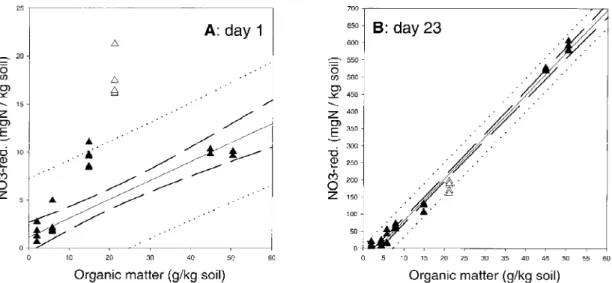
The nitrate reduction rate increased with the content of organic matter, i.e. surface soils with higher con-tent of organic matter had higher rates than deeper soil horizons. A comparison of nitrate consumption with the organic matter content of the soil revealed a nar-row correlation for day 23 and a less narnar-row one for
Figure 2. Nitrate reduction rate per day of all sampling days
plot-ted vs. redox potential (Eh) of the last sampling day (day 23) (r=−0.905, a=−0.093, b=27.19). Open symbols: day 1, filled sym-bols: day 6–23; circles: 0–5 cm depths (profiles A+B), triangles: 30 cm (A), squares: 30 cm (B), diamonds: 100 cm (A+B).
Figure 3. Organic matter content plotted vs. redox potential: a close
correlation is given for the lev´ee samples (black triangles) except for sample A-30 (open triangles) (without A-30: r=−0.976, for all samples: r=−0.868).
day 1 (Fig. 4a,b). More details on kinetics of nitrate consumption and analysis of organic matter are given elsewhere (Brettar et al., unpubl. results).
On day 1, samples of 30 cm depth showed higher nitrate reduction rates in comparison to their organic matter content than the other samples do. This dis-crepancy was most pronounced for sample A-30. With ongoing incubation, all samples showed a nitrate re-duction that is closely correlated with the concentra-tion of organic matter. The high nitrate reducconcentra-tion of sample A-30 in comparison to its organic matter con-tent is paralleled by a low redox pocon-tential. Thus, a high ratio of nitrate reduction rate vs. organic matter occurred concomitantly with a low redox potential; the latter corresponded to the high nitrate reduction rates that were observed at the beginning of the incubation. A high fraction of labile organic carbon in A-30 could be a reason for these observations, i.e. enabling a high nitrate reduction rate that decreases when the labile carbon is consumed.
In conclusion, the experiments with floodplain soils revealed the general trend that nitrate reduction rates increased with (i) increasing content of organic matter and (ii) decreasing redox potentials. Redox po-tential seemed to reflect the nitrate reduction rates to a certain degree. Samples with higher nitrate reduc-tion rates had lower redox potentials; however, redox potential could lag behind a former higher nitrate reduction rate as evidenced for sample A-30.
In situ observations of redox potential in the levée of
the hardwood forest
In 1999, redox values were monitored in the levée (Fig. 5). For most time of the year, the whole depth profile displayed high redox values above 300 mV. A large flood occurred from May to July 1999 with flooding of the levées for 5 weeks and elevated groundwater levels for 10 weeks. Redox measure-ments made after 3 and 5 weeks of flooding showed reduced redox values for the whole soil profile from 5 to 120 cm. Eh values ranged between 200 and 30 mV after 3 weeks of flooding, and decreased to 120
to−60 mV after 5 weeks of flooding. During
flood-ing, nitrate decreased in the soil- and groundwater and had disappeared completely when the reduced depth profiles were observed (Sanchez-Perez et al., 1999). After the flood, a rapid return to high redox values was observed, with the exception of the 120 cm layer. The latter was due to an elevated groundwater table.
Figure 4. (a,b) Nitrate reduction plotted vs. organic matter content of the samples. The amount of nitrate reduced is shown for day 1 (17.5 h
after 0-value; without A-30: r=−0.799) and after 23 days of incubation (all samples included: r=−0.995). Samples of A-30 (white triangles) show higher nitrate reduction on day 1, but fit into the regression after 23 days of incubation.
Figure 5. Redox potential measured in situ for a lev´ee station of
hardwood forest soils of Rhinau (France) in 1999. Redox values were above 300 mV during non-flooded periods. A long lasting flood occurring from 10 May to 16 July 1999 was reflected by a pronounced decrease of the redox potential below 200 mV affecting the whole depth profile.
The capillary fringe in the floodplain soil was a layer where Eh values ranged frequently between 190 and 290 mV, the range observed during the experi-ments for denitrifying samples with a lower content of organic matter. Figure 6 shows a depth profile of a
Figure 6. Redox potentials measured in situ in a soil depth profile
of a hardwood forest channel (Rhinau, France) in a dry period one month after the flood (13 August 1999).
channel in August 1999, 1 month after the flood had retreated. While the surface soil displayed high redox values, they decreased to around 210 mV in 50 cm depth with the impact of the capillary fringe; in the groundwater saturated layers, redox potentials below 150 mV were usually observed.
Relationship between redox potential, nitrate reduction and organic matter
In our experiments, the denitrifying soil samples from the hardwood forest showed redox potentials ranging from 300 to 10 mV. This range was confirmed by mi-crocosm studies with soils from levées and channels of the same site. These observations are in agreement with studies by several authors that indicate the on-set of denitrification at around 300 mV as outlined by Patrick et al. (1996). A redox potential of 300 mV
is assumed as a value where the O2 content in soil
air is less than 5% and the soils are essentially an-aerobic (Faulkner & Patrick, 1992; Megonical et al., 1993). Patrick et al. (1996) considered redox poten-tials as an indicator of biogeochemical processes in soil. Masscheleyn et al. (1993) assigned specific redox potentials to the onset of different biogeochemical pro-cesses, e.g. denitrification started at 300 mV, iron
reduction at 200 mV and methane production at−150
mV. For hardwood forest soils of the Upper Rhine, we also assume the onset of denitrification around 300 mV. However, with increasing carbon content (e.g. top soil, accumulations of organic matter as in oxbows), the redox potential in denitrifying soils is expected to decrease down to 0 mV.
Our experimental studies showed that with in-creasing nitrate reduction rates the redox potential decreased. This relationship is consistent with stud-ies by Masscheleyn et al. (1993) that showed that denitrification rates increased with decreasing redox potentials when nitrate was added to soil solutions
with redox potentials from 300 to−200 mV.
Redox potential values in our studies decreased with increasing carbon content of the sample. Addi-tionally, nitrate reduction rates were very closely and positively correlated with the organic matter content of the samples. Due to the latter close correlation, we assume that the organic carbon directly determined the nitrate reduction rates, after lag and growth phases of the denitrifying bacteria have been overcome. The ni-trate reduction rate was reflected by redox potentials from 10 to 290 mV that decreased with increasing nitrate reduction rates. From our observations, we
as-sume that there is a rather rapid response of the nitrate reduction rate to the actual carbon availability, but a delayed response of the redox potential to a decrease of the nitrate reduction rate. This could explain the un-expectedly low redox potentials of the sample from 30 cm (A-30) that were not in agreement with the actual nitrate reduction rate but with higher rates measured earlier in the experiment.
The observations in the floodplain soil experiments can allow interpretation of redox potential in a fol-lowing way: redox potentials ranging from 0 to 300 mV can indicate denitrification with lower redox po-tentials occurring in soils with higher organic carbon content. In our experiments, top soils with a higher content of organic matter (>2.5% organic matter or approx. >1.3% organic carbon) showed a broad redox range of 10–300 mV within 5 weeks of incubation, while deeper soil horizons with lower organic carbon content (<2% organic matter) ranged from 150 to 300 mV (<2% organic matter, or approx. <1% organic carbon) (Table 2). Below the indicated ranges, we as-sume that nitrate is already conas-sumed, i.e. below 0 mV for top soil and below 150 mV for deeper soil horizons. We suggest to interpret a redox potential be-low 0 mV in top soils and a value bebe-low 100 mV for deeper horizons as to be free or very low in nitrate. As a correlation between the nitrate reduction and redox potential was shown, redox potentials within the range of 0–300 mV can additionally be interpreted as a hint on nitrate reduction rates, with lower redox potentials indicating higher rates.
The in situ-measurements in 1999 of the hardwood forest levée interpreted in the light of the findings of the experiments indicate that (i) during dry periods denitrification was very low or non-existent for all depths and that (ii) during flooding only the surface soils were still denitrifying, while for deeper soil hori-zons nitrate can be considered to have been consumed. This is consistent with former findings of high deni-trification rates in the surface soils measured after and during floods (Brettar et al., 1998), and with the obser-vations that nitrate had disappeared from soil (below 25 cm) and groundwater at the time of redox meas-urements during the flooding period (Sanchez-Perez et al., 1999). In situ measurements of redox potential in the depth profile of the channel can be interpreted in a way that denitrification was most pronounced in the layer just above the groundwater during unflooded periods.
Utility and limits of redox potential measurements for management of Upper Rhine floodplains for
denitrification
Our finding of the correlation of redox potential with nitrate reduction and organic matter content of the floodplain soils of the upper Rhine can be used to help management of floodplains for nitrogen elimination by denitrification. The flood retention areas (polders) will be flooded in a controlled way, i.e. the flooding regime can be regulated deliberately. Flooding of the polders could be done with the feedback of redox potential measurements. Provided that the content of the or-ganic matter of the site where the redox electrodes are installed are known as well as their representativity for the area, redox potential can be used to assess denitri-fication. Flooding can be continued as long as needed to get denitrification started and continued as long as denitrification is likely to proceed. When redox poten-tials drop below the range estimated for denitrification in the respective soil horizon, elimination of nitrate in soil can be assumed to a large extend and flooding can be stopped. Calibration of the redox potential meas-urements in the flood retention areas can be achieved by nitrate analysis of soil and groundwater. In this way, redox monitoring could allow for optimization of flood duration by helping to restrict reduced soil conditions to the time needed for denitrification and avoid too long periods of reduced soil conditions that can cause tree damage (Pezeshki, 1993).
Redox potential could be used to monitor sites with high and rather homogeneous denitrification rates as occurring during floods. Low denitrification rates in unsaturated soils that depend on anoxic and low oxic microniches, e.g. as observed in the organic rich top soil of the hardwood forest under non-flooded conditions, can not be assessed by redox potential measurements (Brettar et al., 1998, 2000). However, N-elimination by denitrification during dry periods is low in comparison to flooded preriods.
In general, the relationship between nitrate reduc-tion rates, carbon content and redox potential can furthermore support modelling of denitrification in the hardwood forest of the upper Rhine, and help to pre-dict nitrogen elimination, e.g., under different flooding scenarios for the artificially flooded retention areas (polders).
Acknowledgements
Manfred G. Höfle is greatly acknowledged for labor-atory support and critical reading of the manuscript. Benoît Sittler is acknowlegded for great support of the field work. We thank Steve Faulkner for support with the construction of the redox electrodes.
References
Culbertson, C. W., A. J. B. Zehnder & R. S. Oremland, 1981. Anaerobic oxidation of acetylene by estuarine sediments and enrichment cultures. Apl. envir. Microbiol. 41: 396–403. Ball, D. F., 1964. Loss on ignition as an estimate of organic matter
and organic carbon in non-calcareous soils. J. Soil Sci. 15: 84– 92.
Behrendt, H., 1999. Nährstoffbilanzen der Flußgebiete Deutsch-lands. Texte, UBA 75/99, Berlin.
Brettar, I. & G. Rheinheimer, 1992. Influence of carbon availability on denitrification in the central Baltic Sea. Limnol. Oceanogr. 37: 1146–1163.
Brettar, I., J. M. Sanchez-Perez, J. Kern, M. Trémolières & H. Rennenberg, 1998. Stickstoffretention in Auenwäldern des Ober-rheins. Deutsche Gesellschaft für Limnologie, Tagungsberichte, Krefeld: 647–651.
Brettar, I., J. M. Sanchez-Perez & M. Trémolières, 2000. Auen und Polder als Stickstoffsenken: Redoxdynamik in Auenwald-böden des Oberrheins. Deutsche Gesellschaft für Limnologie, Tagungsberichte, Tutzing: 439–443.
Brinson, M. M., H. D. Bradshaw & E. S. Kane, 1984. Nutrient assimilative capacity of an alluvial floodplain swamp. J. appl. Ecol. 21: 1041–1057.
Caraco, N. & J. J. Cole, 1999. Human impact on nitrate export: an analysis using major world rivers. Ambio 28: 167–170. Davies, B. E., 1974. Loss on ignition as an estimate of soil organic
matter. Soil Sci. Soc. am. Proc. 38: 150–151.
DeLaune, R. D., R. R. Boar, C. W. Lindau & B. A. Kleiss, 1996. De-nitrification in bottomland hardwood wetland soils of the Cache River. Wetlands 16: 309–320.
Dister, E., 1991. La maîtrise des crues par la renaturation des plaines alluviales du Rhin supérieur. Bull. Soc. Industr. Mulhouse 824: 73–82.
Faulkner, S. P., W. H. Patrick & R. P. Gambrell, 1989. Field tech-niques for measuring wetland soil parameters. Soil Sci. Soc. am. J. 53: 883–890.
Faulkner, S. P. & W. H. Patrick, 1992. Redox processes and dia-gnostic wetland indicators in bottomland hardwood forests. Soil Sci. Soc. am. J. 56: 856–865.
Grasshoff, K., M. Ehrhardt & K. Kremling, 1983. Methods of Seawater Analysis. Verlag Chemie Weinheim, New York. Haycock, N. E., G. Pinay & C. Walker, 1993. Nitrogen in river
corridors: european perspective. Ambio 22: 340–346.
Lockaby, B. G. & M. R. Wallbridge, 1998. Biogeochemistry. In Messina, M. G. & W. H. Conner (eds), Southern Fores-ted Wetlands: Ecology and Management. Lewis, Boca Raton: 149–172.
Lowrance, R., R. Todd, J. Fail, O. Hendrickson, R. Leonard & L. Asmussen, 1984. Riparian filters as nutrient filters in agricultural watersheds. Bioscience 34: 374–377.
Masscheleyn, P. H, R. D. DeLaune & W. H. Patrick, 1993. Meth-ane and nitrous oxide emissions from laboratory measurements
of rice soil suspension: effect of soil oxidation-reduction status. Chemosphere 26: 251–260.
Megonical, J. P., W. H. Patrick & S. P. Faulkner, 1993. Wetland identification in seasonally flooded forest soils. Soil Sci. Soc. am. J. 57: 140–149.
Ministerium für Umwelt und Verkehr Baden–Württemberg, 1996. Rahmenkonzept des Landes Baden–Württemberg zur Umset-zung des Integrierten Rheinprogrammes, Materialien Integriertes Rheinprogramm 7, Stuttgart: 94 pp.
Patrick, W. H., R. P. Gambrell & S. P. Faulkner, 1996. Redox Meas-urements of Soils. Soil Sci. Soc. Am. & Am. Soc. Agronomy, Methods of Soil Analysis, Part 3. Chemical Methods – SSSA Book Series no.5, Madison, WI, U.S.A.: 1255–1273.
Peterjohn, W. T. & D. L. Correll, 1984. Nutrient dynamics in an ag-ricultural watershed: observations on the role of a riparian forest. Ecology 65: 1466–1475.
Pezeshki, S. R., 1993. Differences in patterns of photosynthetic responses to hypoxia in flood-tolerant and flood-sensitive tree speciea. Photosynthetica 28: 423–430.
Sanchez-Perez, J. M., 1992. Fonctionnement hydrochimique d’un écosystème forestier inondable de la plaine du Rhin. Ph.D. Thesis, CEREG, Univ. Louis Pasteur, Strasbourg: 176 pp. Sanchez-Perez, J. M., M. Trémolières, A. Schnitzler, B. Badre & R.
Carbiener, 1993. Nutrient content in alluvial soils submitted to flooding in the Rhine alluvial deciduous forest. Acta Oecologica 14: 371–387.
Sanchez-Perez, J. M., M. Trémolières, Y. Grosshans, D. Hartz, R. Hranitsky & P. Killian, 1999. Rôle de la zone non saturée du sol dans le transfert des nitrates vers les eaux souterraines en zone alluviale inondable. 24e journées GFHN, Strasbourg.
Trémolières, M., I. Eglin, U. Roeck & R. Carbiener, 1993. The exchange process between river and groundwater on the central Alsace floodplain (Eastern France). I. The case of the canalised river Rhine. Hydrobiologia 254: 133–148.
Trémolières, M., J. M. Sanchez-Perez, A. Schnitzler & Diane Schmidt, 1998. Impact of river management history on the com-munity structure, species composition and nutrient status in the Rhine alluvial hardwood forest. Plant Ecology 135: 59–78.