AN AUGMENTED GRAVITY MODEL
AAZAM MOHTARAM GHALATI
DÉPARTEMENT DE MATHÉMATIQUES ET DE GÉNIE INDUSTRIEL ÉCOLE POLYTECHNIQUE DE MONTRÉAL
MÉMOIRE PRÉSENTÉ EN VUE DE L’OBTENTION DU DIPLÔME DE MAÎTRISE ÈS SCIENCES APPLIQUÉES
(GÉNIE INDUSTRIEL) AUGUST 2012
UNIVERSITÉ DE MONTRÉAL
ÉCOLE POLYTECHNIQUE DE MONTRÉAL
Ce mémoire intitulé:
MEDITERRANEAN UNION INTEGRATION: AN AUGMENTED GRAVITY MODEL
Présenté par : MOHTARAM GHALATI Aazam
en vue de l’obtention du diplôme de : Maîtrise ès sciences appliquées a été dûment accepté par le jury d’examen constitué de :
Mme BERNARD Sophie, Ph.D., président
M. WARIN Thierry, Ph.D., membre et directeur de recherche M. FOUCAULT Martial, Doct. ès Sc., membre
ACKNOWLEDGEMENTS
I would like to express my sincere gratitude to my supervisor, Associate Professor Thierry Warin. Your dedication to invaluable instructions and many thoughtful suggestions ever cannot be overstated.
I should like to offer my heartfelt thanks to my family.
To my parents, who has given me so much, thanks for your faith in me, and for teaching me that I should never surrender.
To my sister and her family, it is your persistent support and encouragements that help me overcome insurmountable difficulties. Thank you for everything.
To my brothers for always being supportive.
Last but not least, I am pleased to thank my friend and colleague, Afrooz Moatari. Our academic discussions helped us to obtain fruitful results and always brought ideas to me during my study.
La question principale c’est que si l’union monétaire doit être suivie est adressée par OCA, qui est un point de départ utile pour quelconque discussion sur l’intégration régionale.
Le but de cette étude est l’analyse du niveau d’intégration entre les pays du Moyen-Orient et pays Afrique du nord en relation avec l'union européenne. En fait, le niveau d’intégration entre trois régions est étudié, l'Union Méditerranéenne, la région du MENA et huit pays choisis de la région MENA. L’étude présente sélectionne 12 pays de la région MENA et EU dans son ensemble. Tous les pays Méditerranéens ne sont pas inclus dans cette étude à cause de quelques barrières incluant indisponibilité des données. 12 pays la région du MENA sont Albanie, Algérie, Croatie, Égypte, Israël, Jordanie, Liban, Mauritanie,Maroc,Syrie,TunisieetTurquie. Un modèle de la gravité augmentée est utilisé. La variable dépendant de ce modèle est l’export de la chaque économie à ses partenaires. Les variables indépendantes sont : les variables de la gravité traditionnelle, les variables d'Hecksher Ohlin et variables de convergence. On utilise aussi analyse section transversale des séries chronologiques basant sur le commerce bilatéral. Les
données couvrent la période du 1995 à 2010.
Notre analyse indique que la perspective pour plus d’intégration des trois régions est espérant et encouragent mais encore il reste plusieurs défis. Ces trois défis doivent être comme les relations politiques ou quelques bloquent économiques existants, qui fournissent un tremplin vers l’union monétaire plus grand.
ABSTRACT
Nowadays, the forces of globalization, on the one hand, have shaped the world’s economic environment and on the other hand, led to the increased importance of economic integration. Hence, a faster growth of corporations and countries after they integrated is not a big surprise. Recent studies have shown that the creation of an economic alliance or network is one of the most effective methods to face new global economic opportunities and challenges. The central question of whether a monetary union should be pursued is addressed by the OCA, which is a useful starting point for any discussion on regional integration.
The goal of this study is to analyse the level of integration among the Middle Eastern and North African countries, in relationship with the European Union. In fact, the level of integration in three regions is examined: the Mediterranean Union, the MENA region and eight selected countries from the MENA region. The present study selects 12 countries within the MENA region and the EU as a whole. All countries of the Mediterranean region are not included in this study due to some barriers such as the unavailability of data. 12 countries from the MENA region are Albania, Algeria, Croatia, Egypt, Israel, Jordan, Lebanon, Mauritania, Morocco, Syria, Tunisia, and Turkey.
An augmented gravity model is used. The dependent variable in this model is exports from each economy to its partners. Independent variables are: traditional gravity variables, Hecksher Ohlin variables and convergence variables. We use a cross-section time-series analysis based on the bilateral trade. The data cover the period from 1995 to 2010.
Our analysis shows that the prospect for further integration of the three regions is promising and looks encouraging, but many challenges still persist. These challenges could be such as political relationships or some existing economic blocks, which provide a first stepping stone to a larger currency union.
TABLE OF CONTENT ... VII LIST OF TABLES ... XII LIST OF FIGURES ... XV LIST OF ACRONYMS AND ABREVIATIONS ... XVII LISTE OF APPENDICES ... XVIII
CHAPITRE 1 INTRODUCTION ... 1
1.1 Importance of the Study ... 1
1.2 Areas of the Study and Their Importance ... 2
1.3 Goal and Research Questions ... 3
1.4 Project Structure ... 3
CHAPITRE 2 BACKGROUND ON THE MEDITERRANEAN UNION AND THE MENA REGION……… ... 5
2.1 Background on the Mediterranean Union ... 5
2.1.1 History of the Mediterranean Union ... 5
2.1.2 Institutional Framework of the Mediterranean Union ... 9
2.1.3 Co-Presidency ... 9
2.1.4 Scope and Main Objectives ... 10
2.1.5 Six Concrete Projects of the UfM ... 11
2.2 Background on the MENA Region ... 13
2.2.1 Economic Performance of MENA Region ... 13
2.2.2 Three Groups of Countries within the MENA Region ... 14
CHAPITRE 3 LITERATURE REVIEW ... 15
3.1 A History of the Optimum Currency Area Theory ... 15
3.1.1 Mundell Argumentation ... 15
Shift in Demand and Ability of Labour Mobility and Wage Flexibility ... 16
Debates on Mundell Argumentation ... 18
3.1.2 McKinnon Argumentations ... 18
3.1.3 Kenen Argumentations ... 19
3.2 The Costs of a Common Currency ... 20
3.2.1 Shifts in Demand ... 21
3.2.2 Different Preferences of Countries about Inflation and Unemployment ... 22
3.2.3 Differences in Labour Market Institution ... 23
3.2.4 Differences in Growth Rate ... 23
3.2.5 The Cost of Monetary Union and the Degree of Openness ... 23
3.3 The Benefits of a Common Currency ... 24
3.3.1 Direct and Indirect Gains from the Elimination of Transactional Cost ... 25
3.3.2 Welfare Gains from Less Uncertainty ... 25
3.3.3 Benefits of an International Currency ... 25
3.3.4 Benefits of a Monetary Union and the Openness of Countries ... 26
3.4 Comparison of Costs and Benefits of a Monetary Union ... 27
3.5 The Endogenous Optimum Currency Areas Theory ... 27
4.1 Economy, Geography and History of Albania Relative to its Partners ... 49
4.2 Economy, Geography and History of Algeria Relative to its Partners ... 54
4.3 Economy, Geography and History of Croatia Relative to its Partners ... 56
4.4 Economy, Geography and History of Egypt Relative to its Partners ... 58
4.5 Economy, Geography and History of Israel Relative to its Partners ... 60
4.6 Economy, Geography and History of Jordan Relative to its Partners ... 62
4.7 Economy, Geography and History of Lebanon Relative to its Partners ... 64
4.8 Economy, Geography and History of Mauritania Relative to its Partners ... 66
4.9 Economy, Geography and History of Morocco Relative to its Partners ... 68
4.10 Economy, Geography and History of Syria Relative to its Partners ... 70
4.11 Economy, Geography and History of Tunisia Relative to its Partners ... 72
4.12 Economy, Geography and History of Turkey Relative to its Partners ... 74
CHAPITRE 5 RESEARCH STRATEGY AND METHODS ... 78
5.1 Methodology ... 78
5.1.1 Six Different Gravity Models ... 79
5.1.2 Definition of Variables ... 81
5.2 Sources of Data ... 84
5.3.1 Gravity Model of Trade Integration of the Mediterranean Union based on Rose (2000)'s Specifications ... 86 5.3.2 Gravity Model of Trade Integration of the Mediterranean Union based on Sapir (2001)'s Specifications ... 87 5.3.3 Gravity Model of Trade Integration of the Mediterranean Union based on Egger (2002)'s Specifications ... 89 5.3.4 Gravity Model of Trade Integration of the Mediterranean Union based on Peridy (2005)'s Specifications ... 90 5.3.5 Gravity Model of Trade Integration of the Mediterranean Union based on Warin; Wunnava et al (2008)'s Specifications ... 92 5.3.6 Gravity Model of Trade Integration of the Mediterranean Union based on Warin, Wunnava et al (2009)'s Specifications ... 93 5.3.7 Country Fixed Effects in the Mediterranean Union ... 95 5.4 Analysing Integration of the MENA Region Based on Six Gravity Models ... 95 5.4.1 Gravity Model of Trade Integration of the MENA Region based on Rose (2000)'s Specifications ... 95 5.4.2 Gravity Model of Trade Integration of the MENA Region based on Sapir (2001)'s Specifications ... 97 5.4.3 Gravity Model of Trade Integration of the MENA Region based on Egger (2002)'s Specifications ... 98 5.4.4 Gravity Model of Trade Integration of the MENA Region based on Peridy (2005)'s Specifications ... 99 5.4.5 Gravity Model of Trade Integration of the MENA Region based on Warin, Wunnava et al (2008)'s Specifications ... 100 5.4.6 Gravity Model of Trade Integration of the MENA Region based on Warin, Wunnava et al (2009)'s Specifications ... 102 5.4.7 Country Fixed Effects in the MENA Region ... 103
5.5.4 Gravity Model of Trade Integration of 8 Selected Countries in the MENA Region
based on Egger (2002)'s Specifications ... 113
5.5.5 Gravity Model of Trade Integration of 8 Selected Countries in the MENA Region based on Peridy (2005)'s Specifications ... 114
5.5.6 Gravity Model of Trade Integration of 8 Selected Countries in the MENA Region based on Warin, Wunnava et al (2008)'s Specifications ... 115
5.5.7 Gravity Model of Trade Integration of 8 Selected Countries in the MENA Region based on Warin, Wunnava et al (2009)'s Specifications ... 117
5.5.8 Country Fixed Effects in 8 Selected Countries from the MENA Region ... 118
CHAPITRE 6 CONCLUSION AND POLICY IMPLICATIONS ... 119
6.1 Conclusion on the Mediterranean Union ... 119
6.2 Conclusion on the MENA Region ... 120
6.3 Conclusion on Eight Selected Countries from the MENA Region ... 121
REFRENCES ... 123
APPENDICES ... 132
LIST OF TABLES
Table 2.1 Major trade partners of selected MENA countries (share of total exports in %) ... 14
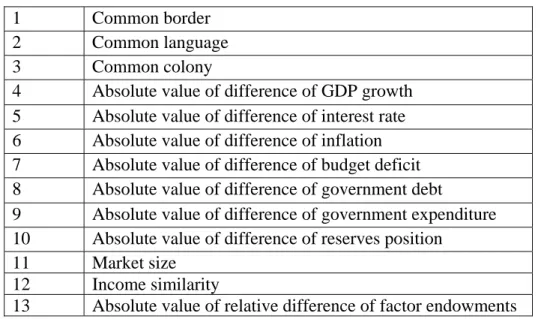
Table 4.1 Definition of variables based on numbers ... 47
Table 4.2 Exports from Albania to its partners ... 50
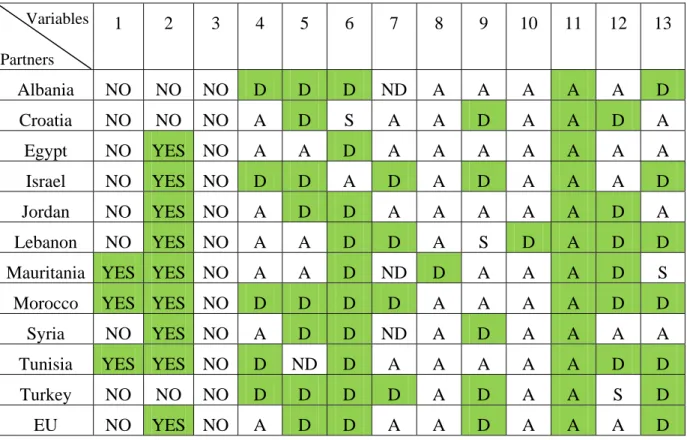
Table 4.3 Status of all pairs originated from Albania relative to explanatory variables ... 53
Table 4.4 Exports from Algeria to its partners ... 55
Table 4.5 Status of all pairs originated from Algeria relative to explanatory variables ... 56
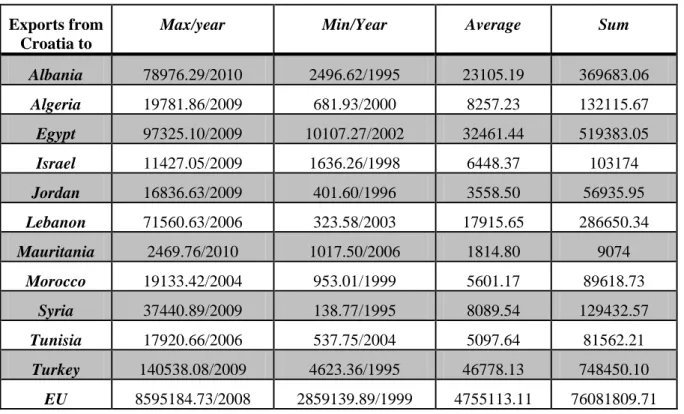
Table 4.6 Exports from Croatia to its partners ... 57
Table 4.7 Status of all pairs originated from Croatia relative to explanatory variables ... 58
Table 4.8 Exports from Egypt to its partners ... 59
Table 4.9 Status of all pairs originated from Egypt relative to explanatory variables ... 60
Table 4.10 Exports from Israel to its partners ... 61
Table 4.11 Status of all pairs originated from Israel relative to explanatory variables ... 62
Table 4.12 Exports from Jordan to its partners ... 63
Table 4.13 Status of all pairs originated from Jordan relative to explanatory variables ... 64
Table 4.14 Exports from Lebanon to its partners ... 65
Table 4.15 Status of all pairs originated from Lebanon relative to explanatory variables ... 66
Table 4.16 Exports from Mauritania to its partners ... 67
Table 4.17 Status of all pairs originated from Mauritania relative to explanatory variables ... 68
Table 4.18 Exports from Morocco to its partners ... 69
Table 4.19 Status of all pairs originated from Morocco relative to explanatory variables ... 70
Table 4.20 Exports from Syria to its partners ... 71
Table 4.21 Status of all pairs originated from Syria relative to explanatory variables ... 72
Table 5.2 Data sources and descriptions ... 85
Table 5.3 Results of gravity model by Rose (2000), Mediterranean Union ... 87
Table 5.4 Results of gravity model by Sapir (2001), Mediterranean Union ... 88
Table 5.5 Results of gravity model by Egger (2002), Mediterranean Union ... 90
Table 5.6 Results of gravity model by Peridy (2005), Mediterranean Union ... 91
Table 5.7 Results of gravity model by Warin, Wunnava et al (2008), Mediterranean Union ... 92
Table 5.8 Results of gravity model by Warin, Wunnava et al (2009), Mediterranean Union ... 94
Table 5.9 Results of gravity model by Rose (2000), MENA region ... 96
Table 5.10 Results of gravity model by Sapir (2001), MENA region ... 97
Table 5.11 Results of gravity model by Egger (2002), MENA region ... 99
Table 5.12 Results of gravity model by Peridy (2005), MENA region ... 100
Table 5.13 Results of gravity model by Warin, Wunnava et al (2008), MENA region ... 101
Table 5.14 Results of gravity model by Warin, Wunnava et al (2009), MENA region ... 103
Table 5.15 Procedures of finding potential groups containing 2 countries include Albania ... 106
Table 5.16 All potential groups containing 2 countries for integration ... 106
Table 5.17 All potential groups containing 3 countries for integration ... 108
Table 5.18 All potential groups contain of 4 countries for integration ... 109
Table 5.19 All potential groups containing 5 countries for integration ... 110
Table 5.21 Results of gravity model by Sapir (2001), eight countries from the MENA region .. 112 Table 5.22 Results of gravity model by Egger (2002), eight countries from the MENA region . 114 Table 5.23 Results of gravity model by Peridy (2005), eight countries from the MENA region 115 Table 5.24 Results of gravity model by Warin, Wunnava et al (2008), eight countries from the
MENA region ... 116 Table 5.25 Results of gravity model by Warin, Wunnava et al (2009), eight countries from the
Figure 3.6 Costs and benefits analysis of a monetary union ... 27
Figure 3.7 Income correlation, integration and OCA line ... 30
Figure 3.8 Direction of movement of a union related to relation between income correlation and openness ... 32
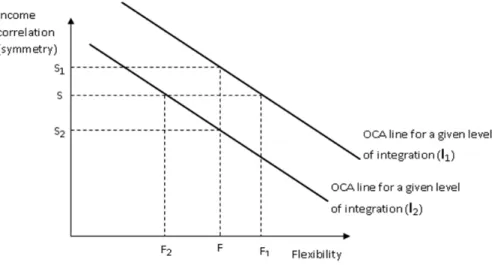
Figure 3.9 Income correlation, flexibility and OCA line ... 33
Figure 3.10 OCA line as a combination of income correlation and flexibility relative to different levels of integration ... 34
Figure 4.1 (a) Exports from Albania to EU; (b) trend line of exports from Albania to EU ... 49
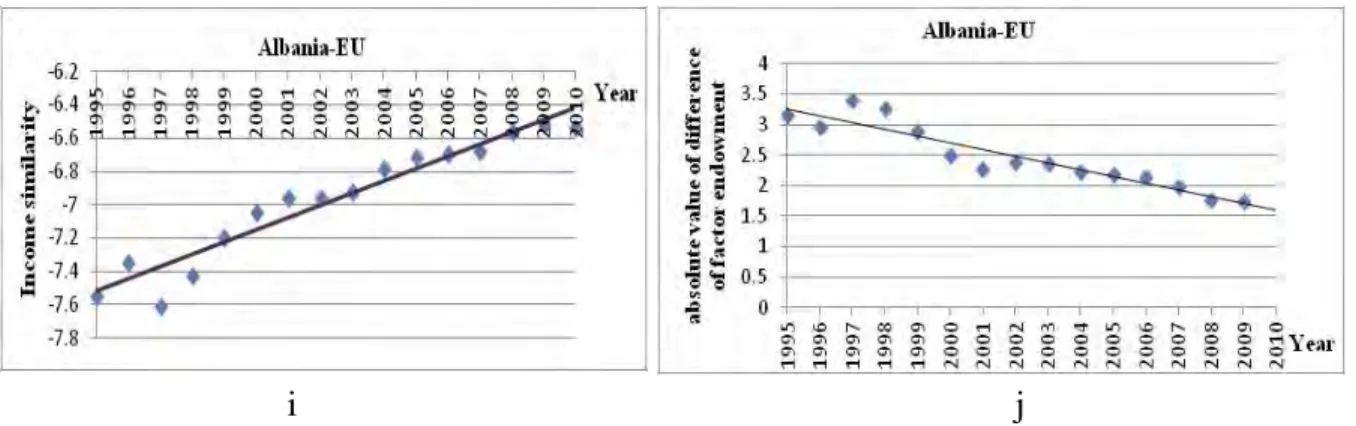
Figure 4.2 TPLC of all explanatory variables for the pair Albania-EU ... 53
Figure 4.3 (a) Exports from Algeria to EU; (b) trend line of exports from Algeria to EU ... 54
Figure 4.4 (a) Exports from Croatia to EU; (b) trend line of exports from Croatia to EU ... 56
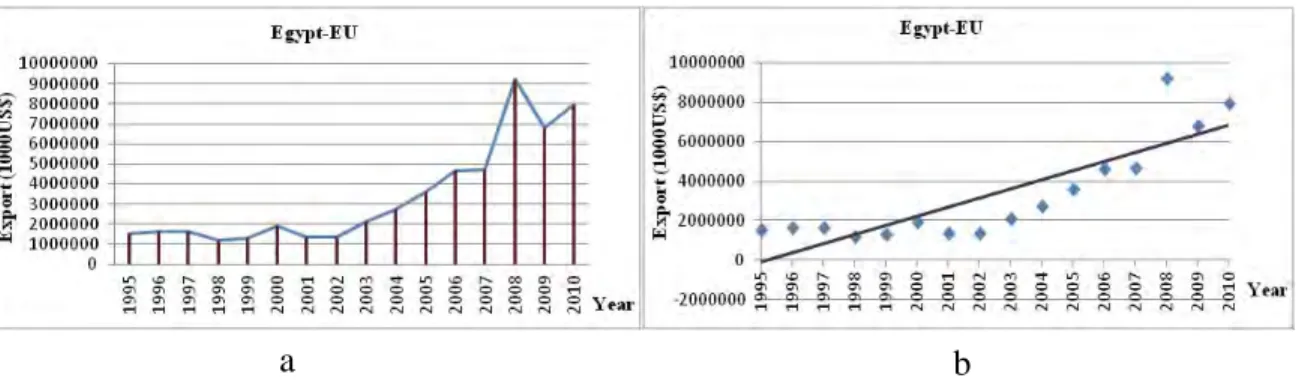
Figure 4.5 (a) Exports from Egypt to EU; (b) trend line of exports from Egypt to EU ... 59
Figure 4.6 (a) Exports from Israel to EU; (b) trend line of exports from Israel to EU ... 61
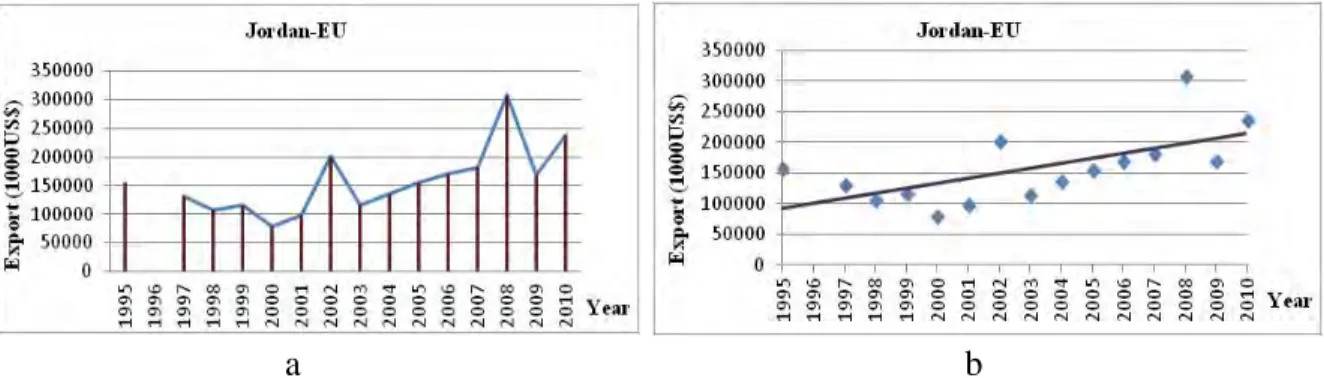
Figure 4.7 (a) Exports from Jordan to EU; (b) trend line of exports from Jordan to EU ... 63
Figure 4.8 (a) Exports from Lebanon to EU; (b) trend line of exports from Lebanon to EU ... 65
Figure 4.9 (a) Exports from Mauritania to EU; (b) trend line of exports from Mauritania to EU . 67 Figure 4.10 (a) Exports from Morocco to EU; (b) trend line of exports from Morocco to EU ... 69
Figure 4.11 (a) Exports from Syria to EU; (b) trend line of exports from Syria to EU ... 71
EMP Euro-Mediterranean Partnership
EMU European Monetary Union
ENPI European Neighbourhood Policy Instrument
EOCA Endogeneity of Optimum Currency Area
EU European Union
FEMIP Euro-Mediterranean Investment and Partnership Facility
FTA Free Trade Area
GDP Gross Domestic Product
IMF International Monetary Fund
LDC Least Developed Countries
MENA Middle East and North Africa
OCA Optimum Currency Area
PAFTA Pan-Arab Free Trade Area
RPLA Resource-Poor, Labour-Abundant
RRLA Resource-Rich, Labour-Abundant
RRLI Resource-Rich, Labour-Importing
TLPC Trend Line of Plot chart
LISTE OF APPENDICES
APPENDIX I: TREND LINE OF PLOT CHART (TLPC) FOR VARIABLE ‘ABSOLUTE VALUE OF DIFFERENCE OF GDP GROWTH’ OF ALL PAIRS ... 132 APPENDIX II: TREND LINE OF PLOT CHART (TLPC) FOR VARIABLE ‘ABSOLUTE VALUE OF DIFFERENCE OF INTEREST RATE’ OF ALL PAIRS ... 139 APPENDIX III: TREND LINE OF PLOT CHART (TLPC) FOR VARIABLE ‘ABSOLUTE VALUE OF DIFFERENCE OF INFLATION’ OF ALL PAIRS ... 146 APPENDIX IV: TREND LINE OF PLOT CHART (TLPC) FOR VARIABLE ‘ABSOLUTE VALUE OF DIFFERENCE OF BUDGET DEFICIT’ OF ALL PAIRS ... 154 APPENDIX V: TREND LINE OF PLOT CHART (TLPC) FOR VARIABLE ‘ABSOLUTE VALUE OF DIFFERENCE OF GOVERNMENT DEBT’ OF ALL PAIRS ... 160 APPENDIX VI: TREND LINE OF PLOT CHART (TLPC) FOR VARIABLE ‘ABSOLUTE VALUE OF DIFFERENCE OF GOVERNMENT EXPENDITURE’ OF ALL PAIRS ... 169 APPENDIX VII: TREND LINE OF PLOT CHART (TLPC) FOR VARIABLE ‘ABSOLUTE VALUE OF DIFFERENCE OF RESERVE POSITION’ OF ALL PAIRS ... 178 APPENDIX VIII: TREND LINE OF PLOT CHART (TLPC) FOR VARIABLE ‘MARKET SIZE’ OF ALL PAIRS ... 186 APPENDIX IX: TREND LINE OF PLOT CHART (TLPC) FOR VARIABLE ‘INCOME SIMILARITY’ OF ALL PAIRS ... 194 APPENDIX X: TREND LINE OF PLOT CHART (TLPC) FOR VARIABLE ‘ABSOLUTE VALUE OF DIFFERENCE OF FACTOR ENDOWMENT’ OF ALL PAIRS ... 203 APPENDIX XI: STATUS OF EXPORT FOR ALL PAIRS ORIGINATED FROM ALBANIA. LEFT PANELS: AMOUNT OF EXPORT, RIGHT PANELS: TLPC OF EXPORT. ... 212 APPENDIX XII: STATUS OF EXPORT FOR ALL PAIRS ORIGINATED FROM ALGERIA. LEFT PANELS: AMOUNT OF EXPORT, RIGHT PANELS: TLPC OF EXPORT. ... 214
LEFT PANELS: AMOUNT OF EXPORT, RIGHT PANELS: TLPC OF EXPORT. ... 227 APPENDIX XVII: STATUS OF EXPORT FOR ALL PAIRS ORIGINATED FROM LEBANON. LEFT PANELS: AMOUNT OF EXPORT, RIGHT PANELS: TLPC OF EXPORT. ... 230 APPENDIX XVIII: STATUS OF EXPORT FOR ALL PAIRS ORIGINATED FROM MAURITANIA. LEFT PANELS: AMOUNT OF EXPORT, RIGHT PANELS: TLPC OF EXPORT. ... 233 APPENDIX XIX: STATUS OF EXPORT FOR ALL PAIRS ORIGINATED FROM MOROCCO. LEFT PANELS: AMOUNT OF EXPORT, RIGHT PANELS: TLPC OF EXPORT. ... 235 APPENDIX XX: STATUS OF EXPORT FOR ALL PAIRS ORIGINATED FROM SYRIA. LEFT PANELS: AMOUNT OF EXPORT, RIGHT PANELS: TLPC OF EXPORT. ... 238 APPENDIX XXI: STATUS OF EXPORT FOR ALL PAIRS ORIGINATED FROM TUNISIA. LEFT PANELS: AMOUNT OF EXPORT, RIGHT PANELS: TLPC OF EXPORT. ... 241 APPENDIX XXII: STATUS OF EXPORT FOR ALL PAIRS ORIGINATED FROM TURKEY. LEFT PANELS: AMOUNT OF EXPORT, RIGHT PANELS: TLPC OF EXPORT. ... 244
CHAPITRE 1
INTRODUCTION
1.1 Importance of the Study
Nowadays, the forces of globalization (i.e. faster communication, more efficient transportation, increased flow of goods and services, labour mobility and more rapid financial flows) have two impacts. On the one hand, they have shaped the world’s economic environment and on the other hand, led to the increased importance of economic integration. In addition, it is widely accepted that the world is getting smaller and interconnecting and economic integration has led to the interaction and cooperation of companies and countries. Hence, a faster growth of corporations and countries after they integrated is not a big surprise. Recent studies have shown that the creation of an economic alliance or network is one of the most effective methods to face the new global economic opportunities and challenges (Ghadar 2006).
When it comes to evaluating the conditions of integrating countries, the academic literature relies essentially on one approach: the Optimum Currency Area (OCA) theory. The central question of whether a monetary union should be pursued is addressed by the OCA theory, which is a useful starting point for any discussion on regional integration (Nnanna 2009).
Robert Mundell in 1961 formulated the OCA theory and defined it in terms of an optimal geographic area, which adopts a single currency, or several currencies, whose exchange rates are permanently pegged. The notion of optimality relies on multiple conditions. These conditions include factor mobility of production, price and wage flexibility, economic openness, consumption and production diversification, similarity in inflation rates, political integration and fiscal integration (Mundell 1961). To refine the Optimum Currency Area (OCA) theory, the Endogeneity of Optimum Currency Area (EOCA) theory was pioneered by Frankel and Rose in 1998. They showed that reciprocal trade is improved significantly by monetary integration. The main focus in the context of the endogeneity of OCA theory is that the OCA criteria likely will be achieved by sharing a single currency ex-post even if they do not ex-ante (Frankel and Rose 1998).
The Mediterranean Union contains 43 countries, 27 member states of the European Union (EU) and 16 countries from the Middle East and North Africa (MENA region). The Union is considered as a new phase of the Euro-Mediterranean Partnership (also known as the Barcelona Process). Geographical proximity and economic growth in the Mediterranean countries play an important role in promoting integration. Hence, renewed growth in the Mediterranean countries will promote greater regional integration, both with the European countries and within Southern Mediterranean (Ülgen 2011).
Openness of the Middle East and North Africa (MENA) region to the global economy has been improved today more than in the early 1990s and the participation of the region to the global economy has been increased significantly. In this regard, tariffs have been reduced under the Pan-Arab Free Trade Area (PAFTA), intra-regional tourism is growing, and transport connectivity is improving. Still, the MENA region, compared to the other regions, is less globally and regionally integrated in terms of trade, investment and capital flows – with the exception of oil – to obtain the benefits of the current wave of globalization. In the Southern Mediterranean, The lack of an integrated market as well as the complicated set of rules of origin cause a shift of foreign investments to the North. A European investor can easily serve all the MENA markets while a MENA investor have difficulties due to the holes in the set of bilateral trade agreements among the MENA countries. Under these conditions, a fundamental rethink of the economic integration between the North and South of the Mediterranean should be considered (WorldBank 2010; Ülgen 2011).
1.3 Goal and Research Questions
The goal of this research is to analyse the level of integration among:
The Middle Eastern and Northern African countries, in relationship with the European Union.
The Middle Eastern and Northern African countries (MENA region). A selection of countries from the MENA region.
In fact, this study aims at answering the following questions:
What are the main criteria to determine the suitability of integration for the Mediterranean union?
The domain of the study for the Mediterranean union in this research is the European Union and 12 countries from the MENA region:
What are the main criteria to determine the suitability of integration for the MENA region?
The domain of the study for the MENA region is the 12 mentioned countries in the first question. What are the main criteria to determine the suitability of integration for the eight selected
countries from the MENA region?
Among the 12 countries from the MENA region in our sample, 8 countries are selected based on a procedure explained in chapter 5. The methodology adopted in this section has devoted a large part in the originality of this research, since it has been developed by the author. The methodology is developed based on classifying the tables investigated in the descriptive analysis in chapter 4. In section 5.5.1 the methodology is explained in detail.
1.4 Project Structure
This study is structured in six chapters, starting with the explanation of the interest of this study and its aims in Chapter 1. This is followed by identifying the importance of the investigated areas and research questions of the project. Chapter 2 presents a brief background on the two areas investigated in this study: the Mediterranean Union and the MENA region. Continuing with Chapter 3, the background of the study and its literature review, along with descriptions of the
CHAPITRE 2
BACKGROUND ON THE MEDITERRANEAN UNION
AND THE MENA REGION
2.1 Background on the Mediterranean Union
The Union for the Mediterranean (UfM) is considered as a multi-lateral partnership, which contains 43 countries from Europe and the Mediterranean Basin (Wikipedia 2012):
27 member states of the union are from the European Union, namely:
Austria, Belgium, Bulgaria, Cyprus, Czech Republic, Denmark, Estonia, Finland, France, Germany, Greece, Hungary, Ireland, Italy, Latvia, Lithuania, Luxembourg, Malta, Netherlands, Poland, Portugal, Romania, Slovakia, Slovenia, Spain, Sweden, and United Kingdom.
16 member states of the union are from North Africa, the Middle East and the Balkans, namely:
Albania, Algeria, Bosnia and Herzegovina, Croatia, Egypt, Israel, Jordan, Lebanon, Mauritania, Monaco, Montenegro, Morocco, the Palestinian Authority, Syria, Tunisia, and Turkey.
2.1.1 History of the Mediterranean Union
The Union for the Mediterranean is seen as an extension of the EU’s Euro-Mediterranean Partnership (EMP), which was launched in Barcelona (Spain) in 1995. According to the 1995 Barcelona Declaration, the aim of this initiative is “turning the Mediterranean basin into an area of dialogue, exchange and cooperation guaranteeing peace, stability and prosperity” (Xenakis and Chryssochoou 2001)
At the start of its formation, the Euro-Mediterranean Partnership included only 27 member countries, 15 of which from the European Union and 12 from the Mediterranean countries (i.e. Algeria, Cyprus, Egypt, Israel, Jordan, Lebanon, Malta, Morocco, the Palestinian Authority, Syria, Tunisia, and Turkey). In consequence of the European Union enlargement in 2004 and 2007, the number of EU member countries increased to 27, and two countries from the Mediterranean (i.e. Cyprus and Malta) became part of the European Union. Thus, due to the EU enlargement, the configuration of the Barcelona Process changed from "15+12" to "27+10".
“terrorism” is considered as a barrier to approve the final declaration. The Palestinian Authority, Syria and Algeria disagreed with the definition of the term “terrorism” if “resistance movements against foreign occupation” is part of the definition (European Commission 2005).
After the criticisms against the Euro-Mediterranean Summit in Barcelona in 2005, the efficiency of the Barcelona Process for fulfilling its objectives of peace, stability and prosperity felt into the suspicion (Fernandez and Youngs 2005). For instance, the disappointment about the Euro-Mediterranean Partnership and its inability to deliver some results is expressed by a Spanish politician, namely Josep Borrell (Fontelles 2010). However, the validity of the Barcelona Process' framework has been defended by many European Union diplomats.
After the Barcelona Process, the idea of a ‘Union of the Mediterranean’ was developed originally by President Sarkozy during the French presidential election campaign in 2007. The idea was advanced during a speech in Tangier on 23 October 2007, according to which just the coastal states of the Mediterranean would aim at a “political, economic and cultural union … of which our children will be proud”(Emerson 2008). The idea was presented with strategic and historical importance. However, he had aimed to model the Mediterranean Union on the European Union with a shared judicial area and common institutions. In addition, Mr. Sarkozy was thinking about Turkish membership of the Mediterranean Union as an alternative to membership of the European Union (Holm 2007). A number of criticisms came across the proposal at the highest levels.
1
Criticisms against the ‘Union of the Mediterranean’
First, due to the considering Turkish membership in the Mediterranean Union instead of in the European Union, the idea was rejected immediately by Turkey. Second, the European Commission agreed with the plans of promoting regional cooperation if they would be built based on the existing structures, specifically based on the Barcelona process. Third, on 5 December 2007, Chancellor Merkel rejected the idea of having only the participation of countries bordering the Mediterranean, she stated (Emerson 2008):
“This would create a situation I would qualify as dangerous. A situation could be created where Germany would be drawn to Central and Eastern Europe and France to the Mediterranean. This would create tension that I would not like.”
In addition, German chancellor Angela Merkel was worried about the risk of splitting and threatening the core of the EU by the creation of the Mediterranean Union based on Mr. Sarkozy’s assumption.
Fourth, at the time of Slovenian presidency of the EU in 2008, Prime Minister Janez Jansa added to the criticisms and indicated (Keller 2012):
"We do not need a duplication of institutions, or institutions that would compete with EU, institutions that would cover part of the EU and part of the neighbourhood."
However, among the EU member countries, the idea of the Mediterranean Union was supported by Italy, Spain, and Greece (DeutscheWelle 2007); while among the non EU members, the proposal was supported by Egypt and Israel (EJP 2007).
Modified Proposal of ‘Union of the Mediterranean’
Against the opposition from the EU member countries and the European Commission, Sarkozy modified his plan for the Mediterranean Union at the start of 2008. These modifications are (EuropeanUnion 2008; Vucheva 2008):
At the end of February of 2008, France's minister for the European affairs, Jean-Pierre Jouyet, declared that “there is no Mediterranean Union” but rather a “Union for the
accepted to participate to the project.
The proposition of creating common institutions was dropped as well.
The Union for the Mediterranean Is Launched
After several negotiations during a summit in Paris, the Union for the Mediterranean was launched on the 13th of July 2008 with the participation of 43 heads of state and government from the Euro-Mediterranean region. The Union is built upon the Barcelona Declaration and its objectives of achieving peace, stability and security. Also, it is considered a multilateral partnership with a vision to increase the potential for the regional integration. Heads of states emphasized the importance of co-ownership by all participants. They believed that the Euro-Mediterranean region will meet common challenges due to the important role of this initiative. One of those common challenges is economic and social development, with a view to promote dialogues among cultures. The Paris summit was considered a diplomatic success for Nicolas Sarzoky. Besides, it was agreed to held biennial summits by heads of state and government. The results of the summits should be a political announcement and a short list of tangible regional projects to be set in the process. Progress in the implementation of the summit conclusions would be reviewed by the annual foreign affairs ministerial meetings. Also determining the next summit meetings and approving the new projects, in the case of necessity, are considered in the biennial summits. It was agreed that the summit meetings should take place in the EU and in the Mediterranean partner countries alternately. The host country is selected by consensus. All countries party to the initiative will be called to the summits, ministerials and other plenary meetings of the Barcelona Process: Union for the Mediterranean (Declaration 2008).
2.1.2 Institutional Framework of the Mediterranean Union
Any political union requires not only a financial and political support but also an institutional support. Several institutions were launched to support a better functioning of the UfM and for a better coordination among the states.
To improve the political dialogue at the highest level, a summit of heads of state and government was planned to be held every two years. According to the Paris Declaration2 (Ilievska 2011): “Heads of State and Government agree to hold biennial summits. The summits should result in a political declaration and a short list of concrete regional projects to be set in motion. The Conclusions should endorse a broad two-year work programme for the Barcelona Process: Union for the Mediterranean. Annual Foreign Affairs Ministerial meetings will review progress in the implementation of the summit conclusions and prepare the next summit meetings and, if necessary, approve new projects.”
The foundation for the functioning of the UfM was built based on the biennial summit. In other words, the biennial summits seemed to be a place in which most of the problems are expected to be resolved.
The secretariat is another form of institutional support; two of its task is (Ilievska 2011):
Identifying and monitoring the implementation of the concrete projects for the Euro-Mediterranean region;
Searching for the partners to finance these projects3 .
2.1.3 Co-Presidency
In order to improve the stability and the joint ownership of the cooperation, heads of state and government set up a co-presidency; one from the EU while the other would be from the
2
Declaration, J. (2008). "Joint Declaration of the Paris Summit for the Mediterranean." URL: http://www. internationalepolitik. de/ip/archiv.
3
renewable period of two years.
Necessary consultations with all partners will be performed by the co-presidencies in order to adopt common conclusions of Summit, Ministerial, and other meetings.
2.1.4 Scope and Main Objectives
It was agreed by the heads of state and government that the challenge of the "Barcelona Process: Union for the Mediterranean" is (Declaration 2008):
Enhancing multilateral relations;
Increasing co-ownership of the process;
Setting governance on the basis of equal footing and translate it into the concrete projects; Progressing and economic benefits of the creation of a deep Free Trade Area and
strengthening of regional economic integration in the Euromed region by 2010 and beyond;
Supporting the main lines of the Euromed Trade Roadmap till 2010 and beyond;
Studying the establishment of a smooth, efficient and business-friendly trade facilitation mechanism which would bring further transparency and trade and investment
opportunities;
Implementing the projects in order to enhance the flow of exchanges among the people of the whole region and thus creating a future of peace and shared prosperity in the entire region. In this regard, the human and cultural dimension of the initiative was pointed out;
4
Improving the political level of the EU's relationship with its Mediterranean partners; Providing more co-ownership to the multilateral relations; and
Making these relations more tangible and visible through the additional regional and sub-regional projects.
The main fields, which the UfM had in mind are (Process 1996):
Political and security basket: by defining a common area of peace and stability via reinforcement of political and security dialogue.
Economics and trade basket: by creating a zone of shared prosperity via an economic and financial partnership and the gradual configuration of a free-trade area.
Socio-cultural basket: by creating social, cultural and human partnership and rapprochement between peoples to encourage understandings among the cultures and exchanges among civil societies.
2.1.5 Six Concrete Projects of the UfM
As an addition to these chapters about cooperation, six concrete projects of the UfM were identified, which consider specific needs of the Euro-Mediterranean regions, such as (Declaration 2008; Ilievska 2011):
De-pollution of the Mediterranean. This broad project includes many plans such as good environmental governance, access to drinkable water, water management, pollution reduction, and protection of the Mediterranean biodiversity.
Maritime and land highways. Improving the circulation of commodities and people throughout the Euro-Mediterranean region is the intention of this project by improving ports, and building highways and railways.
Civil protection. The ultimate goal of this project is to bring the Mediterranean Partner Countries progressively closer to the European civil protection mechanism.
Alternative energies: Mediterranean solar plan. Promoting the production and use of renewable energies is the goal of this project
Higher education and research: Euro-Mediterranean University. As confirmed by the 43 heads of state and government, the goal of this project is to promote higher
have to be developed by contributions for the Union for the Mediterranean. Resources are (Declaration 2008):
The private sector participation;
Contributions from the EU budget and all partners; Contributions from other countries;
International financial institutions and regional entities;
The Euro-Mediterranean Investment and Partnership Facility (FEMIP); The European Neighborhood Policy Instrument (ENPI).
Contributions from the European Commission to the Union for the Mediterranean are performed through the European Neighborhood Policy Instrument (ENPI). In July 2009, €72 million were allocated by the ENPI for the following Union for the Mediterranean projects during 2009–2010 (Lindh 2010):
De-pollution of the Mediterranean (€22 million); Maritime and land highways (€7.5 million);
Alternative energies: Mediterranean Solar Plan (€5 million); Euro-Mediterranean University of Slovenia (€1 million).
Contributions from the European Investment Bank to the Union for the Mediterranean are performed through its Euro-Mediterranean Investment and Partnership (FEMIP). Specifically, the Euro-Mediterranean Ministers of Finance on 2008 mandated the FEMIP to support three of the six concrete projects (Lindh 2010):
de-pollution of the Mediterranean; alternative energies;
Maritime and land highways.
$750 million have been allocated by the World Bank for the renewable energy project through the Clean Technology Fund.
2.2 Background on the MENA Region
The Middle East and North Africa (MENA) is an economically diverse region consisting of 20 countries ranging from the Least Developed Countries (LDCs) to the high-income countries. This region has a population of 355 million, with 85 percent living in the middle-income countries, 8 percent in the high-income countries and 7 percent in the low-income countries (Saade 2012).
2.2.1 Economic Performance of MENA Region
During the last few years, a strong economic performance has been shown by the MENA region. A large share of this performance is derived by high oil prices and reform policies, which are generally on a positive track. The region’s growth performance was one of its best since the 1970s. In 2007 and 2008, GDP at market prices grew at 5.8%, up from an average of 3.7% in the years of 1999-2000. However, due to the high population growth rates, growth of per capita income remains lower. Although the recent global financial and economic crisis in the MENA region has been weathered relatively well, it still faces daunting medium-term challenges. One of these challenges is high unemployment especially among the young people. The labour markets across the region have not improved much over the same period. In 2005 the unemployment rate in the MENA amounted to 12% on average, but varies significantly between the countries. Estimates of unemployment are very high and labour migration within and outside the region is a very frequent phenomenon. Therefore, the job creation remains a priority in the MENA region. Other challenges for the MENA are vulnerability to the oil and food price shocks and water scarcity and inefficiencies of the public sectors. Indeed, the MENA region is highly dependent on the oil and oil products. Up to 80% of merchandise exports belong to this group of products
Resource-Rich, Labour-Abundant (RRLA: Algeria, Iran, Iraq, Syria, and Yemen); and Resource-Rich, Labour-Importing (RRLI: Bahrain, Kuwait, Libya, Oman, Qatar, Saudi
Arabia, and United Arab Emirates).
Many of the labour-abundant countries rely on the export of labour. For countries such as Egypt, Jordan, Syria and Yemen, one of the most important sources of the foreign exchange is labour remittances. The region’s integration in terms of labour mobility is quite high in contrast to trade in goods and investment. Regarding export markets for merchandise trade, the EU is a key destination for several North African countries, especially Tunisia, Morocco, and Algeria. In contrast, for the Middle Eastern countries, the other MENA economies are major export markets. Table 2.1 shows two main partners (in terms of share of total export) of selected countries from the MENA region.
Table 2.1 Major trade partners of selected MENA countries (share of total exports in %) Data source: IMF DOTS 2006-retrieved from (GTZ 2009)
Algeria Egypt Jordan Morocco Syria Tunisia
EU 27 53,9 38,2 3,6 71,9 32,2 78,1
CHAPITRE 3
LITERATURE REVIEW
3.1 A History of the Optimum Currency Area Theory
An optimum currency area (OCA) is defined in terms of an optimal geographic area, which adopts a single or several currencies whose exchange rates are permanently pegged (IJssennagger and Ligthart). The notion of optimality relies on several conditions. These conditions include factor mobility of production (labour and capital), price and wage flexibility, economic openness, consumption and production diversification, similarity in inflation rates, political integration, and fiscal integration. Results of sharing the above conditions might be internally and externally balanced while reducing the impact of some types of shocks. Therefore, the usefulness of the nominal exchange rate as a mechanism of adjustments is reduced (Mongelli and Europeo 2002). In the context of the OCA theory, the terms “optimal” and “optimum” are interpreted in different
ways. McKinnon (1963) refers the term of optimum to a currency area where three objectives are satisfied; two objectives of the internal equilibrium, which are full employment and a stable price level, and an objective of the external equilibrium, which is a balanced external account. In the sense of Grubel (1970) “optimal” is used to describe “the union between a number of regions or countries, which improves welfare of the population within these territories above the level enjoyed when each was a separate currency area.” Kenen, Dornbusch et al. (1980) believe that “optimal” in the OCA theory comes into the view when the costs of the balance-of-payments adjustment are minimized.
The theory of optimum currency area determines the required conditions to be satisfied by countries in order to make a monetary union attractive. In fact, the conditions ensure that the benefits of the monetary union exceed its costs (Kenny 2003).
Mundell (1961), McKinnon (1963) and Kenen (1969) are the main contributors to the OCA theory who have concentrated on the cost side of the cost-benefit analysis of a monetary union. Each argumentation by these three economists is discussed in details.
3.1.1 Mundell Argumentation
Robert Mundell was the first one to formulate the theory of Optimum Currency Areas (OCA). According to him, optimum currency areas are identified by economic regions, i.e. regions with
single currency or a fixed exchange rate regime are greater than the costs of abandoning the exchange rate as an internal mechanism of adjustment (i.e. within the area). Countries with highly integrated relationships in terms of trade and other economic relations are more likely to form an optimum currency area (Frankel 1999).
The main focus is on the costs of a monetary union. These costs refer the loss of a country’s ability to use the exchange rate as an instrument to deal with shocks in demand and supply. In fact, in a monetary union, there is a central bank which monitors and controls partner countries in the union and makes a central decision about a certain condition for all partners (Horvath and Komárek 2002).
Mundell (1961) believes in the ability of factor mobility, especially labour mobility, to remove or at least reduce these costs. He also highlights the significant role of the price and wage flexibility as the instruments to deal with idiosyncratic demand shocks. Hence, there is no more need for changes in the exchange rate in an economy (region) with labour mobility or price and wage flexibility.
Shift in Demand and Ability of Labour Mobility and Wage Flexibility
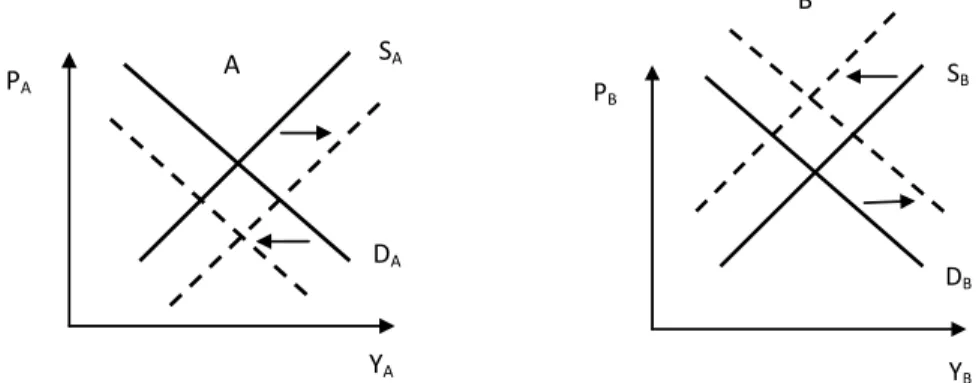
Mundell (1961) developed the case of a demand shift in his famous article on the optimum currency areas. Imagine there is a shift away in aggregate demand from A-made to B-made products, e.g. due to a change in the preferences of consumers. As illustrated in Figure 3.1, this situation is presented by an upward movement in demand curve in B and a downward movement in A. In fact, as aggregate demand in A reduces, both output and price decreases in A. Also, by rising aggregate demand in B both output and price increases. Effects of these asymmetric shocks are unemployment in A and inflation in B. However, there are some mechanisms pushing back to
the initial equilibrium. Wage flexibility and mobility of labour are two adjustment instruments when countries A and B are trading from a monetary union. Following is the explanation for each mechanism (Kenny 2003).
Figure 3.1 Shift in aggregate demand in A and B-retrieved from (Kenny 2003) .
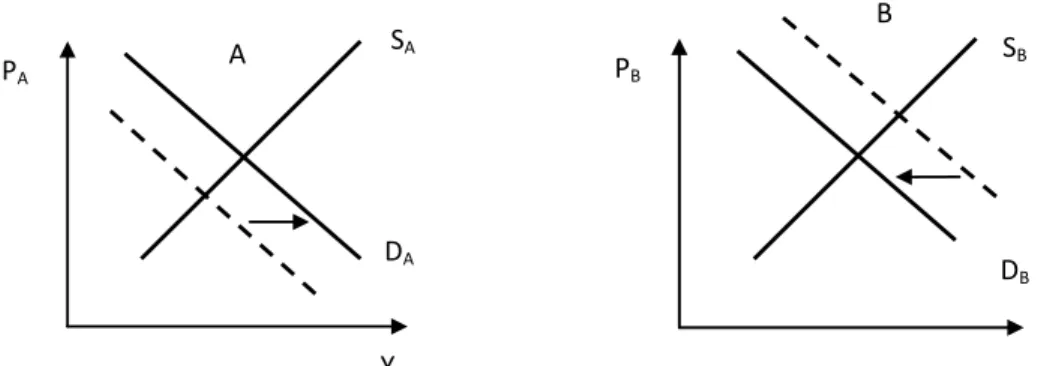
a. Wage flexibility. With wage flexibility in A and B, the following results are observed. Once unemployment occurred in A, workers decrease their wage claims. As a result, the supply curve moves downward in A. In addition, the wage rate is pushed up in B because of the excess demand for labour and consequently moving upward the supply curve in B. As illustrated in Figure 3.2, the equilibrium will be brought back by these shifts. In fact, products of country A are going to be more competitive because their price fall and so there will be a boost in demand for them. For B, the opposite would occur. Figure 3.2 shows this adjustment.
Figure 3.2 Adjustment mechanism by wage flexibility retrieved from (De Grauwe 2007)
b. Mobility of labour. With the possibility of labour mobility, excess demand for labour in B will be vanished by moving A’s unemployed labour to country B. This movement
A YA PA SA DA SB DB PB YB B YA PA SA DA A SB DB PB YB B
need for movements of factor from A to B if country A could make B-type products. However, if country A cannot develop B-type products, movements of factor from A to B prevent a fall of income in country A as a mechanism of adjustment. Nevertheless, McKinnon like Mundell believes that regions in which there is factor mobility should form a common currency area. However, some authors such as Kenen (1969), Grubel (1970) and (Giersch 1973) have some criticisms to Mundell’s argumentation. For instance, Kenen (1969) expresses that there should be perfect homogeneity of labours to have perfect interregional labour mobility. Grubel (1970) states that there is no certain declaration of levels of labour mobility in the context of regions in Mundell’s definition of region. Giersch (1973) believes that mobility is high in the long run and is a function of time; therefore the world should be an optimum currency area in the long run (Horvath 2003).
3.1.2 McKinnon Argumentations
McKinnon (1963) is the second who contributed to the theory of optimum currency area. In McKinnon’s view, the degree of openness is the main criterion to constitute an OCA; and defines it as the ratio of tradable to non-tradable goods. A fixed exchange rate is more advantageous for an open economy and there are more arguments for having a flexible exchange rate when economy is rather closed (Broz 2005). The following explanation shows that flexible exchange rates cannot be served as a mechanism of adjustment in an open economy.
Assume a small economy5 with a high ratio of tradable to non-tradable goods. Tradable include exportable, X1, and importable, X2, and non-tradable are defined as X3. Price of exportable, P1, and importable, P2, in domestic currency varies under a flexible exchange rate regime. So the fluctuations in exchange rate prevent a stable price level. McKinnon (1963) writes:
“...if we move across the spectrum from closed to open economies, flexible exchange rates become both less effective as a control device for external balance and more damaging to internal price level stability.”
However, a large economy will be less affected by the fluctuations in the exchange rate. The logic is that only a small part of GDP in a large economy is engaged in the foreign trade (McKinnon 1963).
Giersch (1973) and Ishiyama (1975) criticized the McKinnon’s view. Ishiyama (1975) believes that McKinnon’s argumentation comes true if outside world price level is stable. However, stability of the outside world price level does not prevail in the real world. He says McKinnon’s argumentation could be reversed because domestic economy in which there is fixed exchange rate regime would be directly affected by the external instability.
Giersch (1973) expresses that flexible exchange rate is more advantageous for open economies since it may be more affected by cyclical disturbances from outside world.
3.1.3 Kenen Argumentations
Kenen (1969) is the third important contributor to the OCA theory. Product diversification is introduced as an important criterion in forming an optimum currency area by Kenen.
Kenen (1969) explains the application of diversification by an example. Assume a negative demand shock is exposed to a country, which is not diversified and only produces one product. The exports revenue of the single product of this country will fall since it is affected by the negative demand shock. React to this shock is different under the type of exchange rate regime. If
5
The likelihood of openness in a small economy is higher than in a large economy. For a small economy it is more efficient to produces only those goods in which it has competitive advantage. Also it is more efficient to engage in foreign trade to export produced goods and import other goods which it does not produce.
economy, on the one hand, and on the other hand, benefits from a single currency exceeds this cost.
Kenen (1969) introduces another important criterion in forming an optimum currency area, which is fiscal integration. The impact of asymmetric shocks between the two regions can be smoothed through the fiscal transfers from a low-unemployment region to a high-unemployment region.
3.2 The Costs of a Common Currency
The main cost of a monetary union is related to losing the power of national monetary policy. When a country joins a common currency, firstly, it has to stop using its national currency and secondly, its national central bank has no real power to conduct a national monetary policy. The later means that once a country enters a monetary union, it has no authority anymore to change its short term interest rate or price of its currency.8 The advantage is the usefulness and effectiveness of these independent national policies, which are vanished by joining a monetary union. In fact, there are many situations in which these policies are the only choice to bring back the equilibrium which has been gone by some negative shocks. For instance, the helpfulness of the flexible exchange rate as an independent national policy, derive from the fact that countries are different
6
By depreciation of the exchange rate, now exporter gets more domestic currency for every unit of foreign currency and consequently export revenues improves.
7
However, there should be occupational mobility between industries within region.
8
When the country is not able to change the price of its currency, it is meant here that the country cannot devalue or revalue its currency.
in some significant senses in which this policy can do the best (Horvath and Komárek 2002). The three subsequent sections describe some of these differences in details in which applying the flexible exchange rate is necessary.
3.2.1 Shifts in Demand
There are two scenarios that have to be considered. The first one is about trade between two countries named A and B from a monetary union so using a common currency. And the second one is about trade between these two countries with their national currency.
Firstly, in the example of countries A and B once they are facing with demand and supply shock, labour mobility and wage flexibility are two mechanisms of adjustment. Therefore, the adjustment problem will vanish if these two mechanisms prevail between countries A and B in a monetary union. But what will happen if labour mobility and wage flexibility are not sufficiently high between countries A and B, which are two members of a monetary union? In this situation, in order to adjust to the disequilibrium, inflationary pressure is exposed to country B, which is in fact, the cost of joining a monetary union. On the one hand, there is no reduction of wages in A and also unemployment workers do not move from country A to country B. On the other hand, there is excessive demand for labour in B, which pushes the supply curve upward. This is because workers demand an increase in their wage rate. Thus, in B, prices increase and it in turn makes A’s product more competitive. By that, demand for A’s product increases and consequently aggregate demand curve in A shifts upward. As a result of labour immobility and wages inflexibility, adjustment to the disequilibrium took the form of inflation in B.
Secondly, there are some other adjustment mechanisms to deal with asymmetric shocks when two countries are not joining a common currency. This scenario explains the effectiveness of the national monetary policy. Considering the example of country A and B in which each country has its own national currency, the problem of asymmetric shocks will be solved by two mechanisms of adjustment derived from the national monetary policy. The first is related to the flexible exchange rate by which countries can manipulate their domestic interest rate. In this example, country A can lower its interest rate and so encouraging aggregate demand and country B can do the inverse. These mechanisms, which are applied by countries A and B, probably lead to depreciation of country A’s currency and appreciation of country B’s currency. By this method, A-made products will be sold in country B cheaper.
Figure 3.3 Effects of a devaluation of country A's currency, retrieved from (De Grauwe 2007).
Therefore, if there is not sufficient level of wage flexibility and labour mobility between countries in a monetary union, coming back to the equilibrium will be more costly than when the countries use their national monetary policy (De Grauwe 2007).
3.2.2 Different Preferences of Countries about Inflation and Unemployment
Countries in a monetary union are sensitive to inflation by different levels. This might make the common currency costly. Considering different preferences of two countries about inflation and unemployment in a monetary union, two countries may choose two different points on their Phillips curve. Hence, inflation will be different in the two countries and as a result, a fixed exchange rate will not be sustainable. The cost of a monetary union increases here, which derives from the fact that these two countries have to choose another point on their Phillips curve if they want to keep exchange rate fixed. In other words, they have to choose a less preferred point on their Phillips curve to keep inflation rate in an equal level. In this procedure, one country has to accept more inflation and less unemployment and the other country has to accept less inflation and more unemployment. None of these conditions are in their interest while they have to accept them and also accept costs derived from them so as to keep their exchange rate fixed (Ruprah and Luengas 2011).YA
DA D
3.2.3 Differences in Labour Market Institution
The degree of centralization of labour market institutions in different countries is not similar. In some countries, there is a high degree of centralization and others are less centralized. Under these differences, Wage and price reactions will be affected. It in turn may lead to a costly monetary union. If wage bargaining is strongly centralized, there is no incentive for unions to increase the wage of their members when they face supply shock. In countries in which labour unions are less centralized the approach is quite different. In these countries, each union has a tendency to increase the wage of its members since the union knows that all other unions do so even if it does not so. Thus, if individual union does not claim for wage increasing, the real wage of its members would decline. As a result, there will be different inflation rates when a monetary union is composed of countries with different degrees of centralization of labour market institution. This leads to have a costly monetary union (Grabner 2003).
3.2.4 Differences in Growth Rate
Some countries experience higher growth rate than other countries. Different growth rate in countries from a monetary union leads to a costly problem. It is explained by the example of country A and country B. Suppose that the GDP growth rate for country A is 5% and is 3% for country B. Also, assume country A imports from country B at income elasticity equal one and income elasticity of country B’s import from A is one. In this situation, country A, which grows faster in terms of GDP, will have a balanced problem. This problem is resulted from the fact that country A’s import grows faster than its export. To deal with this deficit, county A will have to reduce the price of its goods which is exported to B to make them more competitive and thus to able to sell them to country B. Hence, a monetary union can be costly for the fast growing countries (De Grauwe 2007).
3.2.5 The Cost of Monetary Union and the Degree of Openness
The effect of the degree of openness on the cost of a monetary union is analysed via the effectiveness of the exchange rate when asymmetric shocks appear. This analysis is performed by comparing two independent economies, one relatively open and the other one relatively closed. The relatively open economy is affected stronger than the relatively closed economy by the same depreciation since the exports of the open economy is higher than the exports of the closed
(relatively) closed economy (Benigno and Benigno 2003; Grabner 2003).
Figure 3.4 Relation between the cost of a monetary union and the openness of a country – retrieved from (De Grauwe 2007)
When the degree of openness of a country increases, the cost of a monetary union decreases. This relation is shown in Figure 3.4.
3.3 The Benefits of a Common Currency
Economic efficiency can be a result of joining a common currency since the national currencies are removed. Indeed, a multitude of national currencies are merged into a single one. Therefore, due to the reduction in transaction costs, efficiency gains will be improved (Grabner 2003).
9
3.3.1 Direct and Indirect Gains from the Elimination of Transactional Cost
One of the most obvious and direct gains from joining a common currency is the elimination of transaction costs. Two different forms of transaction costs are such as fixed commission or spread between the buying and the selling prices of any given currencies. Elimination of transaction cost has also an indirect gain: price transparency. On the one hand, a simple platform for price comparison is created by price transparency and on the other hand, price transparency causes an increase in competition, so that the consumer will benefit from the same lower prices (Monnet).3.3.2 Welfare Gains from Less Uncertainty
Uncertainty about future revenues of the firms in a fixed exchange rate regime is less than in a flexible exchange rate regime. In other words, one of the main reasons of uncertainty about future revenues of a firm is uncertainty about exchange rate. In addition, the world population is composed of risk-averse individual who prefer a certain level of future revenue. Put another way, just, if they are promised that the more risky return will be higher than the less risky return, then they accept that (De Grauwe 2007).
3.3.3 Benefits of an International Currency
Using a common currency in a monetary union has three sources of benefits. The first source of benefits deals with the additional benefits of an international currency. In fact, the issuer of a currency obtains additional benefits when the currency in question is used internationally. The second source of benefits derives from the fact that foreign central banks hold an international currency as an international reserve. However this kind of reserve is held as treasury securities and not in the form of cash. By the third benefit, it is concluded that activities by domestic financial markets are improved when they work under an international currency. This is because of interests of foreign residents to invest in asset and issue debt in that international currency. Therefore, bond and equity markets and also businesses are attracted by domestic banks and consequently some new jobs are performed (Grabner 2003).
currency to foreign currencies they will lose a proportion of their benefits of their trade. Eliminating these risks in small and open countries causes a larger welfare gains in compare to the large and relatively closed countries. The relationship between the benefits of a monetary union and the openness of the countries is represented in Figure 3.5. By this relationship, welfare gains from a monetary union increases when openness toward the other partners in the union increases (De Grauwe 2007).
Figure 3.5 Relation between degree of openness (trade) and benefits of a monetary union – retrieved from (De Grauwe 2007)
3.4 Comparison of Costs and Benefits of a Monetary Union
Benefits and costs related to the openness of a country were analysed separately in previous sections. The combination of these relations is analysed in Figure 3.6.
Figure 3.6 Costs and benefits analysis of a monetary union – retrieved from (De Grauwe 2007)
Figure 3.6 illustrates that the critical level of openness is determined by the intersection point of the benefit and cost lines. In fact, this point guides countries whether join a monetary union or not. To the left of this point the costs of a monetary union are more than the benefits of a monetary union. Hence, in this side, it is better to use the national monetary policy. To the right of this point the benefits of a monetary union are more than the costs of a monetary union. Therefore, in this area, joining a monetary union could be a better choice than keeping the national monetary policy like exchange rate policies. Figure 3.6 shows a general form of a cost-benefit analysis of a monetary union (De Grauwe 2007).
3.5 The Endogenous Optimum Currency Areas Theory
The theory of endogeneity of Optimum Currency Areas was pioneered by Frankel and Rose (1998). They showed that reciprocal trade is improved significantly by monetary integration. Between the members of a potential OCA, four inter relationships are studied by much of literatures in the subject of optimum currency area theory (Frankel and Rose 1998):
OCA criteria are endogenous. Frankel and Rose (1998) argue on the first two criteria although they do not deny the importance of the third and fourth criteria.
The nature of national business cycles might be affected by tighter international trade ties. Warin, Wunnava et al. (2008) stated that ‘waiting for two economies to be in phase before adopting the same currency is only one part of the path towards an OCA since using a common currency will also force the economies to become an OCA’. Frankel and Rose (1998) mentioned that ‘a naive examination of historical data gives a misleading picture of a country’s suitability for entry to a currency union, since the OCA criteria are endogenous’. In fact, a monetary union itself may contribute to an additional enhance to trade integration and consequently business cycle synchronisation.
There are two different interpretations about the effect of closer international trade on correlations of national business cycles. The first interpretation, known as ‘pro-synchronisation’ hypothesis, claims that the deeper the monetary integration process, the more co-movement (correlation) in the national business cycles. This co-movement of national business cycles is strengthened especially in the case of intra-industry trade. According to the second interpretation, co-movement between the outputs of countries in a monetary union decrease with monetary integration. This interpretation is called ‘anti synchronisation’. This hypothesis suggests that specialization can be expected to happen when inter-industry trade prevail. By ‘pro-synchronisation’ hypothesis, it is concluded that a positive correlation between members’ output is fostered by integration. This in turn leads to more synchronisation of business cycles. The
10
reasons for this claim are based on the four microeconomic conditions which are necessary to form an OCA (Akiba and Iida 2009):
1) Decline of transaction cost
Chaplygin, Hallett et al. (2006) state that “a necessary and sufficient condition for low costs is both a high positive correlation between the shocks..., and shocks of similar size.” 2) Allocation of scarce resources will be more efficient
3) Creating more opportunities in financial market integration and hence a boost in capital mobility.
4) Real exchange rate volatility is decreased in the result of more flexibility in wage and prices.
All of these four argumentations can be expected to contribute to improve trade and more integration and symmetry of outputs. Pursuant to ‘pro-synchronisation’ hypothesis, member countries may satisfy the OCA properties ex post, even though they may fail to satisfy them ex ante. This hypothesis is called ‘endogeneity of OCA hypotheses’ by Mongelli and Europeo (2002).
The latter hypothesis, ‘anti synchronisation’, was discussed by Krugman (1993). He claims that reciprocal volume of trade between countries increases as a result of more integration. Therefore, a necessary condition, openness, for forming an OCA is satisfied. Exporting countries will be specialised in production for which they have a comparative advantage due to the raise in openness. Specialization, in turn undermines ‘diversification’, the necessary condition for the OCA. Hence, in Krugman’s words, countries in a monetary union will be more exposed to asymmetric shocks for the reason that the correlation coefficient of output has a tendency to fall. Mongelli and Europeo (2002) called this hypothesis the ‘Krugman specialization hypothesis’. The high correlation coefficients between outputs of countries are important since within a monetary union, independent monetary policy, which is applied to deal with asymmetric shocks, must be removed. The cost, which is resulted from abandoning independent monetary policy, is lowered if output co-move among the member countries. By co-movement of output it is meant here that the correlation coefficient is high (Akiba and Iida 2009).
Frankel and Rose (1998) believe the ‘pro-synchronisation’ hypothesis to be the more realistic one. They wrote: ‘only countries whose business cycles are imperfectly synchronised with
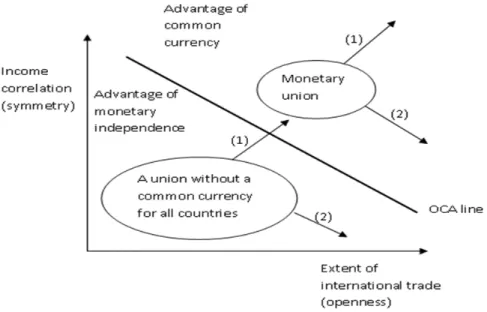
Figure 3.7 Income correlation, integration and OCA line-retrieved from (Frankel and Rose 1998)
The OCA line indicates that sharing a single currency is beneficial for countries which share a high level of either openness or income correlation among them (Frankel and Rose 1998).
The OCA line in this representation is downward-sloping. De Grauwe, Mongelli et al. (2005) mentioned the reason for the shape of OCA line. On the one hand, the costs of a monetary union are increased if symmetry is decreased. This is because losing of national monetary policy instrument is more costly while the degree of asymmetry increases. On the other hand, as the degree of integration increases member countries benefit more from the monetary union, i.e. benefits from efficiency gains. Therefore, integration can be considered as a source of benefits of a monetary union. As a result, the costs originated from more asymmetry can be compensated by the benefits generated from more integration. Frankel and Rose (1998) explained the reason for