HAL Id: hal-01757392
https://hal.archives-ouvertes.fr/hal-01757392
Submitted on 12 Apr 2018
HAL is a multi-disciplinary open access
archive for the deposit and dissemination of
sci-entific research documents, whether they are
pub-lished or not. The documents may come from
teaching and research institutions in France or
abroad, or from public or private research centers.
L’archive ouverte pluridisciplinaire HAL, est
destinée au dépôt et à la diffusion de documents
scientifiques de niveau recherche, publiés ou non,
émanant des établissements d’enseignement et de
recherche français ou étrangers, des laboratoires
publics ou privés.
Characterization of melted cocoa butter saturated with
supercritical CO2
Brice Calvignac, Élisabeth Rodier, Jean-jacques Letourneau, Jacques Fages
To cite this version:
Brice Calvignac, Élisabeth Rodier, Jean-jacques Letourneau, Jacques Fages. Characterization of
melted cocoa butter saturated with supercritical CO2. GPE -2nd International congress on Green
Process Engineering, Jun 2009, Venice, Italy. 6 p. �hal-01757392�
GPE-EPIC
2nd International Congress on Green Process Engineering 2nd European Process Intensification Conference 14-17 June 2009 - Venice (Italy)
CHARACTERIZATION OF MELTED COCOA BUTTER SATURATED
WITH SUPERCRITICAL CO2
B. CALVIGNAC, E. RODIER, J-J. LETOURNEAU, J. FAGES
♦ Université de Toulouse, centre RAPSODEE FRE-CNRS 3213, Ecole des Mines d’Albi-Carmaux
81013 Albi, FRANCE
e-mail : [email protected]
Abstract. In this study, the measurements of density, solubility and volume expansion were carried out at 313 and
353 K and pressures of 5 to 25 MPa. The cocoa butter (CB) used in this work is manufactured by Gerkens Cacao. The experimental procedures were validated with the SC-CO2/butan-1-ol mixture, for which literature data are
available. In a first time, we focused on the density measurements, using the vibrating tube principle and on the solubility measurements of the SC-CO2 in CB using a gravimetric procedure. We compared and discussed the
results with literature data for instance with those of Venter et al [1]. who performed density and solubility measurements using two different methods (gravimetric and static analytic methods). Phase composition and density measurements were carried out with a good reproducibility and repeatability. Moreover, the experimental density values were correlated with Tait and modified Tait equations and a model specially developed in this study. These models permitted to fit the experimental densities of pure CB and SC-CO2/saturated CB mixture in a
wide range of pressures and temperatures.
Key-words. Cocoa butter, supercritical CO2, density, solubility, modelling, high pressure
1. INTRODUCTION
Supercritical fluid processes are emerging technologies as clean and efficient alternative to conventional methods in several fields such as extraction, crystallization, chromatography, material processing [2]. The supercritical carbon dioxide is commonly used and became the solvent of choice for food processing and pharmaceutical industries, because of its non toxicity and its moderate critical properties (critical pressure: 7.38 MPa, critical temperature: 304.35 K). In addition, the knowledge of vapour-liquid equilibrium (VLE) and volumetric properties as densities and viscosities of binary mixtures over an extended range of temperature and pressure are necessary for process design. Cocoa butter (CB) is used in the manufacturing of chocolate and may have other potential applications. It is a complex natural compound composed of different types of triglycerides (TG), which proportions vary according to the origin of the CB. This study is a preliminary work of a global project aiming at a new clean recrystallization / fractionation process of cocoa butter (CB) assisted by SC-CO2. This process would be
adapted to particle generation, which mean size, size distribution, polymorphism and lipid composition could be controlled. The fractionation of CB has not yet been fully explored but Bhaskar et al. [3] were the first to show that it was feasible. They used the difference of solubility in SC-CO2 of the three most
triglycerides contained in CB. This work as any other process design requires the knowledge of properties of the SC-CO2 /CB system such as reciprocal solubility of the binary system, density and viscosity of
phases. They are necessary to go further in the understanding of the phenomena implied in the processing of lipids. Yet, there is a lack of such thermophysical properties in the literature. In this work, we describe a new VLE measurements apparatus (static analytical method), equipped with U-tube densimeter for saturated densities measurements and a high precision balance for the gravimetric determination of phase compositions and its volume expansions. This study has been limited to the liquid phase composed of molten CB saturated in SC-CO2.
2. MATERIALS AND METHODS 2.1. Materials
Cocoa butter was obtained from Gerkens Cacao (Wormer, The Netherlands) and was already used by Venter et al. Carbon dioxide (purity 99.995 %) was purchased from Air liquide S.A. (Paris, France). Butan-1-ol was purchased from Sigma-Aldrich. Pure water was obtained by ELGA purification system.
2.2. VLE Apparatus and procedure
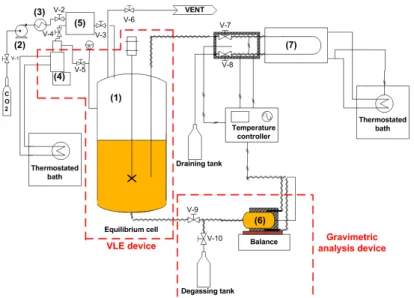
A schematic diagram of the static analytical device for VLE and density measurements is shown in Fig. 1. The apparatus has been designed to carry out investigations under high pressure and high temperature, respectively up to 35 MPa and 473.15 K. The stainless steel autoclave (1), which capacity is 500 mL (Xenard, France), was previously loaded with 250 mL of melted cocoa butter and heated to the desired temperature. Liquid CO2 was pumped by a high pressure membrane pump (Lewa, France) (2) and
preheated by a heat exchanger (Separex, France) (3) before feeding the autoclave equipped with a stirring mechanical device (Top-industrie, France). Then, a syringe pump (Model ISCO 260D) (4) previously filled with CO2 (260mL) and operating in the same pressure and temperature conditions than the
autoclave, was used to maintain the equilibrium of the studied mixture. The pressure and temperature set-up of the VLE apparatus (autoclave and syringe pump) were kept constant respectively within ±0.01MPa and ±0.1K. Note the presence of a buffer storage tank (5) connected to the CO2 feed pipe, to the
equilibrium autoclave and to the syringe pump. Once the equilibrium was reached, pressure in the tank was increased of 5MPa above the equilibrium pressure in order to ensure a pressure drop compensation when valve V-9 was opened to make gravimetric analysis.
Fig. 1 Schematic diagram of the VLE apparatus
Then, the compensation operation was achieved by the membrane pump. The CO2 flow compensation is
fixed to 2 kg.h-1 in order to minimize the pressure drop (ΔP
max=0.5MPa) manually controlled by V-7. Cell
temperature was kept constant by means of PID controller within ±0.1K. This stainless steel measurement cell (Top-industrie, France) (6) was previously weighted empty and placed on a high precision balance (Sartorius Model LA3200B), was used to sample 50 mL of the liquid phase. This balance allows gravimetric analysis within ±0.01 g. Moreover, density measurements were carried out in the same time with accuracy of ±0.01 kg.m-3. Thus, valve V-7 is opened to refill the vibrating U-tube densimeter (Model
Anton-Paar DMA-HPM) (7). Temperature in the vibrating U-tube is precisely controlled by a thermostated bath within ±0.01 K and pressure is measured by a transducer (Model Druck PTX 611) with accuracy of ±0.001 MPa. Volume within the loop remaining small, equilibrium is hardly perturbed and reached quickly. It is important to note that all pipes of the apparatus were precisely thermally controlled within ±0.1K. At last, when all parameters (pressure, temperature, mass) are stable, they were recorded and valve V-9 is closed to isolate the cell. The valve V-10 was then opened and the mixture is slowly degassed in order to recover cocoa butter and consequently to deduce the solubility of SC-CO2 in the
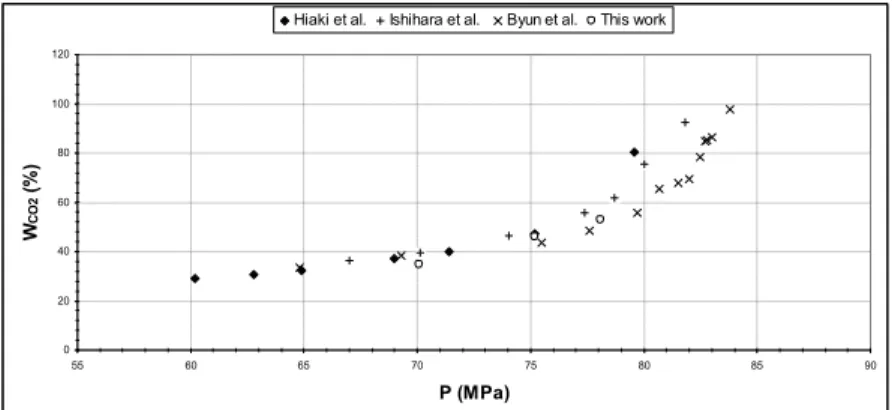
2.3. Validation of experimental procedure
The experimental procedure was validated comparing the results obtained from similar studies of the SC/CO2-butan-1-ol system at 313.13 K [4-6] (Fig. 2).
0 20 40 60 80 100 120 55 60 65 70 75 80 85 90 P (MPa) WCO 2 ( % )
Hiaki et al. Ishihara et al. Byun et al. This work
Fig. 2 Comparison of the measured and literature values for the liquid phase composition of SC-CO2/butan-1-ol at 313.15K
In this work, the vibrating U-tube densimeter was calibrated with water and carbon dioxide for all the pressure and temperature range of the VLE measurements. The principle of density measurements using this technology is based on the dependence of the vibration period of the U-bended part of the tube according to its mass (U-tube material and the fluid filling it). The behaviour of the vibrating tube can be compared to an undamped spring-mass, defined by its oscillation period, τ (s), such as:
D V
mo ρ
π
τ= 2 +
where m0 is the mass of the empty U-tube (kg), V is the volume of the tube (m3), ρ is the density of the
fluid (kg.m-3) and D is the spring constant (N.m-1). Rearrangement of this equation leads to a simple
definition of the density commonly used in the vibrating tube technology, like:
B
A −
= τ2 ρ
The apparatus parameters A and B are defined from measured oscillation periods at fixed pressure and temperature conditions and known densities of water [7] and carbon dioxide [8], such as:
2 ) , ( 2 ) , ( ) , ( ) , ( ) ( ) ( 2 2 2 2 P T CO P T O H P T CO P T O H A τ τ ρ ρ − − = 2 ) , ( 2 ) , ( ) , ( 2 ) , ( ) , ( 2 ) , ( ) ( ) ( ) ( ) ( 2 2 2 2 2 2 P T CO P T O H P T CO P T O H P T O H P T CO B τ τ ρ τ ρ τ − − =
It is important to note that measured oscillation periods and consequently the measured densities are very sensitive to pressure and temperature variations. Thanks to the compensation of the syringe pump (about ±0.1 mL/min) and the good precision of the several heating devices of the VLE apparatus, it gives a quite goodstability to the thermodynamic equilibrium and to the density measurements. Each experimental point was performed at least three times. The average value is given with a relative mean deviation of 0.06 %, whatever experimental conditions are. For instance, at 25 MPa and 313.15 K, density equals to 931.48±0.56 kg.m-3.
3. RESULTS AND DISCUSSION 3.1. Density measurements and modelling
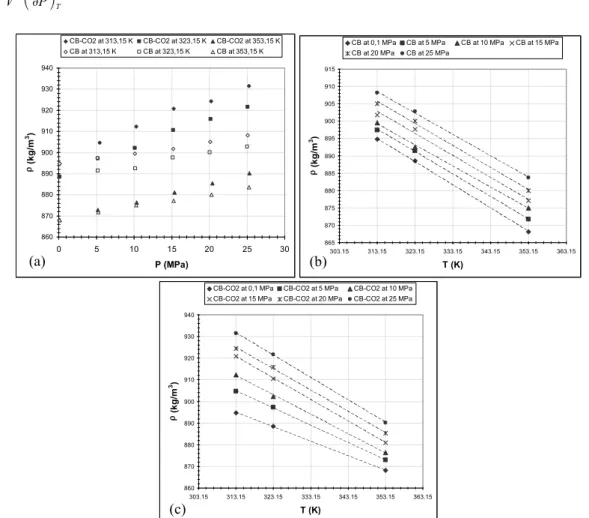
Densities were measured for CB and SC-CO2-saturated CB mixture for pressure ranging from
0.1 to 25 MPa and at 313.15, 323.15 and 353.15 K. The density of CB decreases linearly with the temperature at constant pressure and conversely the density increases linearly with the pressure at constant temperature (Fig. 3(a), 3(b)). The same behaviour for the density of CB-CO2 is observed (Fig.
3(a), 3(c)) and thus the increase of density depends only on the increase of CO2 pressure. However, the
This behaviour can be attributed to the decrease of the mixture compressibility with the temperature, which is defined as:
T P V V ⎟⎠ ⎞ ⎜ ⎝ ⎛ ∂ ∂ ⋅ = 1 χ 860 870 880 890 900 910 920 930 940 0 5 10 15 20 25 30 P (MPa) ρ (k g /m 3)
CB-CO2 at 313,15 K CB-CO2 at 323,15 K CB-CO2 at 353,15 K
CB at 313,15 K CB at 323,15 K CB at 353,15 K 865 870 875 880 885 890 895 900 905 910 915 303.15 313.15 323.15 333.15 343.15 353.15 363.15 T (K) ρ (k g /m 3)
CB at 0,1 MPa CB at 5 MPa CB at 10 MPa CB at 15 MPa
CB at 20 MPa CB at 25 MPa 860 870 880 890 900 910 920 930 940 303.15 313.15 323.15 333.15 343.15 353.15 363.15 T (K) ρ (k g /m 3)
CB-CO2 at 0,1 MPa CB-CO2 at 5 MPa CB-CO2 at 10 MPa
CB-CO2 at 15 MPa CB-CO2 at 20 MPa CB-CO2 at 25 MPa
Fig. 3 CB and CB-CO2 density dependence of the pressure (a) and the temperature (b, c)
The variations of density versus pressure and temperature can be represented for CB and the CO2
-saturated CB mixture by three empirical models: - Tait equation [9]: ⎟⎟ ⎠ ⎞ ⎜⎜ ⎝ ⎛ + + − = 0 0 ) ( ) ) ( ( ln 1 ) , ( ) , ( P T B P T B C P T P T ρ ρ with 2 2 1 0 ) (T B B T B T B = + ⋅ + ⋅
- Modified Tait equation [9] :
⎟ ⎠ ⎞ ⎜ ⎝ ⎛ + Π ⋅ − = P P A P T P T 1 ) , ( ) , ( ρ 0 ρ with 2 2 1 0 ) (T =Π +Π ⋅T+Π ⋅T Π
- Our empirical equation:
)) ( ) ( 1 ( ) , ( ) , (T P ρT P0 P P0 χ T ρ = ⋅ + − ⋅ with χ(T)=χ0+χ1⋅T+χ2⋅T2
This last model was proposed in this study and compared with Tait equations, which are widely used to fit high pressure density of solids, dense gases, pure liquids and mixtures. Note that B(T), C, A and Π(Τ) are fitting parameters without physical meaning for Tait equations on the contrary of χ(Τ), which corresponds to the fluid compressibility depending on temperature for our equation. Indeed, this last physical parameter is only dependent on temperature considering that the molten CB is incompressible. The density of the fluid at the reference pressure (P0=0.1MPa) is depending on temperature as:
T P T, 0)= 0+ 1⋅ ( ρ ρ ρ (a) (b) (c)
Thus, CB and SC-CO2-saturated CB mixture densities values at 313.15, 323.15 and 353.15 K were fitted
by these three models. In order to evaluate and compare the performance of these models, we introduce the characteristic quantities as:
∑
= = ⎟ ⎟ ⎠ ⎞ ⎜ ⎜ ⎝ ⎛ − ⋅ = N i i cal N AAD 1 exp exp 100 1 ρ ρ ρ ⎟ ⎟ ⎠ ⎞ ⎜ ⎜ ⎝ ⎛ ⎟ ⎟ ⎠ ⎞ ⎜ ⎜ ⎝ ⎛ − ⋅ = exp exp 100 ρ ρ ρ cal Max MD∑
= = ⎟ ⎟ ⎠ ⎞ ⎜ ⎜ ⎝ ⎛ − ⋅ = N i i cal N Bias 1 exp exp 100 1 ρ ρ ρThe average absolute deviation (AAD) characterizes the distance between the experimental points and the modelled curve. The average deviation (Bias) characterizes the quality of the distribution of the experimental points on both sides of the modelled curve. Maximum deviation (MD) characterizes the maximum deviation generated by the model. In this work, we programmed the Levenberg-Marquardt algorithm [10] under Matlab ®. It is a very useful method for non-linear squares problem, allowing in our case to determine the optimal combination of fitting parameters of Tait and modified Tait equations in order to minimize the deviation in relation to the experimental data.
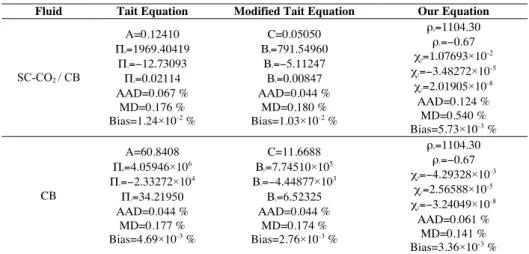
Table 1 Fitting parameters and characteristics quantities for the density modelling
Fluid Tait Equation Modified Tait Equation Our Equation
SC-CO2 / CB A=0.12410 Π0=1969.40419 Π1=−12.73093 Π2=0.02114 ΑΑD=0.067 % MD=0.176 % Bias=1.24×10⁻² % C=0.05050 Β0=791.54960 Β1=−5.11247 Β2=0.00847 ΑΑD=0.044 % MD=0.180 % Bias=1.03×10⁻² % ρ0=1104.30 ρ1=−0.67 χ0=1.07693×10 -2 χ1=−3.48272×10 -5 χ2=2.01905×10 -8 ΑΑD=0.124 % MD=0.540 % Bias=5.73×10⁻³ % CB A=60.8408 Π0=4.05946×10 6 Π1=−2.33272×10 4 Π2=34.21950 ΑΑD=0.044 % MD=0.177 % Bias=4.69×10⁻³ % C=11.6688 Β0=7.74510×10 5 Β1=−4.44877×10 3 Β2=6.52325 ΑΑD=0.044 % MD=0.174 % Bias=2.76×10⁻³ % ρ0=1104.30 ρ1=−0.67 χ0=−4.29328×10 -3 χ1=2.56588×10 -5 χ2=−3.24049×10 -8 ΑΑD=0.061 % MD=0.141 % Bias=3.36×10⁻³ %
Results obtained for density fitting show that the best ones in terms of AAD for SC-CO2 / CB mixture and
pure CB are obtained with the modified Tait equation, for which AAD is only 0.044 %. Nevertheless, results obtained with our model are satisfactory and specially the distribution of experimental points around the fitting curve is better than other models with the lowest Bias. Moreover, our equation is easier to use because it is not necessary to use optimization methods as Levenberg-Marquart algorithm for the determination of parameters.
3.2. Solubility of CO2 in cocoa butter
The phase behaviour of SC-CO2 / CB system was already studied by means of a view cell to
observe the formation of a third phase or a phase inversion [1]. It appeared that nothing occurred between 313 K and 363 K and pressures up to 35 MPa, which seems consistent with other literature results: the studied experimental domain is not large enough to reach the equidensity pressure defined as the pressure giving the same density for both phases. Hence, at 313.15 K, by assuming that the vapour phase density corresponds to that of pure SC-CO2 because of the phase composition, which reaches 98 to 99 % of CO2
according to Kokot et al. [11], the equidensity pressure of the liquid and vapour phase is calculated and estimated to be 38 MPa. This estimation is obtained by comparing the variations of SC-CO2-saturated CB
mixture (modelled by modified Tait equation) and pure CO2 densities versus pressure. Yet, we have
experimentally observed the phase inversion at 307.15 K. It can be observed that the surface tension of the melted phase decreases with the pressure and thus with the increase of SC-CO2 solubility until the
vapour phase forms a bubble surrounded by the melted phase. Consequently, at 307.15 K, the equidensity pressure is found to be 33 MPa compared to 33.5 MPa for the calculated one. In this work, the solubility of SC-CO2 is defined as a mass percentage of CO2 contained in the liquid phase rich in melted cocoa
butter and permits to deduce volume expansion, such as:
100 100 ⋅ − = ⋅ − = Δ mixture mixture CB CB mixture mixture mixture CB mixture m m m V V V V ρ ρ ρ
where is the mass of cocoa butter (g), obtained after the depressurization of the cell measurement and degassing operation allowing to determine the mass of CO2 dissolved in the liquid phase sample.
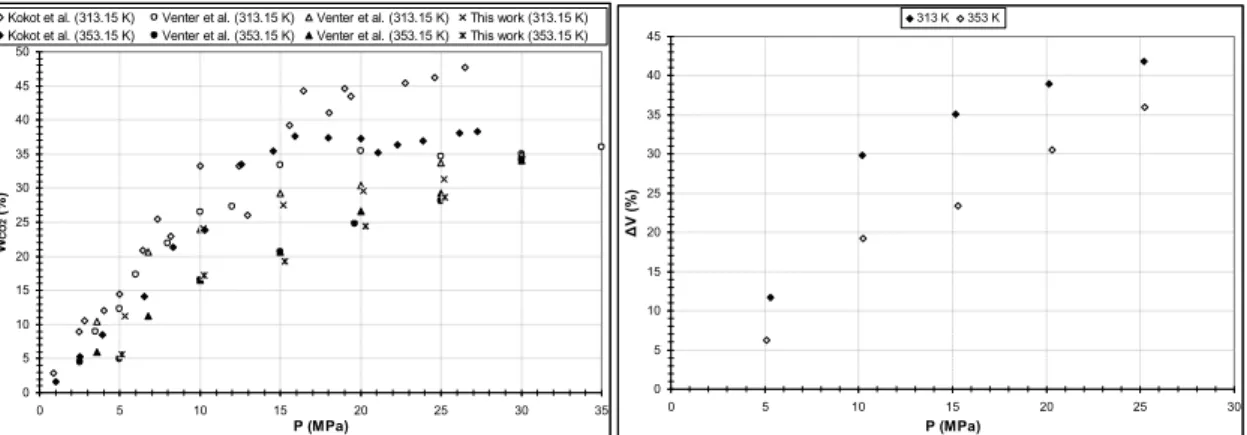
Fig. 4(a) show that the solubility of CO2 increases with the pressure and decreases with the temperature as
it has been observed in literature [1, 11]. In addition, we can see that our results are in good agreements with those of Venter et al. [1]. Relative mean deviations on measurements of CO2 solubility are
respectively 1.4 % and 3.6 % at 313.15 K and 353.15 K, whatever pressure conditions. At 313.15 K, CO2
solubility reaches a maximum of 31.3±0.5 % and causes a volume expansion of 42 % of the melted phase. 0 5 10 15 20 25 30 35 40 45 50 0 5 10 15 20 25 30 35 P (MPa) W CO 2 ( % )
Kokot et al. (313.15 K) Venter et al. (313.15 K) Venter et al. (313.15 K) This work (313.15 K)
Kokot et al. (353.15 K) Venter et al. (353.15 K) Venter et al. (353.15 K) This work (353.15 K)
0 5 10 15 20 25 30 35 40 45 0 5 10 15 20 25 30 P (MPa) Δ V ( % ) 313 K 353 K
Fig. 4 CO2 solubility (a) and volume expansion (b) of the liquid phase at 313.15 K and 353.15 K
4. CONCLUSION
A new static analytical device, easy to set up and to handle has been developed. It can be used to carry out VLE experiments with a good reproducibility and repeatability of density and phase composition measurements. These results have been compared with literature and are found to been in good agreement with those of Venter et al. [1]. A new model based on compressibility has been proposed to fit the experimental density of pure fluid and binary mixture in a wide range of pressures and temperatures.
[1] M.J. Venter, P. Willems, S. Kareth, E. Weidner, N.J.M. Kuipers, A.B. De Haan, 2007, Phase equilibria and physical properties of CO2 saturated cocoa butter mixtures at elevated pressures, Journal of
Supercritical Fluids, 41, 2, p. 195-203
[2] A. Bertucco, G. Vetter, 2001, High Pressure Technology: Fundamentals and Applications, Elsevier, Oxford
[3] A.R. Bhaskar, S.S.H. Rizvi, C. Bertoli, 1996, Cocoa butter fractionation with supercritical carbon dioxide, Proceedings of the third Iinternational Symposium on High Pressure Chemical Engineering, p. 297
[4] Ishihara, K., Tsukajima, A., Tanaka, H., Kata, M., Sako, T., Sato, M. and Hakuta, T., 1996, Vapor-Liquid Equilibrium for Carbon Dioxide+1-Butanol at High Pressure, Journal of Chem. Eng. Data, 41, 324 1996
[5] Hiaki, T., Miyagi, H., Tsuji. T., Hongo, M., 1998, Vapor Liquid equilibria for supercritical carbon dioxide + butanol systems at 313.2 K, Journal of Supercritical Fluids, 13, p. 23-27
[6] Byun, H.S., Kwak, C., 2002, High pressure phase behaviour for carbon dioxide-1-butanol and carbone dioxide-1-octanol systems, Korean Journal of Chemical Engineering, 19(6), p. 1001-1013
[7] W. Wagner, A. Pruss, 2002, The IAPWS formulation 1995 for the thermodynamic properties of ordinary water substance for general and scientific use, J. Phys. Chem. Ref. Data, 31, 2, 387-535
[8] R. Span, W. Wagner, 1996, A New Equation of State for Carbon Dioxide Covering the Fluid Region from the Triple-Point Temperature to 1100 K at Pressures up to 800 MPa, J. Phys. Chem. Ref. Data, 25, 6, 1509-1596
[9] J. H. Dymond, R. Malhotra, 1988, The Tait equation : 100 Years on, International journal of thermophysics, vol. 9, No. 6
[10] K. Levenberg, 1944, A Method for the Solution of Certain Non-linear Problems in Least Squares, Quarterly of Applied Mathematics, 2(2):164–168
[11] K. Kokot, Z. Knez, D. Bauman, 1999, S-L-G (solid-liquid-gaz) phase transition of cocoa butter in supercritical CO2, Acta Aliment., 28, 2, p. 197-208
CB m