HAL Id: hal-01630525
https://hal.archives-ouvertes.fr/hal-01630525
Submitted on 6 Nov 2018HAL is a multi-disciplinary open access
archive for the deposit and dissemination of sci-entific research documents, whether they are pub-lished or not. The documents may come from teaching and research institutions in France or abroad, or from public or private research centers.
L’archive ouverte pluridisciplinaire HAL, est destinée au dépôt et à la diffusion de documents scientifiques de niveau recherche, publiés ou non, émanant des établissements d’enseignement et de recherche français ou étrangers, des laboratoires publics ou privés.
A business process oriented method to design supply
chain performance measurement systems
Matthieu Lauras, Jacques Lamothe, Hervé Pingaud
To cite this version:
Matthieu Lauras, Jacques Lamothe, Hervé Pingaud. A business process oriented method to design supply chain performance measurement systems. International Journal of Business Performance Man-agement, Inderscience, 2011, 12 (4), p.354-376. �10.1504/IJBPM.2011.042013�. �hal-01630525�
A business process oriented method to design
supply chain performance measurement systems
Matthieu Lauras*
Department of Industrial Engineering, Université de Toulouse,
Mines Albi, Campus Jarlard, Route de Teillet, 81013 Albi Cedex 9, France
and
Department of Industrial Organisation, Logistics and Technology, Toulouse Business School, Université de Toulouse,
20 Boulevard Lascrosses, BP 7010, 31068 Toulouse Cedex 7, France E-mail: [email protected]
*Corresponding author
Jacques Lamothe and Hervé Pingaud
Department of Industrial Engineering,Université de Toulouse,
Mines Albi, Campus Jarlard, Route de Teillet, 81013 Albi Cedex 9, France
E-mail: [email protected] E-mail: [email protected]
Abstract: While performance management forms an integral part of the
concept of supply chain management, designing a consistent and powerful performance measurement system (PMS) at the level of an enterprise network is still proving very problematic. In this paper, a business process oriented approach is proposed to tackle problems of heterogeneity between partners. Special attention is paid to the representation of both decisional and operational activities, taking into account the links between them. Based on this framework, a method is applied to select, implement and publish the key performance indicators (KPI). We propose a classification of KPI into three categories related to management abilities: ambition, reality and facility. These classes form a consistent set to support decision making and process control at a network level. A business case is used to show the potential of this approach.
Keywords: supply chain; performance measurement system; PMS; business
process management; enterprise modelling; control theory.
Biographical notes: Matthieu Lauras was a Supply Chain Project Manager in a
pharmaceutical company from 2001 to 2005. After this experience, he joined the Industrial Engineering Department of the University of Toulouse – Mines Albi, France as an Associate Professor. His research interest is focused on
performance, integration and management of supply chain processes. His research activities concern not only traditional industrial sectors, but also the humanitarian sector. He has published several papers in journals and international conferences in the field of supply chain management.
Jacques Lamothe is a Professor at the Industrial Engineering Department of the University of Toulouse – Mines Albi, France. He received his PhD of Ecole Nationale Supérieure de l’Aéronautique et de l’Espace in 1996. He manages the Supply Chain Research axis of the Department. His research mainly concerns the design and control of supply chains. He publishes several papers on supply chain management in European Journal of Operation Research, International
Journal of Production Research, International Journal of Business Performance Management and Journal of Integrated Computer-aided Engineering.
Hervé Pingaud is a Professor at the Industrial Engineering Department of the University of Toulouse – Mines Albi, France. He is also the Director of the Jean-François Champollion University, France. His main research interests are on enterprise interoperability, collaborative information systems, business process management and risk management. All his works are based on a business process modelling approach. He was the Co-Chairman of the French research working group on enterprise networking and integration and he is a member of the IFAC technical committee on the same subject.
1 Introduction
For a number of years, specialists (Beamon, 1999; Stadtler and Kilger, 2000; Gunasekaran et al., 2004; Chan et al., 2006; Neely et al., 2006; Gunasekaran and Kobu, 2007; Akyuz and Erkan, 2010) have highlighted the limitations of solutions based on the performance measurement systems (PMS) in use today. Very important supply chain features, like business process and information partner heterogeneities or the limited accessibility to information, for example, have been underestimated or, in some cases, not considered at all. These authors point out that there is little knowledge available on PMS and the choice of the right key performance indicator (KPI) in the open literature on supply chain environments (Beamon, 1999). More recently, other authors (Gunasekaran and Kobu, 2007; Alfaro et al., 2009; Akyuz and Erkan, 2010) have confirmed that academics and practitioners are still in need of a new PMS which can handle the requirements of the new supply chains.
Progress on supply chain performance measurement requires an outlook encompassing the extended enterprise, a state of mind that emphasises a collaborative win-win policy between respective supply chain partners. Lee (2000), Al-Mudimigh et al. (2004) and Alfaro et al. (2009) stress that the first step in developing an efficient supply chain is to improve the performance of disparate internal systems and processes responsible for managing and coordinating the interactions in the value chain. They show that interfacing activities locally, without a systematic overview, may result in failure, as it will be dependent on an exclusive use of internal measurements. Folan and Browne (2005) note effectively that the development of disparate measurement systems may result in superfluous and incompatible performance evaluation. Because companies are
moving towards a more integrated type of operations management across their supply chains:
• it is becoming necessary to measure performance on the various parts of the supply
chain in a consistent way, i.e. with the support of a clear, logical and intelligible framework in which the PMS will work (Lohman et al., 2004)
• there is a need to quantify performance for the supply chain as a whole and refer
properly to different problem dimensions.
Explicit knowledge of a supply chain can be gained by business process modelling, which has been recognised as a good practice to reduce heterogeneity problems. Once they are drawn up, collaborative processes between supply chain partners provide a common acceptance of the business and define the many interfaces that need to be managed. However, most of the time, the standard representation of business processes is limited to operational and support processes. The operational processes are sequences of activities that are executed using qualified resources that transform inputs (material or immaterial flows) into outputs, and that are under control. Support processes are responsible for the availability of the means required for the execution of operational activities. We seek to demonstrate later in this paper that, while this primary basis of knowledge is useful in defining KPIs, the PMS claim that it has a capacity to manage cannot be accepted without an investigation into decision-making activities.
Therefore, in our approach, we emphasise decision-making representation and try to prove the added value for the design and operation of the PMS. Decision-making processes are a foundation of management activities. They deliver the control information that the operational activities need (when the execution will start, what the objectives are). But they are also in charge of selecting, booking and monitoring resources for the predicted executions. Folan and Browne (2005) specify two kinds of requirements for managing performance with business processes:
• a procedural performance measurement framework shall evaluate the performance of
each activity and process
• a structural performance measurement framework shall evaluate the performance at
each level of the organisation (internal and external).
In accordance with the above, we propose a complete and systemic methodology to help practitioners to define a new PMS for SCM, in terms of both procedural and structural performance measurement. Our contribution is basically twofold:
• producing rules that guarantee relevant and systematic KPI definitions according to
supply chain business process knowledge (process repository)
• effectively supporting the improvement of supply chains through an original
performance analysis framework.
The paper is organised as follows. In the next part, we discuss performance measurement concepts in the perspective of organisation networks. Later on, we will try to analyse available knowledge on PMS and associated methods. This analysis will show some strengths and weaknesses of well-known methods, especially in the context of management applications. An outline of a new PMS for SCM will be explained in the continuity of these mixed results. Then, we propose a six-step method to put the PMS
into practice. This method is founded on enterprise-modelling concepts. The performance determinant is introduced as a key variable for the management, acting as a cornerstone between decision and action, and we will show that its sensitivity on performance can be assessed with an inference mechanism on appropriate process model maps. Finally, we give some feedback about an implementation of this PMS on a real supply chain business case.
1.1 Process oriented supply chain PMSs
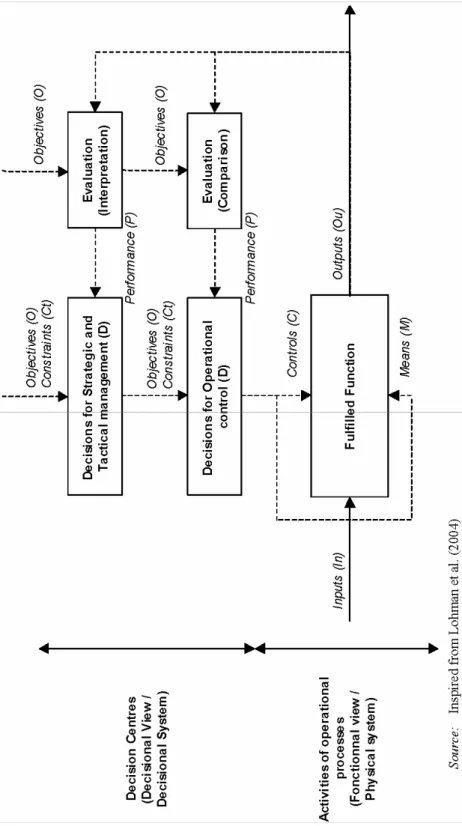
It is commonly agreed that a manager follows a four step approach to control a system. Smith and Goddard (2002): define the set of KPIs; measure performance; analyse responses with respect to objectives; act to satisfy the objectives. There is clearly a kind of analogy with the closed loop system in cybernetics control theory. The three elements which address the problem (the set point, the measurement itself and the control variable) can be interpreted in a management context (see Figure 1, inspired from Lohman et al., 2004):
• The set point represents the expected state of the controlled operating system. It is
the expected trajectory and can be interpreted as a contribution to the expected objectives on the value chain.
• The measurement reports on the real state of the operating system. It is used to check
the difference with the set point and this gap analysis corresponds to a diagnosis.
• The control variable value is adjusted with the aim to reduce the above difference, in
the most efficient manner and in the future. The control loop is considered closed at this point, when the measured variable and the control variable are dependent. The control variable may be compared to a decision taken on the basis of the diagnosis. Obviously, when this closed control loop representation is roughly applied to complex systems such as supply chains, the analogy quickly reveals some drastic limitations. Human factors and decision making are so important in SCM that a descriptive picture of the system would probably be drawn with more confidence using an open loop. But even if comparing decision makers as a complex control transfer function is an awkward position, we have to keep in mind how important this analogy is to understanding PMS in the tricky situation under study.
Several authors have reviewed the literature on performance measurement, performance metrics, performance evaluation and/or performance management for enterprise networks or supply chains (Chow et al., 1994; Neely et al., 1995, 1996; Beamon, 1999; Bourne et al., 2003; Kleijnen and Smits, 2003; Folan and Browne, 2005; Chan et al., 2006; Gunasekaran and Kobu, 2007; Alfaro et al., 2009; Martin and Patterson, 2009; Akyuz and Erkan, 2010). Both accounting management and operations management have dealt with these subjects. Theories and methods cover the whole range of performance influences on decision levels, from the strategic to the operational decisions (Lohman et al., 2004).
In the following sections, we begin by a study of KPI design on SC operational processes. Then, we conduct a study of the relationship between performance and decision making, with an enterprise model oriented approach, with reference to the control loop. In our third part, we try to reconcile the two faces of the problem by exploiting complementarities using the control system analogy.
1.1.1 Performance of supply chain operational processes
The idea of identifying an activity as the atomic entity onto which the performance must be achieved is not new. At the scale of a single organisation, activity-based costing and activity-based management (ABC/M) have promoted this idea for a long time. They are concerned with information on costs and margins (Cokins, 2001). ABC assigns costs to activities on the basis of their use of resources and then allocates costs to products according to their ratio of activity consumptions. If the principle seems intuitively obvious, the access to pertinent information in order to implement the method is frequently a limitation (Ghalayini et al., 1997). Moreover, the large volume of information processed by the method is controlled by the definition of KPIs which are supposed to be meaningful for ABM through the use of well structured dashboards (showing progress of actions applied to strategy, value perceived by the customer, performance of competitors, the quality and the improvement steps). It is quite clear that the extrapolation of such approaches to networks of cooperative organisations is not easy, because, for example, the different kinds of costs are vital pieces of information that cannot be spread over the set of partners without potentially negative effects on business transactions. In addition, some ABM dashboard dimensions (i.e., customer, competitor) could become fuzzy. This is an illustration of blockages that any extension of PMS to SCM has to deal with.
The holistic process PMS (Kueng, 2000), the performance prism (Neely et al., 2002), the process-based framework (Chan and Qi, 2003) or the Fraunhofer approach (Bourne et al., 2003) are initiatives that have already developed the idea of PMS design based on business processes at the scale of an enterprise or a network. The pertinence of KPIs is enhanced by the knowledge captured in process representation. Process models are oriented graphs of activities that naturally provide a solution to allow aggregation of data and to quantify KPI. This is emphasised by the fact that a business process model frequently has many levels of decomposition, and that KPI can be distributed among those levels at approximately the right scale of activity detail.
As previously stated, in the context of a supply chain, a business process representation is a necessity to check the common agreement of businesses and put a frontier between what can be shared among partners and what cannot be shared. Because of this search for agreement, the supply chain operations reference (SCOR) model has received a lot of attention from practitioners. The SCOR model (Supply Chain Council, 2003), provides a unified representation of supply chains with five general processes: plan, source, make, delivery and return. Each process can be refined into sub-processes, which are themselves decomposed into sub-sub processes, and so on. The first granularity levels of the reference model are generic enough and can be used to compare several companies of a given sector. Three categories of KPI are proposed in the SCOR model dashboard (Bolstorff, 2002) depending on what they are related to:
• customers (service, flexibility, effectiveness-swiftness)
• internal processes (costs and efficiencies)
• shareholders (profitability, return on investments).
Although these performance indicators are attached to processes and well formulated, they remain very difficult to set up within an existing supply chain. If the decomposition process on a macroscopic level is general enough to be applied to many cases, the more
detailed levels (level 2 and especially level 3) may be difficult to identify using the SCOR elementary processes, because specificities increase with the granularity of process representation. In addition, the SCOR model does not ‘try to close the loop’, and there is no suggestion that the KPIs should be used to manage the system. Thus, without a method, it could be rather difficult – even random in some cases – to define, the necessary corrective actions on this basis alone.
1.1.2 Performance and decision making processes
A large number of PMS methods link performances to decisions. We can quote for instance, the strategic PMS (Vitale et al., 1994), the performance measurement questionnaire (Bourne et al., 2003; Chan et al., 2006), the strategic measurement analysis and reporting technique system (Cross and Lynch, 1989) or Cambridge University’s PMS method (Bourne et al., 2003). They insist on the need to split decisions into many levels depending on their weight on the organisation and their time effect. They also examine the sensitivity between KPI variations and alternative decisions by direct investigation.
But if information on performance is condensed in KPIs, it is also possible to synthesise information on decision using the well-known performance determinant, a concept first introduced by the balanced scorecard method (BS) (Kaplan and Norton, 1996). The performance determinant could be defined as the ‘decision variable’ that mainly controls an activity. The ‘decision variables’ of an activity ensure that the system is effectively controllable and avoids conflicts between the decisions made within the system. The concept of the determinant identifies a sub-set of these decision variables that should have an influence on the performance of the activity. Consequently, the main criterion to select determinants is the sensitivity evaluation of their influence on the system (activity). BS focuses on strategic management, and even if a reference to internal processes is proposed as an improvement policy, there is very little information about the method to achieve it.
Representing maps of decisions in an organisation is a difficult, if not unfeasible, task. Time decomposition of decisions is normal practice in management science. However, for procurement, production and distribution systems like supply chains, it is possible to have a more structured approach to the chain of decisions with respect to both business process and time. Enterprise modelling has produced results in this area. In particular, the GRAI method has been developed using this idea to produce a two dimensional map (a grid) of the decision centres inside the organisation. The columns of a GRAI grid are the main business processes (called functions) of the organisation while the lines are the time periods. A cell of the grid (intersection between a function and a time period) defines the perimeter of decision-making and is called a decision centre. Two types of arrows are used between the decision centres to show how some decisions are influenced by others, on the one hand, and how information are distributed on the grid after a decision making, on the other hand. The representation of a propagation mechanism on the grid defines a partial preset order between decision centres, which we shall hereafter refer to as decisional processes.
GRAI appears very attractive in the perspective of an extended PMS framework. ECOGRAI is a set of methods which contributes to the improvement of a company’s performance through GRAI enterprise modelling (Ducq et al., 2001). These methods allow a system of indicators to be designed and implemented. Indicators, limited in number, are distributed in the structure of decisions inside the grid. The links that we are
searching for with the closed loop analogy are known explicitly. ECOGRAI presents a five step approach:
1 modelling the management structure and the decision centres (GRAI grid) 2 identifying the objectives of each decision centre
3 extracting the determinants that a decision-maker can use to achieve his goals 4 proposing performance indicators
5 developing, establishing and maintaining the information system of the indicators. So, ECOGRAI suggests that the performance should be associated with the variables of decision, explicitly called performance determinants. If we come back to the control loop analogy, and if we agree to compare our problem with a multivariable (MIMO loop: multiple inputs, multiple outputs) control problem, ECOGRAI provides a kind of architecture that defines the connections between the measurements and the control variables.
Although the formal framework of ECOGRAI seems to be a powerful tool, it does not offer analysis axes for the causal relationship between decisions and actions in order to facilitate the decision making, neither does it integrate the vision of operational processes proposed by previous methods. We could say that the other part of the MIMO loop, the connections between control variables and subparts of the operating systems, are missing. Consequently, determining the sources of an actual deficiency from this model remains based on the know-how of the decision-maker. Furthermore, tentative use of GRAI enterprise modelling techniques on a supply chain is still in its infancy (even if the five processes of the SCOR first level are natural candidates for a node of a network application, the structure of the network is difficult to address in only one dimension).
1.1.3 Outline of the PMS architecture
Folan and Browne (2005) explain that the control could be broken up into several levels of different range:
• the operational control that relates to the regulation of a physical process compared
to a pre-established instruction
• the tactical control that consists in adapting the existing resources at a particular state
• the strategic control that aims to correct variations in comparison with the strategic
objectives.
The principle of the articulation between these various levels was approached in the works of Lohman (1999), Lohman et al. (2004) and Folan and Browne (2005). For instance, Lohman et al. (2004) have proposed a schematisation by a double control loop depicted in Figure 1. The strategic and tactical loops are amalgamated.
A KPI is a piece of input information to the diagnosis activity that the decision maker has to carry out. Performance management is regularly fed, and decision making triggered, by KPIs. Decisions on how to perform an activity are a result of the performance management. We use a process typology that distinguishes decisional processes and operational processes as a basis of PMS architecture. The first type determines the performance stakes through the control instructions that will be
transferred to operational activities and resource management. The second type is, however, the main subject of concern since it governs the achievement of objectives and is the performance ‘inductor’.
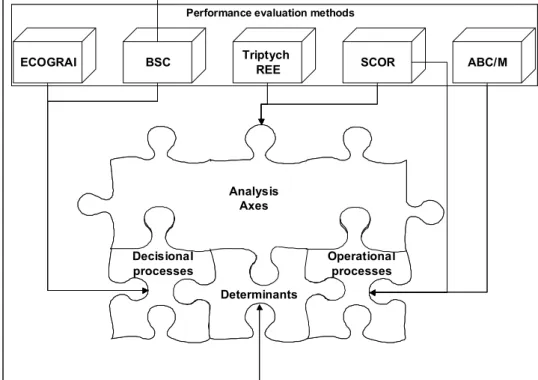
A key point in PMS architecture is to keep a clear vision of the relationship between these two types of process. This constraint is depicted on the lower part of Figure 2. Respectively from the right side to the left of this scheme, the KPIs must be:
• associated with the operational processes or activities (as proposed by ABC or
SCOR);
• articulated around the performance determinants, which represent the most sensitive
decision variables (as proposed by BS);
• defined in closed connection with the various decision processes (as in ECOGRAI).
Figure 2 Basics of PMS architecture
ECOGRAI BSC Triptych SCOR ABC/M
REE
Performance evaluation methods Performance evaluation methods
Operational processes Decisional processes Determinants Analysis Axes
ECOGRAI BSC Triptych SCOR ABC/M
REE
Performance evaluation methods Performance evaluation methods
Operational processes Decisional processes Determinants Analysis Axes
One problem remains to be solved in order to complete the definition of the PMS architecture. The distributed nature of processes along a supply chain is a source of difficulties when KPIs have to be classified and published. We have argued that ECOGRAI gives a first part of the answer to that question by its structure of links between KPIs and performance determinants. However, the relations to the operational processes need to be studied in order to complete the framework.
The approach to tackle this last problem was based on the idea that a decision is a set of instructions intended both for an operational activity on what must be performed at the
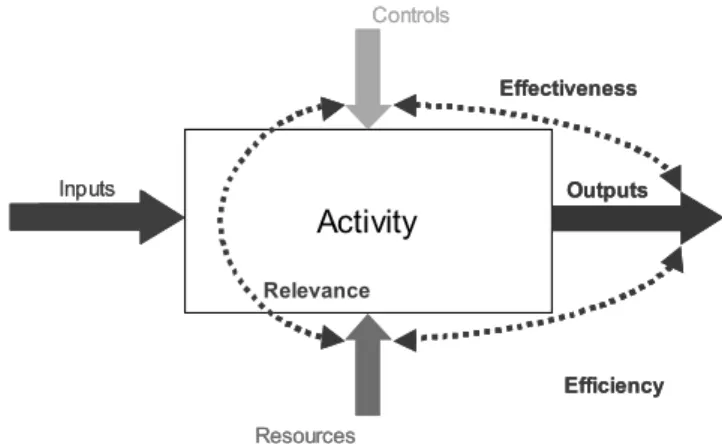
end of the execution, and for support processes on the resources that should be provided to allow this execution. Using a SADT/IDEF0 diagram to model an operational process (functional process representation) or an activity, as shown on Figure 3, we develop a systematic rule to structure KPI definitions. The rule uses concepts of relevance, effectiveness and efficiency (REE) introduced by Jacot (1990). REE is based on comparison between the objectives/results/resources, a triptych that basically aims to discuss the performance of an activity. Effectiveness measures whether the results of the activity meet its objectives. Efficiency expresses whether the resources were well used to reach the results. Relevance measures the appropriateness of the means to the objectives. Despite its simplicity, it is surprising that this kind of analysis has received little attention in the past.
Figure 3 Relevance, effectiveness, efficiency triptych
Activity Relevance Effectiveness Efficiency Outputs Controls Resources Inputs Activity Relevance Effectiveness Efficiency Outputs Controls Resources Inputs
Applying this rule to the whole system gives an opportunity to make factorisation (a form of aggregation) easily. Moreover, it provides a simple solution to the problem of the relationships to the decision centres. Therefore, the PMS architecture will include three axes of operational process performance analysis, reported on the upper part of Figure 2. This approach remains generic, and takes the opposite direction to the more specific definitions proposed by many methods, such as BS, for the axes of analysis.
2 Designing the supply chain PMS 2.1 PMS in operation
Returning to Figure 1, we can now describe the interface between the different parts of the PMS architecture and explain how information is processed along the control loop.
As stated earlier, a decision-making centre (upper part of the figure) has to produce controls and to allocate means to a whole or part of an operational process (seen as the fulfilled function). For this purpose, a decision-making centre determines values of decision variables from external information and from the results of the performance evaluation, so as to satisfy objectives and respect constraints.
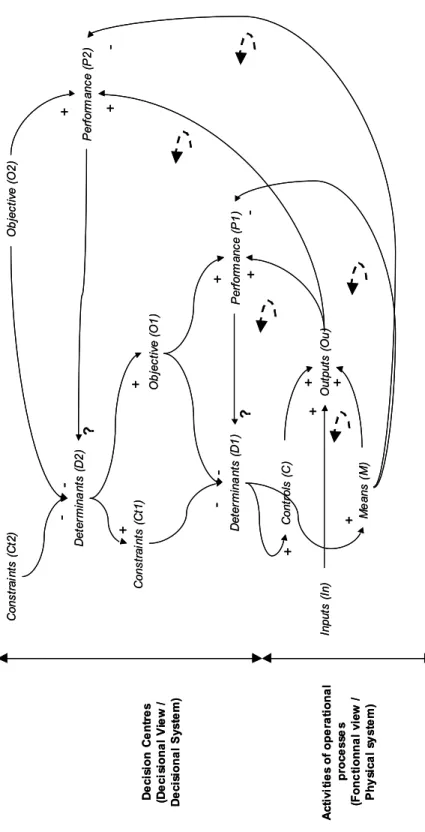
Figure 4 Performance influence diagram Ob je ct iv e (O1 ) De te rm in a nt s (D1 ) Co nt ro ls ( C ) Me an s (M ) In pu ts ( In ) Ou tp ut s (Ou ) Pe rf or m an ce ( P1 ) Pe rf or m an ce ( P2 ) Ob je ct iv e (O2 ) De te rm in a nt s (D2 ) Co ns tr ai nt s (Ct 1) Co ns tr ai nt s (Ct 2) + + + + + + + -? + -+ ? + + Ac ti vi ti e s o f o p e ra ti o n a l pr oc e ss e s (F o n c ti o n n a l vi ew / Ph y si ca l sy st e m ) De ci si o n Ce n tr e s (D e ci si o n a l V ie w / De ci si o n a l S ys te m ) Ob je ct iv e (O1 ) De te rm in a nt s (D1 ) Co nt ro ls ( C ) Me an s (M ) In pu ts ( In ) O utp uts ( O u ) Pe rf or m an ce ( P1 ) Pe rf or m an ce ( P2 ) Ob je ct iv e (O2 ) De te rm in a nt s (D2 ) Co ns tr ai nt s (Ct 1) Co ns tr ai nt s (Ct 2) + + + + + + + -? + -+ ? + + Ac ti vi ti e s o f o p e ra ti o n a l pr oc e ss e s (F o n c ti o n n a l vi ew / Ph y si ca l sy st e m ) De ci si o n Ce n tr e s (D e ci si o n a l V ie w / De ci si o n a l S ys te m )
At the operational level, the performance evaluation (P) will consist in comparing the measurements taken on the outputs (Ou) of the operational process activity with the corresponding objectives (O) considered as instructions. If an anomaly is noted between the measurement and the objective, then one or more decisions (D1) are taken to correct the dynamic behaviour of the system. Thus, a unit of decisions D1 will have to define controls (C) and/or means (M) for the implied activity.
The second loop relates to the decision-making centre of higher levels (tactical and strategic). The time-constants are greater, and the information is more compact. These levels work on a prediction of the behaviour (described by a program). This program is a set of instructions and allocations of resources for a given period of time.
Inspired by Akkermans and van Oorschot (2005), we propose to use influence
diagramscoming from the system dynamics theory proposed by Forrester (1968) to
explain the propagation of information. It is important to notice that we do not use influence diagrams in a quantitative manner in this paper. System monitoring is clearly beyond our scope. We simply focus on the dissemination of information from the operational business processes to the decisional business processes.
Figure 4 shows such a diagram in analogy with Figure 1, i.e., for a simple case of two decision-making centres superposed, and connected to only one function at the operational level. This figure clearly shows the originality of our approach to tackle the problem of performance evaluation at a network level. As described in the previous sections, our proposal consists in defining performance indicators according to the transverse business processes of the supply chain and not with regard to the different services or departments of each company (and so to base the performance evaluation on reliable information). But our contribution (as described in Figure 4) also consists in controlling the dissemination of this information from the operational level to the decisional level in order to be able to assess performance reliably:
As previously stated decisions taken at the operational level (D1 determinant) have an effect on the capacity of the means and on the levels of requirements assigned. They directly impact the outputs, which are also influenced by the inputs of the activity.
Compared to the objective O1, a performance variable (P1) translated the effect of the value of the output variable (Ou). The more the outputs conform to the objectives, the better the performance will be (effectiveness). But, the performance is also evaluated in conjunction with the allocation and the use of the means (efficiency). We thus establish a relation between the means variable (M) and the performance (P1).
A similar approach enables us to understand the effect of the higher decision levels. Thus, it appears that the performance (P2) relating to the activity controlled from this decision-making centre is the comparison of the whole of the outputs (Ou) with the objectives (O2), under condition of the means (M).
The decision-making which generates values of D1 (resp. D2) starting from the recorded performances P1 (resp. P2) and from the postulated objectives O1 (resp. O2), is done with respect to Constraints Ct1 (resp.Ct2).
2.2 Expressiveness of performance analysis axis
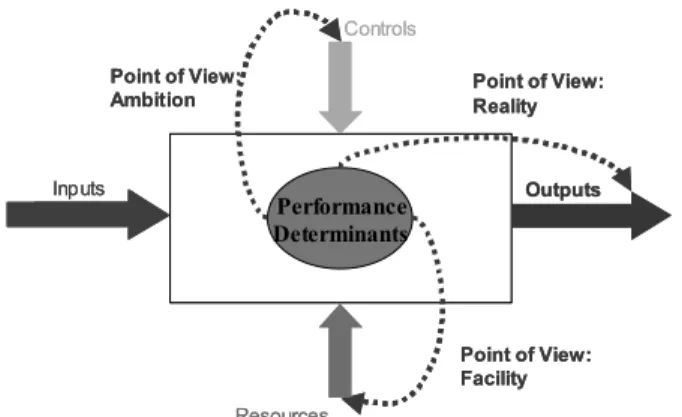
Using the comparison included in the triptych REE, we decided to introduce three new categories of performance indicators, called ‘points of view’, which are intended to help reasoning during the diagnosis phase of PMS operation. We use KPIs that are built with
reference to the performance determinant values. The definitions of these three classes are as follows:
• The ‘ambition point of view’ evaluates the appropriateness of the controls to the
performance determinants. The objective is to evaluate the feasibility of the controls assigned to the activity. In other words, does the activity have the means to match its ambition? This information allows the detection of unexpected controls or
determinants unsuited to the mission. Here we are measuring the distance from the determinants to the instructions. It is important to notice that the controls are not some decision variables but only the objective or the constraint the activity has to reach. A consequence of a bad result on this point of view might be a modification of the objectives assigned to the activity or the implementation of a more effective process.
• The ‘reality point of view’ evaluates the appropriateness of the activity results to the
determinants. The objective is to check whether the activation of the determinants produces the expected results. We measure here the cause-effect relationship of the determinants on the results. Specifically, this point of view assesses whether the decisions that are supposed to control the activity and its results are adapted or not. A consequence of a bad result on this point of view might be a change in the decision-making process (transition from a classical Procure and Demand process to a Vendor Managed Inventory process for instance).
• The ‘facility point of view’ evaluates the appropriateness of the resources to the
determinants. The objective is to identify what the impact of the determinants is on the means used by the execution of the operational activity. This information allows the detection of insufficient or oversize resources. We measure here the cause-effect relation of the use of resources due to the determinants. In other words, the facility point of view measures the quantity of energy (human resources, costs, machines, etc.) the determinant has to use in order to produce the activity’s results. A consequence of a bad result on this point of view might be some new investments (new machines, new capabilities, etc.).
These three points of view are not independent. Without ignoring these interactions, our proposal simply provides a way to analyse these relationships.
Figure 5 is a translation of Figure 2 with this new set of analysis axes. Figure 5 Points of view for performance evaluation
Performance Determinants
Point of View:
Ambition Point of View: Reality
Point of View: Facility Outputs Controls Resources Inputs Performance Determinants Point of View:
Ambition Point of View: Reality
Point of View: Facility Outputs Controls Resources Inputs
Figure 6 Detailed PMS architecture Deci si onal Vie w GR A I G RI D In te rn al In fo . FU NC TI O N 1 FU NC TI O N 2 FU NC TIO N 3 Ex te rn al In fo . ST RA TE G IC TA C TI C PE RF O RM AN CE DE TE R M IN AN T OP ER AT ION A L PE RF O RM AN CE DE TE R M IN AN T
KPI
Fun cti onal Vie w Pe rfor m an ce Eval uati on GR A I G RI D In te rn al In fo . FU NC TI O N 1 FU NC TI O N 2 FU NC TIO N 3 Ex te rn al In fo . ST RA TE G IC TA C TI C PE RF O RM AN CE DE TE R M IN AN T OP ER AT ION A L PE RF O RM AN CE DE TE R M IN AN TKP
I
Supp ly Chai n Node 1 Su pp ly C h ai n N ode 2 Le gend: De cision flo ws Ob je ct iv es a nd M ea ns p ro pa ga tio n Me as ur em en ts Fee dba ck loop Phy sical flow Deci si onal Vie w GR A I G RI D In te rn al In fo . FU NC TI O N 1 FU NC TI O N 2 FU NC TIO N 3 Ex te rn al In fo . ST RA TE G IC TA C TI C PE RF O RM AN CE DE TE R M IN AN T OP ER AT ION A L PE RF O RM AN CE DE TE R M IN AN TKPI
Fun cti onal Vie w Pe rfor m an ce Eval uati on GR A I G RI D In te rn al In fo . FU NC TI O N 1 FU NC TI O N 2 FU NC TIO N 3 Ex te rn al In fo . ST RA TE G IC TA C TI C PE RF O RM AN CE DE TE R M IN AN T OP ER AT ION A L PE RF O RM AN CE DE TE R M IN AN TKP
I
Supp ly Chai n Node 1 Su pp ly C h ai n N ode 2 Deci si onal Vie w GR A I G RI D In te rn al In fo . FU NC TI O N 1 FU NC TI O N 2 FU NC TIO N 3 Ex te rn al In fo . ST RA TE G IC TA C TI C PE RF O RM AN CE DE TE R M IN AN T OP ER AT ION A L PE RF O RM AN CE DE TE R M IN AN TKPI
Fun cti onal Vie w Pe rfor m an ce Eval uati on GR A I G RI D In te rn al In fo . FU NC TI O N 1 FU NC TI O N 2 FU NC TIO N 3 Ex te rn al In fo . ST RA TE G IC TA C TI C PE RF O RM AN CE DE TE R M IN AN T OP ER AT ION A L PE RF O RM AN CE DE TE R M IN AN TKP
I
Supp ly Chai n Node 1 Su pp ly C h ai n N ode 2 Le gend: De cision flo ws Ob je ct iv es a nd M ea ns p ro pa ga tio n Me as ur em en ts Fee dba ck loop Phy sical flow Le gend: De cision flo ws Ob je ct iv es a nd M ea ns p ro pa ga tio n Me as ur em en ts Fee dba ck loop Phy sical flow2.3 Putting PMS into practice on supply chain
Figure 6 is a useful aid to understanding the implementation of the proposed PMS. We summarise the work with the following six-step approach:
1 Define the SC decision process maps using a set of interconnected GRAI grids: specify through this formulation the various time periods, the functions and the decision centre. Associate the performance determinants to the decision centre. The resulting part of a model makes it possible to specify, for each decision centre, the temporal elements to be considered in the definition of indicators (minimal periodicity of measurement and horizon of projections).
2 Complete the process model representation with the SADT/IDEF0 operational processes for each identified functions. This work defines the links between functions, resources, material flows, and controls.
3 Allocate the performance determinants to the functions. This consists in propagation, for each horizon, of the decision levers onto the operational process model.
4 On the basis of the models, decision-makers define their performance indicators (results and determinants). In parallel, they also prepare their diagnosis ability by defining the three points of view (ambition, reality and facility). The use of standard formulations coming from experts or best practices (Bowersox and Closs, 1996; Supply Chain Council, 2003; Neubert and Pichot, 2002; Gunasekaran et al., 2004) is recommended.
5 Implement the dashboards in the information systems. Perform, automatically if possible by an executive information system, their calculations according to the temporalities.
6 Manage the supply chain using performance measurement: use the portfolio of indicators to lead supply chain continuous improvements, particularly on cooperation links. This can result in redefining responsibilities (decision-making), operational or decisional processes or action levers which force a return to Step 1.
We can remark here that we do not propose any KPI in this research work. Our proposal consists only in structuring a method to help decision-makers to define reliable KPIs at a network scale. But our proposal could of course also be used at a single enterprise level (which is a more simple case) whereas the traditional PMSs discussed in the previous part are generally designed for a single company and could not be extended at a supply chain level.
3 Application to a pharmaceutical supply chain
The proposed PMS has been implemented and tested on a business case, an international pharmaceutical supply chain. The system under study is made up of a world central entity that manages its production units and central distribution centres, and a set of national entities that manage their local markets, procure products from the world entity, and possibly transform products locally. We give here some details about this experiment.
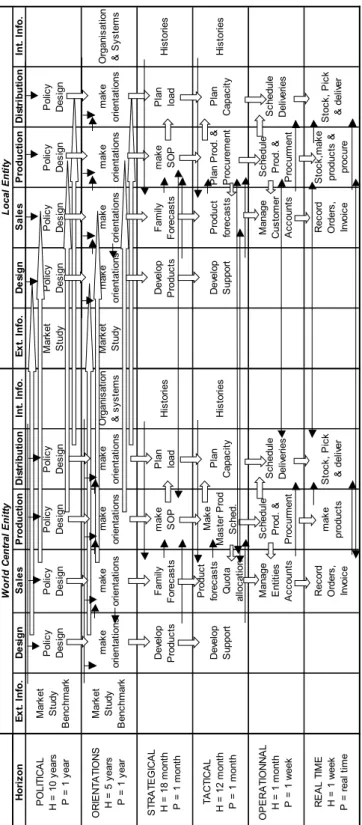
Figure 7 GRAI grid of the world and local entities Ho ri zo n E x t. I n fo . D e si g n S a le s P ro d u ct io n Di st ri b u ti o n In t. I n fo . E x t. I n fo . D e si g n S a le s P ro d u ct io n Di st ri b u ti o n In t. I n fo . PO LI TI C AL H = 1 0 ye ar s P = 1 y ea r Ma rk et St ud y Be nc hm ar k Po lic y De si gn Po lic y De si gn Po lic y De si gn Po lic y De si gn Ma rk et St ud y Po licy De si gn Po lic y De si gn Po lic y De si gn Po lic y De si gn OR IE N TA TI ON S H = 5 y ea rs P = 1 y ea r Ma rk et St ud y Be nc hm ar k ma ke or ient at ion s ma ke or ien tat ions ma ke or ie nt at io ns ma ke or ien tat ions Or ga ni sa tio n & sy st em s Ma rk et St ud y ma ke or ie nt at ions ma ke or ie nt at io ns ma ke or ien tat io ns ma ke or ie nt at ions Or ga ni sa tio n & Sys te m s ST R AT E G IC A L H = 1 8 m on th P = 1 m on th De ve lo p Pr od uc ts Fa mily Fo re ca st s ma ke SO P Pl an lo ad Hi st or ie s De ve lo p Pr od uc ts Fa m ily Fo re ca st s ma ke SO P Pla n lo ad Hi st or ie s TA C TI C A L H = 1 2 m on th P = 1 m on th De ve lo p Su pp or t Pr od uc t fo re ca st s Quot a al loc at io n Ma ke Ma st er P ro d Sc he d. Pl an Ca pa ci ty Hi st or ie s De ve lo p Su pp or t Pr od uc t fo re ca st s Pla n Pr od . & Pr oc ur em en t Pl an Ca pa ci ty Hi st or ie s OP E R A TI ON N A L H = 1 m on th P = 1 w ee k Ma na ge En titi es Ac co un ts Sc he du le Pr od . & Pr oc ur m en t Sc he du le De liv er ie s Ma na ge Cu st om er Ac co un ts Sc he du le Pr od . & Pr oc ur m en t Sc he du le De liv er ie s RE A L TI M E H = 1 we ek P = re al ti m e Re co rd Or de rs , In vo ic e ma ke pr odu ct s St oc k, P ic k & de liv er Re co rd Or de rs , In vo ic e St oc k, m ak e pr oduc ts & pr oc ur e St oc k, P ic k & de liv er Wo rl d C en tr al E n it ty Loc al E nt it y
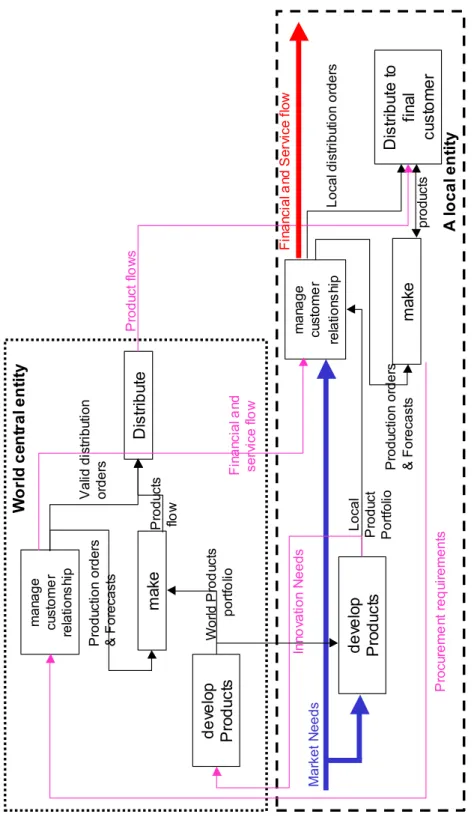
Figure 8 Functional view for the ‘orientations’ decision level (see online version for colours) ma ke Di st rib ut e ma na g e cu st o m e r re la tio ns hi p dev el op Pr odu ct s Wo rld P ro d uc ts por tfo lio Pr o d uc ts flo w Va lid d is tri b ut io n or der s Pr o d uc tio n o rd er s &F o re ca st s Wo rl d c en tr a l e n ti ty ma ke Di st rib ut e to fin al cu st o m e r ma na g e cu st o m e r re la tio ns hi p Ma rk e t N e e d s Pr od uc t flo w s Fi na nc ia l a nd ser vi ce fl o w Pr oc ur e m e nt re q ui re m e nt s de ve lo p Pr od uc ts In no va tio n Ne e ds Loc al Pr od uc t Po rtf ol io Fi na nc ia l a nd S e rv ic e flo w pr o du ct s Loc al di st ri bu tion or der s Pr o du ct io n o rd e rs &F o re ca st s A lo c a l e n ti ty
3.1 Steps 1 and 2: decision and process models
From the temporal decomposition of the decisions (GRAI grid of Figure 7), six decision levels have been identified: political (new markets, shareholding, R&D or partnership decisions); business orientations (organisations, long-term investments, business plan decisions); strategic (medium-term investments, product developments, sales and operation planning decisions); tactical (short-term investments, sales supports, production plan decisions); operational (resource adjustment, scheduling and customer management decisions); real time (realisation and forwarding decisions). A strong coordination appears between the world and the local entities, at the ‘political’ and the ‘orientation’ levels only. However, local entities are independent of the other levels for their decision making.
At the political level, each decision centre designs the strategy associated to its function and only sends information to the other functions. At the « orientation » level, each decision centre must organise its processes and align the required means in order to put the chosen policy into action. At the strategic, tactical and operational levels, planning activities enable the coordination of sales with production and distribution.
During the second step, for each decision level of the GRAI grid, the decision makers formalise their vision of the operational processes in a SADT model. For each process, all the activities, inputs/outputs, resources and instructions were identified. If we consider the example of people in charge of the ‘business orientations’, they have identified four activities to describe, from their point of view, the physical level in the world and the local entities : to manage customer relationships, to make, and to develop products, and finally to distribute (see Figure 8).
3.2 Steps 3 and 4: PMS
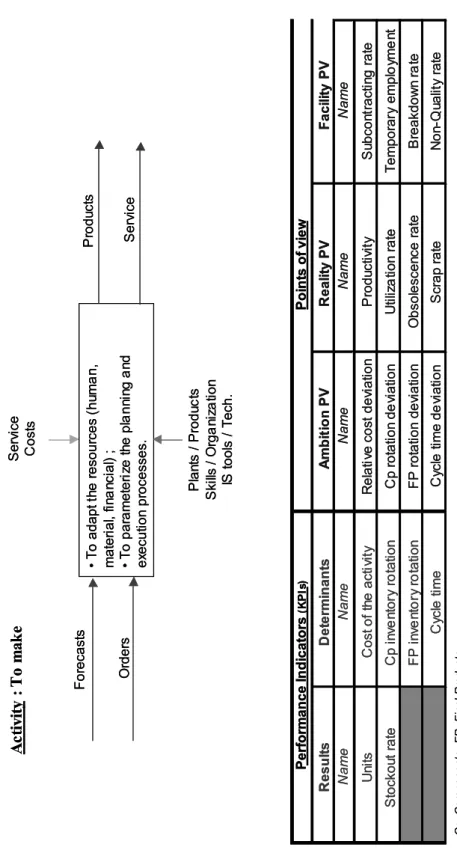
In this part, we consider the activity ‘to make’ viewed by the decision-makers of the ‘business orientations’ level (see Figure 9). Its inputs and outputs are those identified in Step 2. Kind of resources which are concerned by this activity are:
• material: production plants, production lines (engines and conditioning), elementary
components and raw materials;
• human: individual and collective skills, organisation (shifts, temporary employees…)
• supports: information systems and technical tools (quality control…).
Experts agreed that the determinants for this activity come from the decision centre ‘to make orientation in production’. The name of the activity can be replaced by the performance determinants:
• to formalise a strategic orientation of the means (human, financial and material): to
decide opening/closing-down of a production plant or a production line, to decide on a training plan and/or recruitment of particular skills, to contract with a provider, etc
• to adapt the planning and execution of processes: to revise the internal planning
procedures, to design a new rule to manage the inventories, to decide on an arbitration rule to manage priorities in case of stockout, etc.
Figure 9 KPIs and points of view of the ‘to make’ activity •T o a d a p tt he re so u rc e s (h um a n , ma te ri a l, f in a nc ia l) ; •T o p a ra m e te ri ze t he p la n ni ng a nd ex ec u tion p rocess e s. Pl a nt s / Pr o d uc ts Sk ill s / O rg a ni za tio n IS to o ls / T e ch . For e ca st s Pr o d uc ts Se rv ic e Co st s Or d e rs Se rv ic e Na m e Na m e Na m e Na m e Na m e Un its Co st o f th e a ct iv it y Re la ti ve c o st d e vi a tio n P ro d uc tiv it y Su b co nt ra ct in g r a te St o ck o ut r a te C p in ve nt o ry ro ta tio n Cp r o ta tio n d e vi a tio n U til iz a tio n ra te T e m p o ra ry e m p lo ym e nt FP in ve nt o ry r o ta tio n FP r ot at ion dev ia tion O bsol e sc en ce ra te B rea kdow n ra te Cy cl e t im e Cy cl e t im e d e vi a tio n S cr a p r a te No n-Q ua lit y ra te Pe rf o rm a n c e In d ic a to rs (K P Is ) Po in ts o f v ie w Fa c ili ty P V Re s u lt s De te rm in a n ts Am b it io n P V R e a lit y P V Ac ti vi ty : T o m ak e Cp : Co m po n en ts , F P : F in al P ro du ct s •T o a d a p tt he re so u rc e s (h um a n , ma te ri a l, f in a nc ia l) ; •T o p a ra m e te ri ze t he p la n ni ng a nd ex ec u tion p rocess e s. Pl a nt s / Pr o d uc ts Sk ill s / O rg a ni za tio n IS to o ls / T e ch . For e ca st s Pr o d uc ts Se rv ic e Co st s Or d e rs Se rv ic e Na m e Na m e Na m e Na m e Na m e Un its Co st o f th e a ct iv it y Re la ti ve c o st d e vi a tio n P ro d uc tiv it y Su b co nt ra ct in g r a te St o ck o ut r a te C p in ve nt o ry ro ta tio n Cp r o ta tio n d e vi a tio n U til iz a tio n ra te T e m p o ra ry e m p lo ym e nt FP in ve nt o ry r o ta tio n FP r ot at ion dev ia tion O bsol e sc en ce ra te B rea kdow n ra te Cy cl e t im e Cy cl e t im e d e vi a tio n S cr a p r a te No n-Q ua lit y ra te Pe rf o rm a n c e In d ic a to rs (K P Is ) Po in ts o f v ie w Fa c ili ty P V Re s u lt s De te rm in a n ts Am b it io n P V R e a lit y P V Ac ti vi ty : T o m ak e Cp : Co m po n en ts , F P : F in al P ro du ct s
The controls for the ‘to make’ activity are those expressed in the GRAI grid for ‘to make orientation on production’ by its leader, decision centre ‘production policy design’ (arc ). The objectives are to minimise the costs on the one hand, and to maximise the service level on the other hand. They are coherent with the outputs of the activity (manufactured items).
• Then, KPIs and points of view have been formulated on the basis of the existing
indicators (but now validated and contextualised), of best practices (SCOR model essentially) and complementary proposals. Figure 7 illustrates the result of this step. The use of the resources is constrained by financial means, and by those available, and allocated to this activity (both in the field of operations and investments). Finally, the performance indicators and the points of view that were defined with the supply chain experts are:
• Results indicators: product flows are followed-up both in term of number of units by
plant (measure of the total activity) and the stock out rate (measure of the service quality).
• Determinant indicators are the effective costs for adjusting resources
(subcontracting, investments, shifts, overtime, etc.) and measures of the process duration (inventory rotation of the final products and elementary components, total cycle time).
• Ambition point of view (bond between determinants and instructions): these
indicators measure the impact of the determinants (‘to adapt the resources’ and ‘to parameterise the processes’) on the objectives of costs and services. The indicators from this point of view measure the deviation between the objective of cost allocated to this activity and the reality of the costs (expressed in cash and in terms of covers of inventory rotation) engaged by the determinants of this activity. The objective of service is here translated in terms of cycle time of the whole manufacturing activity. Therefore, the ‘ambition’ indicators on service measure the relative variations in terms of cycle time of the activity.
• Reality point of view (bond between determinants and results) measures whether the
determinants are effectively used to make products for customers and particularly track non-value-adding activities. Four criteria are proposed and are associated either with the determinant ‘adaptability of the resources’ (complete orders delivered on time, obsolete units/total units) or with the determinant ‘to parameterise the processes’ (productivity in made units/day, returned units/total units).
• Facility point of view measures the appropriateness of resources to determinants.
Indicators depend on whether human or technical resources are under concern. With regard to human resources, the choice was to track the need for extra resources to run the process (temporary employees, subcontracting) measuring both the
underestimation of means and the need to activate the determinants. As regards technical resources, indicators measure the efficiency of the means (hours effectively used/hours available, non-quality rate).
The approach was repeated on all activities identified by functional modelling. Nearly 130 KPIs and 250 points of view were defined on the whole supply chain. While this number was high, the distinction between result, determinant and point of view indicators clarified the use of indicators by managers. Result indicators are mainly used for
reporting. Determinant indicators are used for analysing the coordination of functions, while points of view indicators are used to analyse the source of problems which have been detected using other indicators. These indicators have also been used to justify and select a set of projects in the organisation of the supply chain. In return, these projects forced changes to the models and consequently led to a reformulation of the indicators.
By this stage, indicators are considered as stable and Steps 5 and 6 are under implementation.
4 Conclusions
In this paper, we have shown how to define a PMS, in a supply chain context, that allows an explicit link to be established between decision and action at the network level. Our research has focussed on the definition of relevant KPIs in transverse business processes and on the development of an original framework to analyse supply chain performance more efficiently. Specifically, our contributions can be summarised as followed:
• identification of good practices according to PMS problem statement in supply chain
• following a control system analogy, design of a pertinent supply chain PMS oriented
towards decisional and operational processes, centred on the performance determinant concept and based on enterprise modelling methods
• proposal for three new axes of performance analysis: ambition, reality and facility
points of view
• application to a pharmaceutical supply chain.
The suggested method brings together the advantages of the principal existing methods that define PMS, and tries to add some specific points: a way of identifying causes of (non-) performance (points of view), practical tools to diagnose and define action plans in order to better manage supply chain processes. Finally, our proposal helps to identify problems and opportunities and to formulate solutions. With this proposal, we respond to one of the new needs for performance evaluation identified by Gunasekaran et al. (2005).
Given that we have applied them to only one case, we have not performed a complete verification of the suggested methods, and thus three axes of complementary research now need to be performed:
• The appropriation of the model by the practitioners. If companies today, by using
this approach, find one of the tools that will enable them to control their supply chain processes better, we need to examine the real capacity of our proposal to adapt to the rapid changes in their contexts and organisations.
• The implementation supposes that the SCM integrates the concept of performance
management. This does not necessarily apply in today’s companies (especially in the pharmaceutical world). Such integration certainly generates significant changes in processes and in organisations. This must be taken into consideration during the implementation process.
• Our study was started on the major assumption that the system under study was
already established. One should now consider extensions, integrating the possibility of (re)designing the whole or part of the system, in terms of organisation or of process definition.
References
Akkermans, H.A. and Van Oorschot, K.E. (2005) ‘Relevance assumed: a case study of balanced scorecard development using system dynamics’, Journal of the Operational Research Society, No. 56, pp.931–941.
Akyuz, G.A. and Erkan, T.E. (2010) ‘Supply chain performance measurement: a literature review’,
International Journal of Production Research, Vol. 48, No 17, pp.5137–5155, Vl.
Alfaro, J.J., Rodriguez-Rodriguez, R., Verdecho, M.J. and Ortiz, A. (2009) ‘Business process interoperability and collaborative performance measurement’, International Journal of
Computer Integrated Manufacturing, Vol. 22, No. 9, pp.877–889.
Al-Mudimigh, A.S., Zairi, M. and Ahmed, A.M.M. (2004) ‘Extending the concept of supply chain: the effective management of value chains’, International Journal of Production Economics, No. 87, pp.309–320.
Beamon, B.M. (1999) ‘Measuring supply chain performance’, International Journal of Operations
and Production Management, Vol. 19, No. 3, pp.275–292.
Bolstorff, P. (2002) ‘How does SCOR measure up?’, Supply Chain Technology News, pp.22–25, available at http://www.totalsupplychain.com.
Bourne, M., Neely, A., Mills, J. and Platts, K. (2003) ‘Implementing performance measurement systems literature review’, International Journal of Business Performance Management, Vol. 5, No. 1, pp.1–24.
Bowersox, D.J. and Closs, D.J. (1996) ‘Logistical management’, The Integrated Supply Chain
Process’, McGRaw-Hill.
Chan, F.T.S. and Qi, H.J. (2003) ‘Feasibility of performance measurement system for supply chain: a process-based approach and measures’, Integrated Manufacturing System, Vol. 14, No. 3, pp.179–190.
Chan, F.T.S., Chan, H.K. and Qi, H.J. (2006) ‘A review of performance measurement systems for supply chain management’, International Journal of Business Performance Management, Vol. 8, Nos. 2–3, pp.110–131.
Chow, G., Heaver, T.D. and Henriksson, L.E. (1994) ‘Logistics performance: definition and measurement’, International Journal of Physical Distribution & Logistics Management, No. 24, pp.17–28.
Cokins, G. (2001) ‘Activity-based cost management: an executive’s guide’, p.384, 2nd ed., John Wiley Sons Inc. Publisher.
Ducq, Y., Vallespir, B. and Doumeingts, G. (2001) ‘Coherence analysis methods for production systems by performance aggregation’, International Journal of Production Economics, No. 69, pp.23–37.
Folan, P. and Browne, J. (2005) ‘A review of performance measurement: towards performance management’, Computers in Industry, Article in Press.
Forrester, J.W. (1968) Principles of Systems, p.391, 2nd ed., Productivity Press, Portland, OR. Ghalayini, A.M., Noble, J.S. and Crowe, T.J. (1997) ‘An integrated dynamic performance
measurement system for improving manufacturing competitiveness’, International Journal of
Production Economics, Vol. 48, Nos. 1–2, pp.44–45.
Gunasekaran, A. and Kobu, B. (2007) ‘Performance measures and metrics in logistics and supply chain management: a review of recent literature (1995–2004) for research and applications’,
International Journal of Production Research, No. 45, pp.2819–2840.
Gunasekaran, A., Patel, C. and McGaughey, R.E. (2004) ‘A framework for supply chain performance measurement’, International Journal of Production Economics, No. 87, pp.333–347.
Gunasekaran, A., Williams, J.H. and McGaughey, R.E. (2005) ‘Performance measurement and costing system in new enterprise’, Technovation, No. 25, pp.523–533.
Jacot, J.H. (1990) A Propos de l’évaluation Économique des Systèmes Intégrés de Production, ECOSIP – Gestion industrielle et mesure économique, Economica.
Kaplan, R.S. and Norton, D.P. (1996) The Balanced Scorecard: Translating Strategy into Action, Harvard Business School Press, Boston.
Kleijnen, J.P.C. and Smits, M.T. (2003) ‘Performance in supply chain management’, Journal of the
Operational Research Society, No. 54, pp.507–514.
Kueng, P. (2000) ‘Process performance measurement system: a tool to support process-based organizations’, Total Quality Management, Vol. 11, No. 1, pp.67–85.
Lee, H.L. (2000) ‘Creating value through supply chain integration’, Supply Chain Management
Review.
Lohman, C., Fortuin, L. and Wouters, M. (2004) ‘Designing a performance measurement system: a case study’, European Journal of Operation Research, No. 156, pp.267–286.
Lohman, F.A.B. (1999) The Effectiveness of Management Information, PhD Thesis, Delft University.
Martin, P.R. and Patterson, J.W. (2009) ‘On measuring company performance within a supply chain’, International Journal of Production Research, Vol. 47, No. 9, pp.2449–2460.
Neely, A.D., Adams, C. and Kennerley, M. (2002) ‘The performance prism: the scorecard of measuring and managing business success’, Pearson Education, p.377.
Neely, A.D., Gregory, M. and Platts, K. (1995) ‘Performance measurement system design’,
International Journal of Operations & Production Management, No. 15, pp.80–116.
Neely, A.D., Mills, J., Platts, K., Gregory, M. and Richards, H. (1996) ‘Performance measurement system design: should process-based approach be adopted?’, International Journal of
Production Economics, Vol. 46–47, pp.423–431.
Neubert, G. and Pichot, L. (2002) ‘Performance measurement for the supply chain: methodology to define a supply chain dashboard’, ACS’02 – SCM Conference, October, Poland.
Smith, P. and Goddard, M. (2002) ‘Performance management and operational research: a marriage made in heaven?’, Journal of the Operational Research Society, No. 53, pp.247–255.
Stadtler, H. and Kilger, C. (2000) Supply Chain Management and Advanced Planning, p.371, Edition Springer-Verlag.
Supply Chain Council (2003) Supply Chain Operations Reference-Models – SCOR version 6.0, p.278, Edition Supply Chain Council.
Vitale, M., Mavrinac, S.C. and Hauser, M. (1994) ‘New process/financial scorecard: a strategic performance measurement system’, Planning Review, Vol. 22, No. 4, pp.12–16.