HAL Id: hal-02902465
https://hal.archives-ouvertes.fr/hal-02902465v2
Submitted on 20 Oct 2020
HAL is a multi-disciplinary open access
archive for the deposit and dissemination of
sci-entific research documents, whether they are
pub-lished or not. The documents may come from
teaching and research institutions in France or
abroad, or from public or private research centers.
L’archive ouverte pluridisciplinaire HAL, est
destinée au dépôt et à la diffusion de documents
scientifiques de niveau recherche, publiés ou non,
émanant des établissements d’enseignement et de
recherche français ou étrangers, des laboratoires
publics ou privés.
Visual analytics of bitcoin mining pool evolution : on the
road toward stability?
Natkamon Tovanich, Nicolas Soulié, Petra Isenberg
To cite this version:
Natkamon Tovanich, Nicolas Soulié, Petra Isenberg. Visual analytics of bitcoin mining pool evolution :
on the road toward stability?. 3rd International Workshop on Blockchains and Smart Contracts (BSC
2020-2021), held in conjunction with the 11th IFIP International Conference on New Technologies,
Mo-bility and Security (IFIP NTMS 2021), Apr 2021, Paris, France. �10.1109/NTMS49979.2021.9432675�.
�hal-02902465v2�
Visual Analytics of Bitcoin Mining Pool Evolution:
On the Road Toward Stability?
Natkamon Tovanich
IRT SystemX and Universit´e Paris-Saclay, CNRS, Inria, LRI
Palaiseau, France
Nicolas Souli´e
Universit´e Paris-Saclay, Univ Evry, Institut Mines-T´el´ecom Business School, LITEM
Evry-Courcouronnes, France [email protected]
Petra Isenberg
Universit´e Paris-Saclay, CNRS, Inria, LRI Orsay, France [email protected]Abstract—We present our work on visual analytics tools to support the analysis of Bitcoin mining pool evolution. Mining blocks are a critical component of the Bitcoin ecosystem, helping to keep the system secure, valid, and stable. At the same time, mining is a resource-intensive activity that continues to get more and more difficult. Mining pools have emerged to address this issue and to ensure a more stable and predictable income by sharing computing power. Yet, increased centralization of the mining power is also not without dangers (e. g., the 51% attack), and, thus, it is important to better understand and analyze mining pool activities in Bitcoin. Here, we report three contributions: our extensive data collection on Bitcoin mining pools, our development of two custom visualizations, and our first exploratory data analysis leading to hypotheses and documented activities about pools’ main features such as market share, reward rules, or location.
Index Terms—Bitcoin, Mining pools, Visual analytics.
I. INTRODUCTION
The sharp increase of Bitcoin’s value has attracted great attention on cryptocurrencies and their underlying technology, the Blockchain. In the Bitcoin ecosystem, miners are major actors from cryptographic as well as economic viewpoints. Miners ensure the validity and security of the Blockchain, which is fundamental for people’s trust in the cryptocurrency. Mining is a computing and energy-intensive activity that is re-warded by newly created bitcoins in case of successful mining [1]. While this incentive scheme is fundamental for a proper functioning and growth of Bitcoin, the required resources and unpredictability of mining success has led miners to join their resources in pools. Mining pools gather the mining power of all members to maximize the probability of successful mining, and so, expected rewards [2]. However, concentration of mining power in the hands of very few pools raises security issues, such as an increased likelihood of a 51% attack [3]. Despite the potential danger, mining pools have grown steadily and become critical supporters of the Bitcoin ecosystem.
Understanding the sustainability of the organization of min-ing activities in pools is critical to assess the future of Bitcoin, and more generally, of blockchain-based technology. A major component of the sustainability of mining systems is the eco-nomic efficiency of pools. Yet, it is always difficult to assess the efficiency of an organization. In a competitive context, the stability of organizations that operate on a market tends to
illustrate their relative efficiency. In our case, the stability of mining pools and their distributions can illustrate the efficiency of the system. If new pools easily enter the market, they generate visible turbulence in the system and indicate that the mining ecosystem is not yet efficiently working.
In this article, we make three contributions: (a) we con-tribute an extensive data collection on Bitcoin mining, (b) we developed custom visualizations dedicated to analyzing the emergence and evolution of mining pools from our data, and (c) we report on findings from our first exploratory analysis using our data and visualizations. Our exploratory analysis shows that mining pools tend to converge toward a limited set of configurations (reward rule, location, hash rate, etc.). In particular, we show that mining market share distributions have become more stable across time and are now operated by a few numbers of pools. Moreover, pools have converged towards a main specific reward payout rule called Pay-Per-Share (PPS). Concerning the geographic location of mining pools, historically, the dominant pools have been hosted in China but tend now to become more globally operated. All this evidence suggests that mining activities have undergone a rationalization process and might currently provide a solid foundation for the stability of the Bitcoin ecosystem.
II. RELATEDWORKS
As mining is central to how Bitcoin and other cryptocurren-cies work, researchers have started to analyze it more closely. Much of the research on Bitcoin mining and mining pools is theoretical in nature and focuses on analyzing reward rules [2], [4], [5], mining strategies [6], [7], and attacks [3], [8]–[10].
Yet, empirical analyses on mining pools have also recently emerged. Wang and Liu [11] provided evidence that the top mining pools became larger as the hash rate grew exponen-tially between Mar. 2013 and Mar. 2014. The authors analyzed the profit of mining regarding hardware cost and electricity price and concluded that the profit became negative when the hash rate increased faster than the Bitcoin price. Romiti et al. [12] analyzed the distribution of mining pools from Dec. 2013 to Dec. 2018 and found that 3–4 mining pools controlled >50% of the hash rate. The authors further analyzed the reward payout among the top-3 mining pools and found that a small number of members received a total of >50%
of the reward from the pool. In addition, the authors detected cross-pool miners who received rewards from multiple mining pool and provided evidence that miners tend to transfer their rewards to exchange services and wallet providers. Wang et al. [13] analyzed the daily hash rate of the top mining pools from Feb. 2016 to Jan. 2019. They found that mining pools increased their hash rate exponentially in order to maintain their market share. Mining pools were caught in the Prisoner’s Dilemma—if they increase their hash rate to compete with other pools their mining profit diminishes. Finally, Wang et al.’s data confirmed that pools tended to collect transactions that gave large transaction fees to maximize their profit.
Instead of focusing on just a few mining pools and a limited timeframe, our work allows to study mining pool distribution more broadly using a number of different parameters. As such, our work has some overlap with previous works (e. g., Romiti et al.’s study of mining pool distribution) but also extends the work with custom visualizations that show not only the distributions but also help to detect changes in the mining pool ranks over time. We also provide a first exploratory analysis of the evolution of reward rules and locations which has not been studied in previous empirical works. Our results provide new information toward more realistic theoretical models of the Bitcoin mining organization.
III. DATADESCRIPTION
To analyze the evolution of Bitcoin mining over time, we collected coinbase transactions (the first transaction in each block) from the Bitcoin genesis block (the first ever mined block) until the last block mined in 2019. From the coinbase transactions, we extracted a number of different metrics as described next. We also collected monthly Bitcoin statistics from Blockchain.info and historic data about mining pools from the Bitcoin Wiki to give context to the mining activity. A. Mining pool reward distribution
We tagged each coinbase transaction we collected with one mining pool (or “unknown”) based on the data from Romiti et al. [12] who collected and manually resolved pool names from various sources (i. e. Blockchain.info, BTC.com, and Blocktrail.com). For each transaction we calculated a mining reward as the summation of the pre-defined block reward and the variably assigned transaction fees for the block. We converted the mining reward from Bitcoin currency to US Dollar using the daily market price data from Blockchain.info. Finally, we aggregated the number of blocks and mining rewardsfor each mining pool per month and calculated each pool’s market share—the percentage of blocks mined by the pool compared to the total blocks in the month.
B. External mining pool data
Some important information about mining pools is not available for extraction from the Bitcoin blockchain. For example, data on reward payout schemes (how are reward payments distributed to members), mining pool locations, or fees are specific to how each pool operates. To obtain
additional information, we collected tabular data available in the Bitcoin Wiki1. The wiki maintains an overview table of mining pools that includes information regarding pool name, location, size, reward type, transaction fees, among others. The table is maintained by the community and regularly changed. We crawled the editing history of the construct panel table about mining pools. We simplified the panel data to monthly granularity using the most recent edit for each month. For the mining pools that did not exist in the table, we manually searched for information from the pool’s website and mining pool comparison articles from the internet2. The reward rules are categorized into main groups (see Fig. 2). The location of mining pools are grouped by continent-level (see Fig. 3). We defined “global” for pools that operated in more than two continents and kept China separately.
Finally, we collected Bitcoin statistics on hash rate and min-ing difficulty, transactions (number per block, mempool size, etc.), and market price from Blockchain.info and aggregated the data to obtain averages for each month.
IV. VISUALANALYTICS OFBITCOINMININGPOOLS
We built two custom visualizations to analyze mining pool evolution based on a user-centered design process. In this process two computer scientists collaborated closely with an economist (all authors of this paper). We identified design requirements and goals and iteratively revised prototype vi-sualization designs. The two main analysis tasks we identified in the process are centered on: (1) the emergence and evo-lution of mining pool market shares and (2) external factors influencing the evolution of mining pool market shares and their distribution.
A. Visualizing the emergence and evolution of mining pool market shares
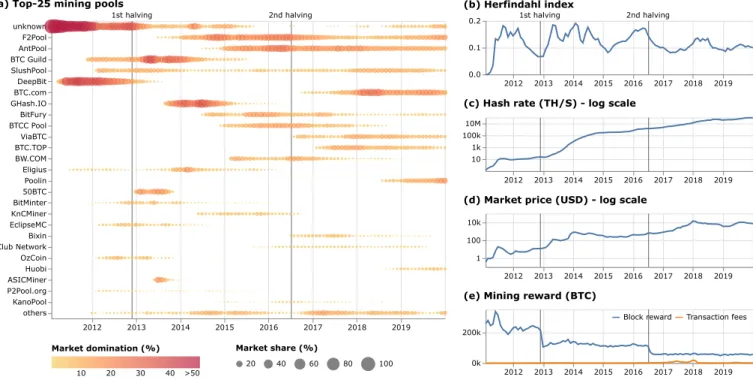
In order to learn when mining pools started to gain market share and which pools dominated the market over time, we focused our first visualization on temporal mining activity. Fig. 1 (a) provides information on the historic evolution of the top 25 mining pools based on the average market share over the entire period. This visualization allows the viewer to see an overview of active mining pools row-by-row. For each mining pool, we see when it started to mine blocks, how it accumulated or lost mining power, and whether it stopped its operations. For each pool and each month in the timeline, we draw a circle representing its market share and use a heated color scale to represent mining power domination (0%–>50%) to highlight the pools that were likely to dominate the Bitcoin network at a time. We chose this representation over a simple heat map alternative because it allows us to represent two quantitative variables.
1https://en.bitcoin.it/wiki/Comparison of mining pools
2e. g., https://www.cryptocompare.com/mining/#/pools and https://www.
2012 2013 2014 2015 2016 2017 2018 2019 unknown F2Pool AntPool BTC Guild SlushPool DeepBit BTC.com GHash.IO BitFury BTCC Pool ViaBTC BTC.TOP BW.COM Eligius Poolin 50BTC BitMinter KnCMiner EclipseMC Bixin BitClub Network OzCoin Huobi ASICMiner P2Pool.org KanoPool others 10 20 30 40 >50 Market domination (%) (a) Top-25 mining pools
2012 2013 2014 2015 2016 2017 2018 2019 0.0 0.1 0.2 (b) Herfindahl index 2012 2013 2014 2015 2016 2017 2018 2019 10 1k 100k 10M
(c) Hash rate (TH/S) - log scale
2012 2013 2014 2015 2016 2017 2018 2019 1
100 10k
(d) Market price (USD) - log scale
2012 2013 2014 2015 2016 2017 2018 2019 0k
200k
(e) Mining reward (BTC)
Block reward Transaction fees
20 40 60 80 100
Market share (%)
1st halving 2nd halving 1st halving 2nd halving
Fig. 1. (a) The emergence and evolution of the top 25 mining pools. The figure shows the market share of each mining pool as the size of the circle over time. The color scale encodes the mining power domination in the Bitcoin network from no domination (0% mining power) in yellow to completely domination (>50%) in red. Two grey vertical lines in both charts indicates two halving days on Nov. 28, 2012 and Jul. 9, 2016. (b) The Herfindahl index measures the concentration of mining pools in the Bitcoin network. (c-e) Bitcoin mining statistics data from Blockchain.info. (c) Total hash rate in tera hashes per second. (d) Average market price in US Dollar. (e) Total mining reward in Bitcoin currency divided into block reward (blue line) and transaction fees (orange line).
B. Visualizing external factors influencing the evolution of mining pool market shares and their distribution
Understanding when and why mining pool market shares change is important to understanding the broader mining ecology in Bitcoin. To address this analysis challenge, our sec-ond visualization presents the temporal distribution of mining pools in connection to the panel data we collected (reward rules, location, etc.). Fig. 2 and 3 show the temporal evolution of reward rules and pool locations weighted by pools’ market shares. For the visualization, we used a ribbon chart design— a stacked bar chart showing a quantitative measurement over time with ribbons connecting the same data category. Each mining pool is represented as a bar whose height is relative to the pool’s market share in a month and the color indicates categorical data (i. e. mining pool, reward rule, or location). For each month, the bars are sorted by the total market share of the category from the highest to the lowest value and within each category pools are sorted by their market shares. This sorting helps us to identify large mining pools or categories that dominated mining power. Ribbons help to track a mining pool’s ranking connection between months. In contrast to our first visualization, here, we can see overall distributions and detect the top mining pools while the first visualization is better for observing the development of individual pools.
V. FINDINGS: MAIN TRENDS IN MINING POOL EVOLUTION
Next, we highlight exploratory findings we made using the visualizations we created. In particular, we saw that mining
has undergone important changes from its beginning to the way people engage in it currently. Three main characteristics allow to highlight different stages of mining pool evolution: market share concentration, reward rules, and location. A. Mining pool market share
In economy, considering the evolution of market share distributions gives a good overview of an activity’s stability. The analysis is typically done through longitudinal studies of the market concentration index. Beyond economic interests, the question of mining activity concentration in Bitcoin is important to understand potential security issues (consensus manipulation). The Herfindahl index3provides a basic measure of the concentration of an activity or market. This aggregated measure does not, however, provide information about the cause of index variation. Fig. 1 mitigates this drawback by combining the Herfindahl index with the market share of each mining pool, allowing for more relevant analysis of the mining market evolution.
Until 2011, most mining activities were performed by small independent miners following Bitcoin’s original spirit4. The
3Herfindahl index (H) in Fig. 1 (b) is computed on a monthly basis. For
each month, let’s n be the number of active mining pools and xipool i market
share (i. e. the number of blocks mined by pool i divided by total number of blocks found in the month), then: H =Pn
i=1x2i. H is equal to 1 for
perfectly concentrated market and converges toward 0 for very fragmented ones.
4It is known that some pools existed between 2009 and 2011, however they
2011-01 2011-07 2012-01 2012-07 2013-01 2013-07 2014-01 2014-07 2015-01 2015-07 2016-01 2016-07 2017-01 2017-07 2018-01 2018-07 2019-01 2019-070 10 20 30 40 50 60 70 80 90 100 Market shar e (%) Reward rule unknown PPS PPS+ PPLNS Score PPS/Prop CPPSRB DGM/PPS SMPPS DGM DGM/PoT/PPS others
Fig. 2. Ribbon chart of market share distribution according to reward rules. Each bar represents the market share of a mining pool while its color stands for a specific reward. The stacked bars are sorted monthly by the total market share of each reward rule and by the market share of the mining pools within each group. The legend on the right is sorted by the market share over the entire period. The red horizontal line indicates a 50% mining power threshold.
mining market was then very fragmented as illustrated by the Herfindahl index close to 0 (Fig. 1 (b)). According to our data, four cycles of concentration of market share can be observed. All these cycles are associated with a rise of bitcoin’s value, as investments in mining hardware are indeed strongly correlated with bitcoin’s value [14]. By increasing the expected revenue of mining, a rise of bitcoin value gives an incentive to miners to enhance their investments and might also attract new miners into pools [13]. A primary cycle of concentration started mechanically in the early 2011 with the emergence of first large and identifiable pools, namely DeepBit and Eligius. This rise got amplified by the increase of DeepBit’s hash power during the first peak of bitcoin’s value that occurred in Jul. 2011. At this moment bitcoin’s value reached more than $30, compared to roughly $1 few months ago. The growing expected revenue gained from mining lead probably miners to create new large pools such as BTCGuild and SlushPool. The emergence of these two pools participated to the rise of market share concentration until the beginning of 2012. The second cycle began in 2013. Two peaks occurred in Apr. and Nov., during which bitcoin’s value respectively reached more than $260 and $1,200. During this period, existing pools increased their hash power (e. g., BTCGuild, SlushPool or 50BTC), and new pools experienced significant growth (F2Pool and GHash.IO), especially in 2014. After the decrease of bitcoin’s value in 2015, the market price raised again and reached peaks at roughly $450 in Dec. 2015 and even $750 in Jun. 2016. During this period, F2Pool and AntPool increased largely their hash power. Newly created pools (Bitfury, BTCC Pool, and BW.COM) also enhanced their hash rate. The fourth cycle was driven by the sharp rise of Bitcoin market price at the end of 2017. Most existing large pools, and in particular BTC.com and AntPool, increased their hash rates. Both pools are owned by BitMain, the Chinese Bitcoin mining hardware manufacturer.
It is noticeable that the four cycles have a decreasing ampli-tude along time, indicating that the market might progressively reach an equilibrium situation. This is due to the exponential
increase of hash power which involves very large investment for an incumbent or a new pool to get a significant market share. Since mid-2018, the concentration of mining activities has been rather stable, with 4 main pools accounting each for 10% or more of market share: F2Pool, AntPool, BTC.com, and Poolin.
B. Reward rules and location
Another striking evidence of the rationalization of min-ing lies in the evolution of reward rules applied by pools. A wide variety of reward rules exist ranging from simple methods (Proportional (Prop.), Pay-Per-Share (PPS), etc.) to more complex ones (Double Geometric Method (DGM), etc.) [4]. This rule variety leaves rooms for strategic decisions by pool managers in order to adopt a reward scheme that attracts miners and makes them behaving loyally, e. g., to avoid block withholding, multi-pooling or pool hopping [2], [15]. Ribbon charts are useful tools to observe the evolution of an organizational feature such as reward rules. In Fig. 2, we can observe a large heterogeneity of applied reward rules until 20165. Progressively, two rewards schemes became dominant patterns with PPS and PPS+ (i. e. PPS for block rewards and PPLNS for transaction fees in most cases). Compared to proportional schemes (Prop., Score, etc.), PPS and PPS+ are less favorable to block withholding [2] and offer resistance to pool-hopping [15]. These reward rules seems to provide an attractive and stable incentive scheme for miners. Pools using PPS or PPS+ can differ however in the fee they apply on reward and transaction fees.
Fig. 3 shows the large evolution in mining pool locations. Until 2015, most pools were located in Europe and the US. The rapid growth of two important Chinese pools (F2Pool and AntPool) profoundly modified this landscape and made China the largest pool hosting nation from 2015 to 2018. According to Hileman and Rauchs [16], cheap electricity and land costs in remote Chinese areas (e. g., Sichuan) are major
5For detailed descriptions of the reward rules, see: https://en.bitcoin.it/wiki/
2011-01 2011-07 2012-01 2012-07 2013-01 2013-07 2014-01 2014-07 2015-01 2015-07 2016-01 2016-07 2017-01 2017-07 2018-01 2018-07 2019-01 2019-070 10 20 30 40 50 60 70 80 90 100 Market shar e (%) Location China Europe unknown Global America, Europe America America, China Asia Asia, Europe
Fig. 3. Ribbon chart of market share distribution according to mining pool locations. Each bar represents the market share of a mining pool while its color stands for a location. The stacked bars are sorted monthly by the total market share of each location and by the market share of the mining pools within each group. The legend is sorted by the market share of each location over the entire period. The red horizontal line indicates a 50% mining power threshold.
drivers of this location pattern. Between Mar. 2015 and Feb. 2017, the combination of Chinese pools exceeded 51% mining power threshold and therefore posed the risk of majority attack. This situation persisted until 2019 when global pools became dominant. This growth resulted from both the growth of originally global pools (BTC.com and Poolin), and also from Chinese or European pools that turned into global ones (F2Pool and SlushPool).
VI. DISCUSSION ANDCONCLUSION
Mining pools are the heart of the Bitcoin ecosystem’s security and growth. Their evolution toward rational and stable organizations is critical for Bitcoin’s future. Using visual analytics approaches, we collected and joined a large number of datasets about mining pools and developed two custom visualizations to investigate their evolution according to a number of different parameters. In particular, we combined the aggregated measure of market share with pool-level informa-tion across time. Our representainforma-tions allow us to document the rise of mining activity concentration and give rise to insights and further hypotheses as to the cause of this evolution. Important events regarding mining activity profitability (e. g., halving days and bitcoin value) seem to be major drivers of changes to the Bitcoin ecosystem.
We found the use of ribbon charts insightful to show two other important trends regarding pool organization. First, we can observe the rise of PPS and PPS+ as the main reward rules used by pools. These rules seem to provide attractive and stable incentives for miners. Secondly, ribbon charts are very useful to highlight the emergence of China as the main hosting country for pools and show that global pools have become dominant in recent times. These findings raise questions worth further examination, in particular regarding factors that stimulate the stability of Bitcoin mining.
The visualizations we developed are relatively simple but already provide first useful tools for people who want to analyze the evolution of mining pools by highlighting relevant elements that affect these organizations. We are working on
a more encompassing visualization tool to help economists develop a more realistic model of Bitcoin mining.
REFERENCES
[1] R. B¨ohme, N. Christin, B. Edelman, and T. Moore, “Bitcoin: Economics, technology, and governance,” J. Econ. Perspectives, vol. 29, no. 2, pp. 213–238, 2015.
[2] O. Schrijvers, J. Bonneau, D. Boneh, and T. Roughgarden, “Incentive compatibility of bitcoin mining pool reward functions,” in Proc. Int. Conf. Financial Cryptography and Data Secur. Springer, 2017, pp. 477–498.
[3] I. Eyal and E. G. Sirer, “Majority is not enough: Bitcoin mining is vulnerable,” in Proc. Int. Conf. Financial Cryptography and Data Secur. Springer, 2014, pp. 436–454.
[4] M. Rosenfeld, “Analysis of bitcoin pooled mining reward systems,” arXiv preprint arXiv:1112.4980, 2011.
[5] B. Fisch, R. Pass, and A. Shelat, “Socially optimal mining pools,” in Proc. Int. Conf. Web and Internet Econ. Springer, 2017, pp. 205–218. [6] N. Houy, “The bitcoin mining game,” Ledger, vol. 1, pp. 53–68, 2016. [7] Y. Lewenberg, Y. Bachrach, Y. Sompolinsky, A. Zohar, and J. S. Rosenschein, “Bitcoin mining pools: A cooperative game theoretic analysis,” in Proc. Int. Conf. Auton. Agents and Multiagent Syst. ACM, 2015, pp. 919–927.
[8] J. A. Kroll, I. C. Davey, and E. W. Felten, “The economics of bitcoin mining, or bitcoin in the presence of adversaries,” in Proc. Workshop Econ. of Inf. Secur., vol. 2013, 2013, p. 11.
[9] B. Johnson, A. Laszka, J. Grossklags, M. Vasek, and T. Moore, “Game-theoretic analysis of ddos attacks against bitcoin mining pools,” in Proc. Int. Conf. Financial Cryptography and Data Secur. Springer, 2014, pp. 72–86.
[10] A. Laszka, B. Johnson, and J. Grossklags, “When bitcoin mining pools run dry,” in Proc. Int. Conf. Financial Cryptography and Data Secur. Springer, 2015, pp. 63–77.
[11] L. Wang and Y. Liu, “Exploring miner evolution in bitcoin network,” in Proc. Int. Conf. Passive and Active Netw. Meas. Springer, 2015, pp. 290–302.
[12] M. Romiti, A. Judmayer, A. Zamyatin, and B. Haslhofer, “A deep dive into bitcoin mining pools: An empirical analysis of mining shares,” arXiv preprint arXiv:1905.05999, 2019.
[13] C. Wang, X. Chu, and Q. Yang, “Measurement and analysis of the bitcoin networks: A view from mining pools,” arXiv preprint arXiv:1902.07549, 2019.
[14] J. Prat and B. Walter, “An equilibrium model of the market for bitcoin mining,” CESifo Working Paper Series 6865, 2018.
[15] M. Belotti, S. Kirati, and S. Secci, “Bitcoin pool-hopping detection,” in Proc. IEEE Int. Forum Res. and Technol. for Soc. and Ind., 2018. [16] G. Hileman and M. Rauchs, “Global cryptocurrency benchmarking