HAL Id: hal-01802449
https://hal-mines-albi.archives-ouvertes.fr/hal-01802449
Submitted on 7 Nov 2019
HAL is a multi-disciplinary open access
archive for the deposit and dissemination of
sci-entific research documents, whether they are
pub-lished or not. The documents may come from
teaching and research institutions in France or
abroad, or from public or private research centers.
L’archive ouverte pluridisciplinaire HAL, est
destinée au dépôt et à la diffusion de documents
scientifiques de niveau recherche, publiés ou non,
émanant des établissements d’enseignement et de
recherche français ou étrangers, des laboratoires
publics ou privés.
Structuring of Batch Mixer Loading to Improve Mixing
Time and Mixture Quality of Solids
Vadim Mizonov, Ivan Balagurov, Henri Berthiaux, Cendrine Gatumel
To cite this version:
Vadim Mizonov, Ivan Balagurov, Henri Berthiaux, Cendrine Gatumel. Structuring of Batch Mixer
Loading to Improve Mixing Time and Mixture Quality of Solids. Chemical Engineering and
Technol-ogy, Wiley-VCH Verlag, 2018, 41 (8), �10.1002/ceat.201700505�. �hal-01802449�
Structuring of Batch Mixer Loading
to Improve Mixing Time and Mixture
Quality of Solids
A simple yet informative model was built to estimate the influence of the initial
distribution of dissimilar particulate solids to be mixed on the mixing time and
mixture quality, and a way was searched to reduce the negative influence of
segre-gation on the mixing process. The influence of segresegre-gation is particularly strong
when it is necessary to mix a small amount of a key component with a large
amount of a basic one. It is shown that the mixing time and mixture quality can
be noticeably improved by introducing a premixing stage that consists in loading
the key component in layers distributed over the basic component. A possible
technical solution for such loading is also proposed. Experimental tests of such
lab-scale vibration mixer proved its efficiency.
Keywords: Markov chain, Mixing kinetics, Mixing of solids, Multilayer loading, Segregation
1
Introduction
The tendency of dissimilar particulate solids to segregate into one another is one of the most important restrictions for obtaining their homogeneous mixture. For instance, in a mix-ture of fine and coarse particles, the fine particles experience the downward segregation and the coarse particles experience the upward segregation. This counteracts the diffusion mixing, and it appears impossible to reach the homogeneous mixture. The negative influence of segregation becomes particularly important when it is required to mix a small amount of a key downward segregating component with a large amount of a basic one. Placed on top of the basic component at the begin-ning of the process, it simply travels downward with more or less slight dispersion that occurs due to diffusion mixing. First the mixture homogeneity increases, then it reaches its maxi-mum, and then it decreases again until the key component resurfaces at the bottom of the mixing chamber.
In addition to purely technical problems that it creates, the phenomenon of segregation makes the mixing process rather difficult for predictive modeling and calculation. Not without reason, Bridgwater [1, 2] emphasized ‘‘the difficulty of design-ing and operatdesign-ing the mixdesign-ing process, which is largely based on judgment rather than science’’. There have been a number of studies, mostly experimental, on the influence of the segrega-tion effect on mixture quality [3–5]. However, the effect of seg-regation on the mixing kinetics has received less attention. The elements of analysis of a mixture initial state influence were described by Barcz et al. [6]. However, this research only addressed the influence of the initial bed height. The effect of initial distribution of the components to be mixed has virtually never been investigated either theoretically or experimentally.
The initial distribution is usually taken from the practice of mixing: the basic component is loaded to the bottom of the mixing chamber, and the downward segregating key compo-nent is loaded on top of it.
In order to estimate the influence of initial distribution of downward segregating component on mixing kinetics, one must have an appropriate mathematical model. According to the authors’ viewpoint, one of such models is the cell model based on the theory of Markov chains. The general strategy of applying the theory of Markov chains to modeling different processes in powder technology was described by Berthiaux et al. [7]. Later on, the authors generalized this approach to more detailed modeling of mixing kinetics. Using this approach, Mizonov et al. [8] theoretically investigated a few novel ways to minimize the negative influence of segregation in mixing of particulate solids. In the paper by Mizonov et al. [9], the model was generalized to the case of ternary mixture of dis-similar particulate solids and verified experimentally. However, in these and other papers, the influence of components’ initial distribution was not included into objectives of the study. Thus, this problem of mixing science and technology remains unin-vestigated. Its detailed theoretical and experimental study is the objective of the present paper.
Vadim Mizonov1,*
Ivan Balagurov1
Henri Berthiaux2 Cendrine Gatumel2
–
1Prof. Vadim Mizonov, Ivan Balagurov
Ivanovo State Power Engineering University, Department of Applied Mathematics, Rabfakovskaya 34, 153003 Ivanovo, Russia.
2Prof. Henri Berthiaux, Dr. Cendrine Gatumel
Ecole des Mines d’Albi-Carmaux, Centre RAPSODEE, UMR CNRS 5302, Campus Jarlard, route de Teillet, 81000 Albi, France.
2
Theoretical Studies
2.1 Cell Model of Mixing KineticsThe model is related to a binary mixture of dissimilar particu-late solids. Its structure is based on the approach described in [7]. The scheme of the cell model is presented in Fig. 1. The total height of the mixing chamber is separated into m1)
per-fectly mixed cells of the height Dx. It is assumed that the only difference between the components that leads to segregation is their size. Index 1 is assigned to the fine fraction and index 2 to the coarse one. The process is observed at discrete moments of time tk= (k –1)Dt, where Dt is the time step, or transition
dura-tion, and k is the transition number, which can be interpreted as the discrete analogue of time. At any moment of time tk, the
distribution of the volume content of the fractions over the cells of the chain is presented by the state column vectors S1k
and S2k of size m·1 containing elements S1jk and S2jk, where
j = 1,..,m is counted from the top of the mixture.
Following the assumption used in [8, 9], let us suppose that the total volume of the fractions inside each cell Smaxremains
constant with time, regardless of the composition of each frac-tion inside the cell. This condifrac-tion gives the following con-straint:
Sk
1jþ Sk2j¼ Smax; j ¼ 1; . . . ; m (1)
It is clear that for a binary mixture it is enough to describe the evolution of one state vector of two, e.g., the state vector
S1k, which varies with time, i.e., from one transition to another.
Its evolution can be described by the recurrent matrix equa-tions:
Skþ1
1 ¼ Pk1Sk1 (2)
where P1is the matrix of transition probabilities that control
the process. It has the following form:
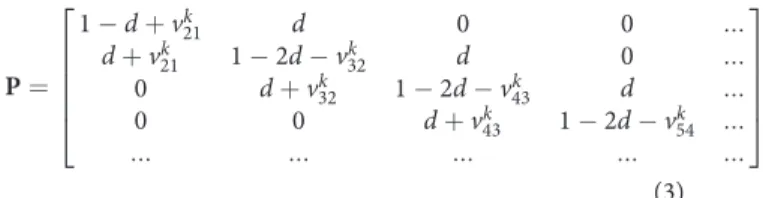
P ¼ 1 # d þ vk 21 d 0 0 ::: d þ vk 21 1 # 2d # vk32 d 0 ::: 0 d þ vk 32 1 # 2d # vk43 d ::: 0 0 d þ vk 43 1 # 2d # vk54 ::: ::: ::: ::: ::: ::: 2 6 6 6 6 4 3 7 7 7 7 5 (3) where index 1 is already omitted and P and S are related to the key component. The matrix P is a tridiagonal matrix. The entry placed in the j-th column below the main diagonal is the prob-ability for the key component to transit from the cell j to the cell j+1 during Dt, the entry above it is the probability to transit to the cell j–1, and the entry on the main diagonal is the proba-bility to stay within the cell j during Dt. It is obvious that the sum of all entries in each column must be equal to one.
The symmetrical probability d is related to pure diffusion mixing that tends to level out all non-homogeneities once the final mixture is obtained. It is connected with the dispersion coefficient D by the relationship d = DDt/Dx2. The
non-sym-metrical transition probability v is related to the downward segregation of the key component. This probability is to be cal-culated as v = VDt/Dx where V is the dimensional rate of segre-gation. However, the point is that this segregation practically never occurs into the pure basic component. Once the mixing process has started, it is already segregation of the key compo-nent into a mixture of the key and basic compocompo-nents.
In order to define its rate, the following assumptions are made as used in our papers [8, 9]. The first one is that the key component does not segregate into itself, i.e., only its diffusion mixing is possible. The second one is that the downward segre-gation of the key component from the cell j into the cell j+1 only occurs into the part of the cell j+1 that is free of this com-ponent, i.e, into the area occupied by a more coarse fraction. These assumptions allow calculating v as follows:
vk jþ1;j¼ v0 1 # Sk jþ1 Smax ! (4)
where v0is the probability of segregation transition of the key
component into the pure basic one.
Thus, the matrix of transition probabilities P becomes state-dependent and the model itself becomes nonlinear. In order to start the recurrent procedure given by Eq. (2), the state vector S0of the key component’s initial distribution is to be
formu-lated. Investigation of its influence on the mixing kinetics is described below.
Figure 1. Fragment of the chain of cells presenting the process of mixing.
–
2.2 Influence of the Key Component Amount on Mixing Kinetics
The estimation of influence of the key component amount on mixing kinetics was done by numerical experiments with the model described above. They were done for the chain with m = 20 cells. The amount of the key component was given by the number of cell m1it occupies at the initial state. It was
assumed that each cell could contain the unit volume of the material independently of the component’s proportion (Smax= 1). The calculations were done at d = 0.1 and v = 0.55.
The mixture non-homogeneity was estimated by the standard deviation of the key component distribution:
sk ¼ ffiffiffiffiffiffiffiffiffiffiffiffiffiffiffiffiffiffiffiffiffiffiffiffiffiffiffiffiffiffiffiffiffiffiffiffiffiffiffiffiffi 1 m Xm 1 ðSk j # m1=mÞ2 s (5)
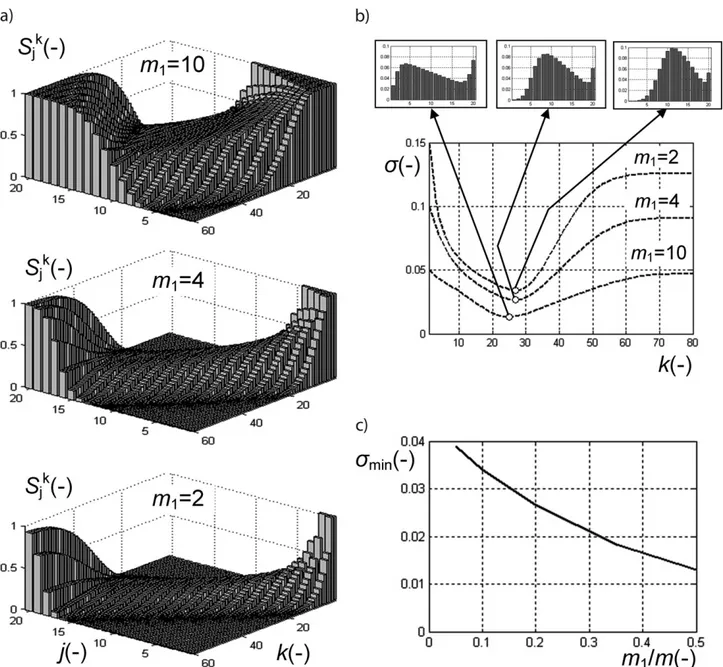
The results of numerical experiment are presented in Fig. 2. Fig. 2 a shows the evolution of the key component distribu-tion at different amount of the key component. In all cases its distribution first becomes more homogeneous, then its non-homogeneity reaches its minimum, and then turns back to less homogeneous distribution; at d = 0 the initial distribution sim-ply turns upside down asymptotically. It is more clearly seen in Fig. 2 b where the mixing kinetics for different amounts of the key component is displayed. The small windows above the
Figure 2. Influence of the key component amount on mixing characteristics: (a) evolution of the key component distribution at different amounts of the component; (b) mixing kinetics for different amounts of the key component (small windows above the graphs show the relative distribution of the key component at optimum mixing time); (c) influence of the key component amount on the minimum reach-able non-homogeneity.
graphs show the relative distribution of the key component at optimum mixing time. The minimum non-homogeneity that can be reached, rather strongly depends on the key component amount. The smaller this amount, the less maximum homoge-neity can be obtained in the process. It is worth noting that the optimum mixing time, i.e., the optimum number of transitions, only slightly depends on the key component amount. It is obvious that under different conditions of mixing the quantita-tive characteristics can change but all the tendencies will remain the same.
2.3 Influence of the Key Component Initial Distribution on Mixing Kinetics
It is shown above that it becomes difficult to obtain a reason-ably homogeneous mixture if the amount of a key downward segregating component is small enough. Let m1 = 4, i.e., the
key component is loaded in a proportion of 1:4. Suppose that there is a technical possibility to load it into a mixing chamber in layers distributed inside the basic component and compare the mixing kinetics for two initial state vectors:
S0¼ 1 1 1 1 0 0 0 0 0 0 0 0 0 0 0 0 0 0 0 0½ 'T (6)
that corresponds to the key component loading to the upper part of a mixer, and
S0¼ 1 0 0 0 1 0 0 0 0 1 0 0 0 0 1 0 0 0 0 0½ 'T (7)
that corresponds to its structured load (the index T means transposing a vector).
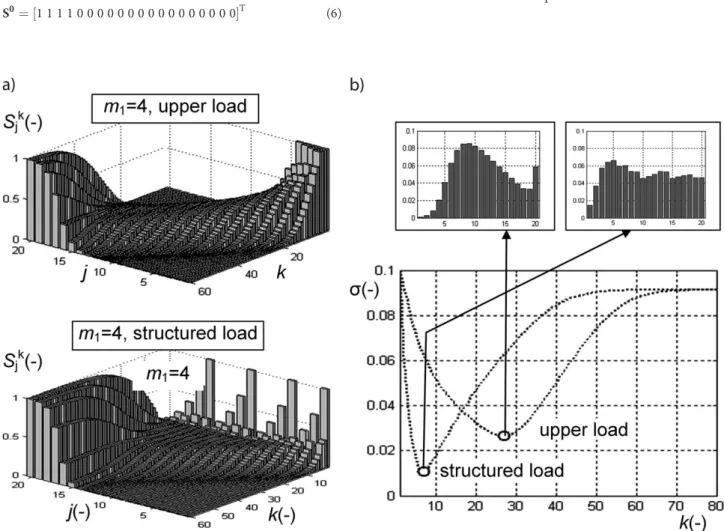
The results of this comparison are illustrated in Fig. 3. Fig. 3 a demonstrates the evolution of the key component distribution for two different ways of loading. It can be already seen from the graphs that with the structured load the mixture becomes homogeneous much faster and its homogeneity near the optimum mixing time is much higher than it is with the traditional upper loading of the key component. The quantita-tive estimation of that can be seen from the graphs of mixing kinetics in Fig. 3 b. With the structured load the optimum mix-ing time becomes four times as small, and the minimum non-homogeneity gets cut by half. Actually, these results are not unexpected. At the structured loading, the loading process includes a premixing stage, sometimes considerable, that takes place without segregation, and the mixing as such must realize as the postmixing during a short time when the segregation cannot lead to considerable separation of the mixture.
Figure 3. Comparison of mixing characteristics at the upper and structured load: (a) evolution of the key component distribution at dif-ferent ways of loading; (b) mixing kinetics for difdif-ferent ways of loading (small windows above the graphs show the relative distribution of the key component at optimum mixing time).
3
Experimental
3.1 New Feeder for Structuring the Load Fed to a Batch Vibration Mixer
A possible technical solution to arrange the struc-tured load into a batch mixer is indicated in Fig. 4. Fig. 4 a shows its basic design. The main parts of the feeder are: the vertical shaft 1 with rectangular plates 2 installed coaxially to the cylindrical mixing chamber 3. The angle between plates is proportion-al to the component’s content. At the initiproportion-al stage, the plates touch the bottom of the chamber. The components are loaded into the gaps between the plates, the upper level of the components being identical. Then, the shaft with the plates is brought in rotation motion and at the same time in upward motion. The components stay in the chamber as the spiral layers like it is shown in Fig. 4 b.
The spiral initial distribution is not exactly the same as it is shown in Fig. 3 a but it is obvious that it can be considered equivalent. It is necessary to note that, if the upward motion of the vertical shaft is slow enough, the heights of the key compo-nent layer will be such small that probably no post-mixing is necessary to complete the process.
3.2 Setup for Investigation of Mixing Kinetics
An experimental validation of the model was carried out using a custom vibration stand that generates vertical vibrations of controlled amplitude and frequency. Glass beads with diame-ters of 2 and 4 mm with a different color for each size were used to simulate the components to be mixed. The mixing ves-sel was a box with a transparent front wall 100 ·150 mm. The gap between the front and back walls was 20 mm.
Using the ruler on the front wall of the box, the components were arranged in layers. After the experiment started, the mixture was photographed every 15 s. These pictures were analyzed using spe-cial image analysis software that allowed finding the content of the key component in each horizon-tal layer of the height 0.4 cm that is equal to the cell height (computational size of sampling). The latter allowed calculating the mixture non-homogeneity by Eq. (5), i.e., defining the experimental mixing kinetics. Each experiment was repeated at least five times to obtain reproducible results.
4
Results and Discussion
The dimensional rate of the key component segre-gation V0was taken from [9] where the same glass
beads were used. It was equal to 2.1 cm min–1. The
chain with 20 cells of the height Dx = 0.4 cm was employed for modeling and processing of experi-mental data. The transition duration was taken equal to Dt = 5 s. At these parameters, the
probabil-ity of segregation transition, i.e., the dimensionless rate of seg-regation, v = VDt/Dx = 0.4375. The probability of pure diffu-sion transition d = 0.12 was taken as the calibrating parameter to reach the best fit to experimental data by the least squares method.
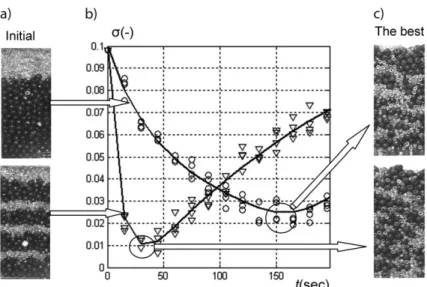
The results of the work are illustrated in Fig. 5. Fig. 5 a depicts the initial distributions of the components: the upper photo refers to the upper loading of the downward segregating component, and the lower photo to the structured load as four layers. Fig. 5 b indicates the experimental and calculated mixing kinetics for both cases of loading. It can be seen that structur-ing the load leads to the followstructur-ing results: the optimum mixstructur-ing time decreases from 160 s to 40 s, i.e., four times as little, and the minimum non-homogeneity decreases from 0.025 to 0.01, i.e., 2.5 times as little.
It is obvious that under different conditions of mixing, i.e., other materials, parameters of vibration, etc., the quantitative
a) b)
Figure 4. Feeding device for structuring the load: (a) principal scheme of the de-vice; (b) photo of loaded components.
Figure 5. Experimental comparison of mixing kinetics for two ways of the key component loading: (a) photo of initial distribution; (b) experimental (points) and calculated (lines) mixing kinetics; (c) photo of the best distributions that can be reached.
characteristics of the process can change but the tendencies of its intensification will be the same. It follows from the physical sense of multilayer loading and theoretical estimations shown in Fig. 3.
5
Conclusions
It is shown both theoretically and experimentally that the structured loading of dissimilar components into a batch mixer of solids is an effective way to reduce the mixing time and to improve the mixture’s homogeneity. It is particularly effective when it is necessary to mix a small amount of a downward seg-regating component with a large amount of a basic one. The developed Markov chain model allows estimating the effect that can be reached if the segregating component is loaded in a mixing chamber as several layers distributed within a basic component.
The basic design of the feeder used to load the material into a batch vibration mixer, that allows loading of a key compo-nent as the spiral layer within a basic compocompo-nent, is proposed and its workability is proved. A potential direction of the work development is to find the optimum number of layers that minimize the total time of the loading-mixing cycle. The model can be also coupled with discrete element method (DEM) sim-ulation of mixing of solids (see, e.g. [10]) to avoid the time-and labor-consuming procedure of its experimental identifica-tion.
Acknowledgment
This work was supported by the Russian Foundation for Basic Research (project 18-08-00028 A).
The authors have declared no conflict of interest.
Symbols used
D [m2s–1] dispersion coefficient
d [–] probability of pure stochastic (diffusion) transition
j [–] cell number counted from the top of the mixture
k [–] transition number
m [–] total number of cells in the chain P, Pij [–] matrix of transition probabilities
and its entries
S, Sj [–] state vector and its entries
Smax [–] maximum content of mixture that a
cell can contain t [s] time
V [cm min–1] velocity of segregation
Dx [cm] cell height Greek letters
v [–] probability (rate) of segregation transition
s [–] standard deviation, mixture non-homogeneity
References
[1] J. Bridgwater, Particuology 2010, 8, 563–567. DOI: 10.1016/ j.partic.2010.07.001
[2] J. Bridgwater, Particuology 2012, 10, 397–427. DOI: 10.1016/ j.partic.2012.06.002
[3] P. Tang, V. M. Puri, Part. Sci. Technol. 2007, 25, 571–588. DOI: 10.1080/02726350701783977
[4] A. K. Jha, J. S. Gill, V. M. Puri, Part. Sci. Technol. 2008, 26 , 482–493. DOI: 10.1080/02726350802367902
[5] A. K. Jha, V. M. Puri, Powder Technol. 2010, 197, 274–282. DOI: 10.1016/j.powtec.2009.10.004
[6] T. Barcz, T. Travnickova, J. Havlica, M. Kohout, Chem. Eng. Technol. 2015, 38 (7), 1195–1202. DOI: 10.1002/ ceat.201400686
[7] H. Berthiaux, V. Mizonov, V. Zhukov, Powder Technol. 2005, 157, 128–137. DOI: 10.1016/j.powtec.2005.05.019
[8] V. Mizonov, H. Berthiaux, C. Gatumel, Particuology 2016, 25, 36–41. DOI: 10.1016/j.partic.2015.05.002
[9] V. Mizonov, I. Balagurov, H. Berthiaux, C. Gatumel, Partic-uology 2017, 31, 80–86. DOI: 10.1016/j.partic.2016.05.006
[10] G. Basinskas, M. Sakai, Powder Technol. 2016, 301, 815–829. DOI: 10.1016/j.powtec.2016.07.017