Climatic niche evolution
within tropical tree lineages:
the case of the Erythrophleum genus
(Fabaceae - Caesalpinioideae) in Africa
COMMUNAUTÉ FRANÇAISE DE BELGIQUE UNIVERSITÉ DE LIÈGE – GEMBLOUX AGRO-BIO TECH
C
LIMATIC NICHE EVOLUTION WITHIN
TROPICAL TREE LINEAGES
:
THE CASE OF THE
E
RYTHROPHLEUM GENUS
(F
ABACEAE
-
C
AESALPINIOIDEAE
)
IN
A
FRICA
Anaïs-Pasiphaé Gorel
Dissertation originale présentée en vue de l’obtention du grade de docteur en sciences agronomiques et ingénierie biologique
Promoteur(s) : Dr Adeline FAYOLLE ; Pr. Jean-Louis DOUCET Année civile: 2019
Licence d’utilisation
Cette oeuvre est sous licence Creative Commons. Vous êtes libre de reproduire, de modifier, de distribuer et de communiquer cette création au public selon les conditions suivantes :
- paternité (BY) : vous devez citer le nom de l'auteur original de la manière indiquée par l'auteur de l'oeuvre ou le titulaire des droits qui vous confère cette autorisation (mais pas d'une manière qui suggérerait qu'ils vous soutiennent ou approuvent votre utilisation de l'oeuvre) ;
- pas d'utilisation commerciale (NC) : vous n'avez pas le droit d'utiliser cette création à des fins commerciales ;
- partage des conditions initiales à l'identique (SA) : si vous modifiez, transformez ou adaptez cette création, vous n'avez le droit de distribuer la création qui en résulte que sous un contrat identique à celui-ci. À chaque réutilisation ou distribution de cette création, vous devez faire apparaitre clairement au public les conditions contractuelles de sa mise à disposition. Chacune de ces conditions peut être levée si vous obtenez l'autorisation du titulaire des droits sur cette oeuvre. Rien dans ce contrat ne diminue ou ne restreint le droit moral de l’auteur.
v
Abstract
In Africa, while some plant groups and specifically genera are strictly associated to specific biomes, evidence of widely distributed genera transcending biome or habitat boundaries have also been reported for herbaceous plants and for tree genera. In this thesis, we aim at understanding the evolutionary processes that allowed particular tropical tree lineages to adapt to contrasted environmental conditions and occur in vast areas. While a diversity of methods at different phylogenetic and spatial scales can provide complementary insights, detailed analyses of well-resolved clades are needed to build robust generalizations about niche evolution and biome shifts. Therefore, from species distribution modeling to hard physiological measurements, we attempt to disentangle the processes explaining the vast distribution of Erythrophleum (Fabaceae), a tropical tree genus widely distributed in Africa, Australia and China.
A synthesis is first provided on the Erythrophleum species in Africa (Chapter 2).
Erythrophleum encompasses two forest species and two savanna species. The forest
species are morphologically similar and sold for timber under the same commercial name, Tali, but genetics revealed contrasted distribution. Erythrophleum ivorense is restricted to the wet coastal forest, while Erythrophleum suaveolens occurs over vast areas from the moist forest up to gallery forests in the savanna.
Secondly, we use species distribution models to determine the bioclimatic constraints on the distribution of the Erythrophleum species and gene pools (Chapter
3). Our results support the substantial role of climate in niche evolution, and
speciation, within the genus. Erythrophleum has managed to adapt to extremely contrasted climates, resulting in a distribution encompassing several biomes, from the wet forest to the dry forest and the savanna.
Ecophysiological (Chapter 4) and experimental (Chapter 5) approaches are then used to get a functional understanding of the niche evolution within Erythrophleum. We find that, for the two forest species, the shift into drier environments was associated with a coordinated evolution of the xylem resistance to embolism, controlled by subtle adaptations in wood anatomical traits, and desiccation delay strategies at stem and leaf levels.
Finally, after confronting our results with previous studies on congeneric species, we conclude that, for certain tree lineages, the lability of drought tolerance traits, specifically those related to xylem protection, is an important functional path allowing to transcend habitat and biome boundaries (Chapter 6). We then discuss the generalization of the niche evolution pattern we detected for Erythrophleum to other African genera. Comparing the niche of 1439 woody species at the continental scale, we provide new evidence supporting the niche evolution within many woody genera in tropical Africa (20% of the 532 studied genera).
Résumé
En Afrique, alors que certains genres de plantes sont strictement limités à un biome, d’autres sont plus largement répandus. L’objectif de cette thèse est de comprendre les processus évolutifs qui ont permis à ces lignées de s’adapter à des conditions variées, et ainsi, de transcender les frontières des habitats. Bien que de nombreuses méthodes à différentes échelles phylogénétiques et spatiales puissent fournir des informations complémentaires, l’analyse détaillée de genres dont la phylogénie est connue est nécessaire pour comprendre les mécanismes d’évolution de niche. Par l’utilisation de modèles de distribution jusqu’à de fines mesures écophysiologiques, nous avons identifié les processus évolutifs associés à la distribution d’Erythrophleum, un genre d'arbres tropicaux largement répandu en Afrique, en Australie et en Chine.
Dans un premier temps, nous avons réalisé une synthèse des données concernant les espèces africaines du genre (Chapitre 2). Le genre Erythrophleum comprend deux espèces de forêt, morphologiquement similaires et commercialisées sous le même nom : Tali. Des études génétiques ont révélé que ces deux espèces occupent des zones contrastées. Erythrophleum ivorense est inféodé aux forêts humides sempervirentes côtières alors qu’Erythrophleum suaveolens est présent des forêts semi-décidues jusqu’aux galeries forestières au sein des savanes. Le genre Erythrophleum comprend également deux espèces de savane : Erythrophleum africanum très largement distribué en Afrique et Erythrophleum lasianthum restreint au nord du Mozambique.
Dans un second temps, nous avons utilisé des modèles de distribution pour identifier les variables bioclimatiques qui structurent la distribution des espèces et des populations génétiques en Afrique (Chapitre 3). Nos résultats ont confirmé le rôle important du climat dans l'évolution de la niche et la spéciation au sein du genre.
Erythrophleum s’est adapté à différents régimes de précipitation, ce qui explique sa
distribution englobant les biomes, de la forêt humide à la forêt sèche jusqu’à la savane. Nous avons ensuite utilisé des approches écophysiologiques (Chapitre 4) et expérimentales (Chapitre 5) afin d'obtenir une compréhension fonctionnelle de l'évolution de la niche d'Erythrophleum. Pour les deux espèces forestières, la colonisation de milieux secs est associée à l'évolution de la résistance à l’embolisme et de stratégies de retard de dessiccation. Ces résultats confirment que la labilité des traits associés à la tolérance à la sécheresse, en particulier les traits liés à la sécurité du xylème, est une voie fonctionnelle importante permettant aux lignées de transcender les frontières des biomes (Chapitre 6).
Finalement, la généralisation des patrons d’évolution de niche détectés pour
Erythrophleum à d'autres genres africains a été examinée. En comparant la niche de
1439 espèces ligneuses à l’échelle continentale, nous avons pu mettre en évidence une évolution de niche au sein de nombreuses genres ligneux en Afrique tropicale (20%
vii
Remerciements
Cette thèse signe l’aboutissement d’un travail réalisé sur 6 années, au fil desquelles de nombreuses personnes m’ont écoutée, conseillée et accordée leur confiance. Que toutes reçoivent ici ma plus profonde reconnaissance.
Mes remerciements s’adressent tout d’abord à mes promoteurs, le Dr Adeline Fayolle et le Prof. Jean-Louis Doucet. Merci pour la rigueur scientifique que vous m’avez apportée et pour m’avoir accompagnée et soutenue tout au long de ces années. J’ai vraiment de la chance de vous avoir eu comme promoteurs, mais encore plus de chance de vous avoir comme amis.
Que soient également remerciés les membres de mon comité de thèse, les Prof./Dr. Arnaud Monty, Jan Bogaert, Jérôme Duminil, Louis François et Philippe Lejeune pour leur disponibilité et leurs conseils, ainsi que les membres de mon jury de thèse les Prof./Dr. Jan Bogaert (président), Kathy Steppe, Mike Swaine, Jérôme Duminil, Louis François, Arnaud Monty, Adeline Fayolle et Jean-Louis Doucet.
Merci aux Prof./Dr. Kathy Steppe et Hans Beeckman pour leur accueil dans leurs laboratoires et leurs relectures attentives.
Cette thèse a été effectuée en parallèle d’un assistanat et je tenais à remercier les professeurs dont j’ai été l’assistante pendant ces six ans, Philippe Lejeune, Jean Bogaert et Jean-Louis Doucet.
Je souhaite également remercier les scientifiques qui ont participé à l’élaboration des idées et articles de cette thèse, les Prof./Dr./Ir. Jérôme Duminil, Niels De Baerdemaeker, Gauthier Ligot, Kasso Daïnou et Melissa Rousseau pour leur acuité scientifique, leurs encouragements et leur disponibilité. Merci également au Prof. Yves Brostaux pour sesconseils stats et au Prof. Bonaventure Sonké pour son aide logistique au Cameroun.
Je remercie l’asbl Nature+de m’avoir octroyée une bourse qui m’a permis de mener à bien mes travaux sur le terrain. Je remercie également les projets P3FAC (Fonds français pour l’Environnement Mondial) et HerbaXylaRedd (https://herbaxylaredd.africamuseum.be/). J’adresse tout particulièrement ma gratitude aux sociétés forestières certifiées WIJMA, SFID et PALLISCO pour m’avoir ouvert leurs portes. Je voudrais particulièrement dire merci à Messieurs Paul Lagoute, Camille Simo Kamdem et Yanick Nkoulou. Merci également à toutes les personnes avec qui j’ai passé ces moments sur le terrain, Ango, Crépin, Gabriel, Max, Patrice, Clovis, Azor… et toutes les autres personnes dont je n’ai pu citer les noms ici.
Dans la même lignée, je remercie ces amis docteurs que j’ai eu le plaisir de connaître durant cette belle aventure : Achille Biwolé, Barbara Haurez, Armel Donkpegan, Dakis Ouedraogo, Gauthier Ligot, Nils bourlands, Oliver Hardy, Grace Loubota,
Pauline Gillet, Julie Morin-Rivat, Leslie Wilmet, Chauvelin Douh, Steeve Ngama, Christian Moupela, Charles-Albert Pètre, Jason Vleminckx, Michiel Hubeau, Jean-François Gillet, Niels De Baerdemaeker, Jonas Von der Crone.
Et comment ne pas rendre hommage à mes formidables collègues de l’Unité de Gestion des Ressources forestières (Forest is Life) pour les supers moments passés ensemble ! Cette équipe est vraiment parfaite. Les « tempérés » : Sébastien Bauwens, Corentin Bolyn, Allan Borremans, Romain Candaele, Hugues Claessens, Héloïse Dubois, Marie Fombona ,Cédric Geerts, Blandine Georges, Marie-Ange Golard, Lahcen Hadiy, Jacques Hébert, Léo Huylenbroeck, Ludivine Lassois, Nicolas Latte, Louise Leclère, Andyne Legrain, Philippe Lejeune, Jonathan Lisein, Laura Maebe, Lucie Maus, Adrien Michez, Alain Monseur, Jérôme Perin, Mikhail Pitchugin, Samuel Quevauvillers. Et les « tropicools » : Nassim Daher, Jean-Louis Doucet, Robin Doucet, Jean-Yves De Vleeschouwer, Chloé Dupuis, Quentin Evrard, Adeline Fayolle, Davy Fonteyn, Fructueux Houngbegnon, Simon Lhoest, Gauthier Ligot, Ndonda Makemba, Morgane Scalbert, Romaric, Félicien Tosso, Cédric Vermeulen, Donatien Zebaze. Sans oublier l’équipe de Nature + : Charles Bracke, Marie-Alice Noizet, Félicien Tosso, Kasso Daïnou, Franck Monthé et Nicolas Deflandre.
A mes amis
A ma famille et particulièrement à ma maman et mon papa.
ix
Table of content
Chapter 1: General introduction ... 1
1 The spatial patterns of vegetation and climate ... 3
1.1 The global distribution of biomes ... 3
1.2 The biogeography of Africa ... 6
1.3 The climatic correlates of plant spatial patterns ... 11
1.4 The legacy of past climate changes ... 12
2 The evolutionary processes ... 15
2.1 The evolutionary responses to environmental shifts ... 15
2.2 The move or evolve dilemma ... 17
2.3 The evolution of traits within lineages ... 18
2.4 The biome shifts within tropical tree lineages in Africa ... 19
3 The functional understanding of tropical tree diversification ... 21
3.1 The functional trait approach ... 21
3.2 The drought strategies of tropical trees ... 21
3.3 The wood hydraulics and associated anatomical traits ... 22
3.4 The regulation of gas exchanges ... 26
3.5 The stem photosynthesis ... 26
4 Our research strategy ... 26
4.1 Approach and objectives ... 26
4.2 Structure of the thesis ... 27
Chapter 2: Study species ... 29
1 Preamble ... 31
2 Botanical insight ... 32
3 Geographical distribution and habitats ... 34
4 Phylogeography ... 35
5 Ecological insight ... 36
5.1 Light requirement and population structure ... 36
5.2 Phenology ... 36
5.3 Pollination and dispersal ... 38
5.4 Seed dormancy and germination ... 38
5.5 Growth ... 39
6 Uses of Tali wood and sylvicultural practices ... 39
6.1 Wood properties and uses ... 39
6.3 Allometric equations ... 41
6.4 Artificial regeneration and plantation ... 42
7 Other uses of Erythrophleum species ... 42
Chapter 3: The niche evolution within Erythrophleum ... 45
1 Preamble ... 47
2 Methods ... 48
2.1 Occurrence data ... 48
2.2 Environmental data ... 48
2.3 Species distribution modelling ... 49
2.4 Quantifying niche overlap and conservatism ... 49
3 Results ... 50
3.1 Predicted distribution of Erythrophleum species and gene pools ... 50
3.2 Climatic constraints on the distribution of Erythrophleum species and gene pools ... 52
3.3 Niche overlap and conservatism among Erythrophleum species and gene pools ... 56
4 Discussion ... 58
Chapter 4: The functional understanding of niche evolution Part I: Hydraulics and wood traits ... 61
1 Preamble ... 63 2 Methods ... 64 2.1 Study sites ... 64 2.2 Field sampling ... 66 2.3 Hydraulic traits ... 66 2.4 Wood traits ... 68 2.5 Growth ... 69 2.6 Life-history traits ... 69 3 Results ... 70 3.1 Hydraulic traits ... 70 3.2 Wood traits ... 71 3.3 Growth ... 74 3.4 Life-history traits ... 75 4 Discussion ... 77
xi
Chapter 5: The functional understanding of niche evolution
Part II: Stomatal control and stem photosynthesis ... 81
1 Preamble ... 83
2 Methods ... 84
2.1 Plant material and experimental design ... 84
2.2 Wilting stage and mortality ... 85
2.3 Leaf gas exchanges and plant water status ... 86
3 Results ... 87
3.1 Experimental conditions ... 87
3.2 Wilting stage and mortality ... 88
3.3 Leaf gas exchanges and plant water status ... 89
4 Discussion ... 91
Chapter 6: General discussion ... 93
1 The niche evolution of Erythrophleum and the mechanistic underpinnings ... 95
1.1 Our major findings ... 95
1.2 The evidence of niche evolution ... 95
1.3 The functional understanding ... 97
1.4 The lability of drought-resistance traits ... 99
2 The generalization to other genera ... 101
2.1 The niche evolution of the tropical African woody flora ... 101
2.2 The exploration of functional shifts within lineages ... 108
3 To conclude, some practical implications ... 109
References ... 111
xiii
List of figures
Chapter 1: General introduction
Figure 1.1 Distribution of the world’s biomes, from Olson et al. (2001) who identified
and mapped the World’s “Ecoregions”
Figure 1.2 Biomes of the world as defined by Higgins et al. (2016) based on three
vegetation attributes derived from remote-sensing products.
Figure 1.3 Delimitation of the major phytochoria according to White (1983) and
Linder (2012).
Figure 1.4 The main floristic bioregions and transition zones identified across tropical
Africa by Droissart et al. (2018).
Figure 1.5 Floristic clusters identified by Fayolle et al. (2014, 2018) across tropical
Africa and plotted in geographical and environmental spaces.
Figure 1.6 65 Ma to Present global deep-sea oxygen records associated with major
climatic events and information of rain forest range reconstruction.
Figure 1.7 Vegetation dynamics during the quaternary glacial periods. Vegetation
dynamics during the last 90 ka BO at lake Bambili (Cameroon) and reconstruction of the tropical forest range shifts.
Figure 1.8 Hypothesized responses of species to climate change in case of niche
conservatism and niche evolution.
Figure 1.9 Distribution in geographical space and in Whittaker‘s bioclimatic scheme
for 12 African tree genera transcending forest and savanna boundary.
Figure 1.10 Embolism resistance (Ѱ50) plotted against mean annual precipitation
(MAP) for 384 angiosperm and 96 gymnosperm species across the world. Extracted from Choat et al. (2012)
Figure 1.11 Average vulnerability curve and desorption curve of Maesopsis eminii,
an African forest tree species.
Chapter 2: Study species
Figure 2.1 Crown (a), trunk and bark (b), pods (c), leaves and flowers (d), and flowers
(e) of Erythrophleum suaveolens.
Figure 2.2 Schematic cladograms and distribution of tropical African Erythrophleum
species (a) and gene pools (b).
Chapter 3: The niche evolution within Erythrophleum
Figure 3.1 Potential distributions for Erythrophleum species (a), E. ivorense (b) and
E. suaveolens gene pools (c).
Figure 3.2 Response curves to the 8 retained environmental variables for each species
(left panels), E. ivorense gene pools (central panels) and E. suaveolens gene pools (right panels).
Chapter 4: The functional understanding of niche evolution
Part I: Hydraulics and wood traits
Figure 4.1 Species distribution and study sites. Potential distribution in Upper and
Lower Guinea (a) and response curve (probability of presence) along the rainfall gradient (b) of the two sister species Erythrophleum ivorense and E. suaveolens.
Figure 4.2 Climate diagrams. Walter-Lieth climate diagram of monthly average and
precipitation for the Ma’an site (a), natural habitat of E. ivorense and the Mindourou site (b), natural habitat of E. suaveolens.
Figure 4.3 Hydraulic traits. Acoustic vulnerability curves (a) and desorption curves
(b) for the wet forest species Erythrophleum ivorense and the moist forest species E.
suaveolens.
Figure 4.4 Wood traits. Average of vessel diameter, vessel density, vessel wall
reinforcement, percentage of vessel lumen and intervessel pit diameter and 95% confidence intervals for branches and stem collected in the natural habitat (respectively a and b) and for branch samples collected in a common garden experiment (c) for the wet forest species Erythrophleum ivorense and the moist forest species E. suaveolens.
Figure 4.5 Average growth and 95% confidence intervals of the wet forest species
Erythrophleum ivorense and of the moist forest species E. suaveolens in the natural
habitat (a), in natural habitat by diameter classes (b) and in the common garden experiment (c).
Chapter 5: The functional understanding of niche evolution
Part II: Stomatal control and stem photosynthesis
Figure 5.1 Controlled experiment on 1-year old potted E. ivorense and E. suaveolens
seedlings (a) and leaf gas exchanges measurements with the Licor system (b).
Figure 5.2 (a) Average soil water content (± SE, %) over time for the control
(solid lines) and drought-stressed seedlings (dashed-lines) for the two species
E. ivorense (in green) and E. suaveolens (in orange). (b) Vapour pressure deficit
xv
Figure 5.4 Effect of soil water content, vapor-pressure deficit and CO2
concentration on conductance, transpiration rate and photosynthesis for seedlings of E. ivorense (green) and E. suaveolens (orange).
Figure 5.5 Mean water potential over mean conductance calculated at each census for
E. ivorense seedlings (green) and E. suaveolens seedlings (orange).
Chapter 6: General discussion
Figure 6.1 A mechanistic understanding of the niche evolution between E. ivorense
(wet forests) and E. suaveolens (moist and dry forests), from wood traits to distribution.
Figure 6.2 Conceptual diagram of analysis steps. Numbers in brackets correspond to
the analysis steps described in the text.
Figure 6.3 Environmental gradients and climatic niches of congeneric species
belonging to 5 genera in climatic space. The contribution of the climatic variables on the two axes of the PCA is represented (a). Each panel represents the niches of congeneric species along the two first axes of the PCA (b-f)
Figure 6.4 Hierarchical clustering of 1439 species on the basis of shared climatic
niches (a). Nonmetric Multidimensional Scaling (NMDS) representing niche dissimilarity among the 1439 species in two dimensions (b).
Figure 6.5 Number of species per family assigned to each cluster (a). Number of
genera per family that are savanna specialist (“savanna” niche conservatism), forest specialist (“forest” niche conservatism) or generalist, making transition between the two biomes (b).
Figure 6.6 Within the savanna biome (a) and within the forest biome (b), number of
genera per family that are specialist of only one cluster and number of genera per family making at least one transition between two clusters.
List of tables
Chapter 2: Study species
Table 2.1 Summary of the published data on phenology for the four African
Erythrophleum species
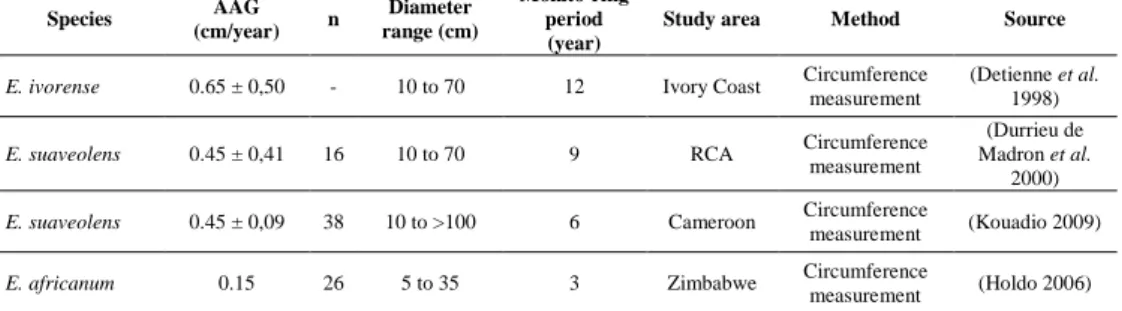
Table 2.2 Published data on growth for the four African species of Erythrophleum Table 2.3 Wood properties of the four African species of Erythrophleum
Table 2.4 Allometric equations linking tree volume (V) to diameter (D) and/or
height (H) according to GlobAllomeTree (http://www.globallometree.org, Henry et al., 2013).
Chapter 3: The niche evolution within Erythrophleum
Table 3.1 Performance of SDMs selected based on AIC for each Erythrophleum
species and gene pool.
Table 3.2 Contribution (C in %) and permutation (P in %) of the eight ret ained
environmental variables to model the distribution of each species and gene pool.
Table 3.3 Niche overlap and similarity between pairs of Erythrophleum species and
gene pools. Niche overlap (D) and results of similarity tests with P-values (P) are given for each species pair and for different background definitions (25, 50, 100 and 200 km buffers).
Chapter 4: The functional understanding of niche evolution
Part I: Hydraulics and wood traits
Table 4.1 Fixed parameter estimates, standard error (SE), P‐values and variance of
the residuals (σ εi|sp) for the best linear mixed model for testing differences in wood
traits between Erythrophleum ivorense (ivo) and E. suaveolens (sua).
Table 4.2 Light requirement and life-history traits for the wet forest species
Erythrophleum ivorense and for the moist forest species E. suaveolens (CEIjuv
correspond to the crown exposure index at 10 cm).
Chapter 5: The functional understanding of niche evolution
Part II: Stomatal control and stem photosynthesis
Table 5.1 Experimental design. Number of individuals of each species per treatments
xvii
Abbreviations
δ18O: Ratio of stable isotopes oxygen-18 (18O) and oxygen-16 (16O). 14C: Radiocarbon
A: Photosynthetic rate (µmol/m²/s) AE: Acoustic emission
AE12, 50, 88, 100: The water potential at which the xylem experiences 12, 50, 88 and
100 % loss of conductivity assessed with the acoustic emission method
af: Erythrophleum africanum
AIC: Akaike information criterion AUC: Area Under the Curve
BP: Before present (i.e. before 1950) CEIjuv: Crown exposure index at 10 cm DBH
Cel: Elastic capacitance
Cinel: Inelastic capacitance
D: Schoener’s D metric DBH: Diameter at Breast Height DOY: Day Of Year
E: Transpiration rate (mmol/m²/s) gs: Stomatal conductance (mmol/m²/s)
ivo: Erythrophleum ivorense
ka: Thousand years O: Niche overlap
PCA: Principal Component Analysis PNC: Phylogenetic Niche Conservatism PND: Phylogenetic Niche Divergence
PPFD: Photosynthetic Photon Flux Density (μmol/m²/s²) SDM: Species Distribution Model
SE: Standard Error
sua: Erythrophleum suaveolens
SWC: Soil Water Content VC: Vulnerability Curve
VCAE: Acoustic Vulnerability Curve
WC: Water Content
VWC: Volumetric Water Content WS: Witling stage
πTLP: Water potential at the turgor loss point (MPa)
Ψ: Water potential (MPa)
Ψ12, 50, 88, 100: The water potential at which the xylem experiences 12, 50, 88 and
1
1 The spatial patterns of vegetation and climate
1.1 The global distribution of biomes
At least on land, plants shape and dominate biotic communities. These communities are structured along temporal and spatial scales. Identifying and mapping these structures is a keystone in ecology because it enables the study of the underlying biogeographical, evolutionary and ecological processes involved in their assembly (Schimper 1903, Holdridge 1947, Whittaker 1970, Walter 1973, Mucina 2019).
Biogeographic patterns have been defined at various scales and with numerous methods. At very large scale, biomes are the basal vegetation unit commonly used to describe and order biological diversity (Figure 1.1). Biomes are defined by structural and functional attributes (Whittaker 1970, Donoghue & Edwards 2014, Moncrieff et
al. 2015). The assumption behind the biome concept is that, over time, the
environment selects and filters organisms, resulting in vegetation units similar in structure and function although geographically and evolutionary distant (Schimper 1903). The biome concept is attractive because it can be applied globally without reference to plant species composition, allowing generality to be sought. Indeed, units compared over a very large distance, e.g. between continents, share few species while the general physiognomy of the vegetation might remain very similar (Mucina 2019).
Figure 1.1 Distribution of the world’s biomes, from Olson et al. (2001) who identified
There is a consensus that biomes are useful for describing the functioning of the world’s ecosystems, however, the characterization of the biome categories is still a subject of debate. Due to the latter, a great diversity of maps using different biome characterizations can be found in textbooks. From the fundamental work of Schimper (1903) to the present (Friedl et al. 2010), biome delimitation has integrated climatic variables, deviating from the purely functional and physiognomic definition. To tackle this problem, Higgins et al. (2016) proposed to map the global terrestrial surface into regions that function similarly using three vegetation attributes: the vegetation height, a vegetation productivity index (VPI) based on the normalized difference vegetation index (NDVI) and a growth limitation index, i.e. a seasonality index which describes whether the lowest point in the annual NDVI cycle corresponds to the driest or the coldest part of the year.A global map of biomes was thus produced (Figure 1.2) allowing the analysis of the relationships between biome distribution and climate not confounded by the circularity of using climatic thresholds in the biome definition.
According to the purely structural and functional work of Higgins et al. (2016), five major biomes are found in the tropics (Figure 1.2). This result contrasts with the dichotomy between tropical and subtropical forest and savanna traditionally recognized, with possibly the inclusion of a third tropical biome: the tropical dry forest (Dexter et al. 2018). In the work of Higgins et al. (2016), savannas where trees and C4 grasses coexist (Whittaker 1970, Olson et al. 2001, Ratnam et al. 2011) are subdivided into four different biomes which share growth limitation during the driest part of the year but have contrasting degree of height and vegetation productivity. The tree savanna biome (THD, in red) has tall vegetation and high vegetation productivity. The shrub savannas are characterized by small vegetation and are divided into three distinct biomes based on their vegetation productivity (shrub savanna with high (SHD, in orange), medium (SMD, light orange) and low (SLD, in yellow) vegetation productivity), forming a south-north gradient in West and North Africa. The SLD biome is sparsely vegetated and corresponds to the transition between the shrub savanna and the desert (SLN, sand color). The widespread “tall high VPI non-seasonal” (THN, in green) biome mainly correspond to the wet and moist tropical forests dominated by trees and forming closed canopy and complex vertical structure with C3 grassesin understory.
F ig u r e 1 .2 B io m e s o f t h e w o rl d a s d e fi n e d b y H ig g in s e t a l. (2 0 1 6 ) b a se d o n th re e v e g e ta tio n a tt ri b u te s d e ri v e d f ro m r e m o te -se n si n g p ro d u c ts : th e v e g e ta ti o n h e ig h t, th e v e g e ta ti o n p ro d u c ti v it y i n d e x ( V P I) a n d h o w th e v e g e ta tio n a c ti v it y i s li m it e d b y te m p e ra tu re a n d s o il m o is tu re . T h e b io m e s sh o w n h e re a re th e d o m in a n t c la ss if ic a ti o n o v e r a 3 1 -y e a r G IM M S 3 g r e c o rd . T he b io m e n am es a re d er iv ed fr om th re e l ett er s ( 1) “ T ” o r “ S ” f or T all o r S ho rt ve ge ta tio n he ig ht , ( 2) “ L ”, “M ” o r “ H ” f or L ow , M ed iu m o r H ig h V P I an d (3 ) “C ”, “D ” or “ B ” fo r C ol d, D ry o r B ot h co ld a nd d ry ( no ns ea so na l) fo r th e gr ow th li m ita tio n i n d e x .
1.2 The biogeography of Africa
Although useful for global scale comparison, the classification of vegetation on physiognomy brings together floristic units which, in many aspects, are different, and is probably not consistent with the highly complex structural diversity of tropical and subtropical vegetation (White 1983). As one moves down the hierarchy of vegetation types, floristic similarity among the types becomes more informative.
Spatial changes of species composition have been long recognized across tropical Africa (Aubréville 1932, 1962, White 1978, 1983, Denys 1980). Yet, the identification of geographically distinct assemblages of species and communities (i.e. the biogeographical regionalization) has been a challenge for over the past century, from the early work of Lebrun (1936) through White (1983), to the more recent studies of Linder et al. (2012) for cross-taxonomic comparison and Droissart et al. (2018) for plants. The work of White (1979, 1983) currently represents the most widely used chorological and vegetation classification for Africa, and has been validated several times since Denys et al. (1980). With the help of a strong botanical expertise, White defined three main types of phytochoria in Africa based on the richness of endemic species: the regional centers of endemism, the transition zones and the regional mosaics (Figure 1.3a). A regional center of endemism, such as the Guineo-Congolian, is defined as a phytochorion with both more than 50% of its species confined to it and a total of more than 1000 endemics species. The regional centers of endemism are separated by transition zones which have few endemic species and share the majority of their species with the adjacent phytochoria. Finally, the regional mosaics are more complex phytochoria, formed by an intermingling of physiognomic types with a variability of floristic relationships.
The work of White provided a coherent and useful chorological classification of Africa, however, it remains mostly based on expert’s field observation and interpretation of empirical data, limiting reproducibility (Droissart et al. 2018). The development of computer-based categorization and the increasing availability of species occurrence databases have opened the way for robust statistical regionalizations of the African flora, leading to reproducible results (Denys 1980, Linder et al. 2005, Linder 2014, Droissart et al. 2018, Fayolle et al. 2014 for forests and Fayolle et al. 2018 for savannas). Denys (1980) was the first to employ factorial analysis and distribution of 494 species to undertake an analytical classification of Africa’s vegetation, with marked differences between the Guineo-Congolian forest block and the East African vegetation, later confirmed by Fayolle et al. (2014). In several studies, Linder et al. (2001, 2005, 2012) used ordination and cluster analysis of distribution data to regionalize the African flora objectively. The last study compared plant patterns with those of several groups of vertebrates and found a surprisingly high degree of congruence across groups and a new regionalization of the
Figure 1.3 Delimitation of the major phytochoria according to (a) White (1983) and (b)
Linder (2012). Abbreviations correspond to Centre of Endemism (CE), Regional Mosaic (RM) and Transition Zone (TZ)
In 2018, Droissart et al. proposed a biogeographical regionalization of tropical and subtropical Africa based on herbarium records of 24719 plants species (from the RAINBIO dataset, available at http://rainbio.cesab.org/) belonging to four growth forms: terrestrial herbs, trees, shrubs and lianas. Analyzed separately, plant growth forms showed contrasting geographical patterns and the authors concluded that the bioregionalization was better resolved for closed forest types using trees and liana and for open vegetation using terrestrial herbs, while shrubs showed good discriminative power in all vegetation types. When the different growth forms were analyzed together, 16 bioregions and 11 transition zones were identified (Figure 1.4). The delimitation was highly congruent with previous African bioregionalization with clear distinction between the West and Central Africa on one hand and the eastern and the southern Africa on the other.
Figure 1.4 The main floristic bioregions and transition zones identified across tropical
Africa by Droissart et al. (2018) based on herbarium records of 24719 plants species (from the RAINBIO dataset) belonging to four growth forms: terrestrial herbs, trees, shrubs and liana. Only regions with at least 1,000 records are represented. Hatching indicates transition zones, with strict endemism rates lower than 5%. Dashed lines represent the limits for tropical Africa as defined in Droissart et al. (2018).
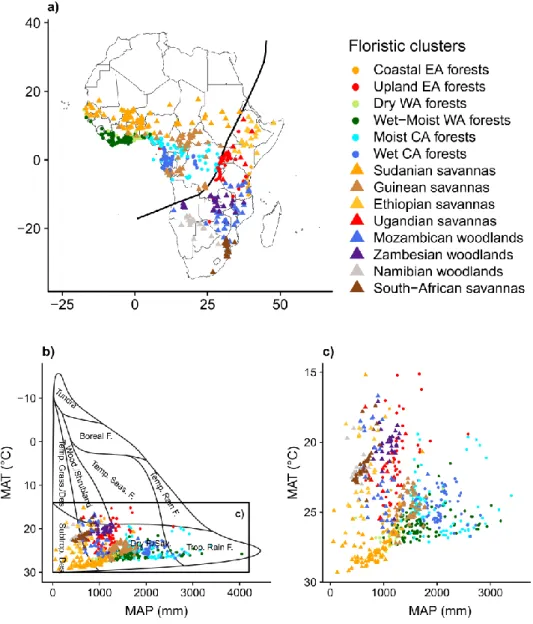
While the majority of the regionalization of African flora was mostly based on herbarium samples or distribution data and might suffer from the false presence artifact in virtual assemblage (Jetz et al. 2008), Fayolle et al. (2014, 2018), proposed new analyses based on collation of data consisting of the largest collection of localized lists of tree species in tropical African forests (Fayolle et al. 2014) and of tree and shrub species in tropical African savannas (Fayolle et al. 2018) in order to identify large-scale variation in woody species composition (i.e., beta diversity). For both forests and savannas, the authors identified a major floristic discontinuity between the North/West/Central and the South/East part of Africa (Figure 1.5a). This floristic discontinuity closely corresponds to the High and Low division of Africa proposed by White (1983), a line drawn from Angola, then following the Albertine Rift, and then north to the west of Ethiopia (Figure 1.5a). Across tropical forests, 6 floristic clusters were identified: Coastal and Upland for East Africa, Dry and Wet-Moist for West Africa, and Moist and Wet for Central Africa (Figure 1.5a). Across savannas, eight floristic clusters were identified and in turn were grouped into two larger macro-units in North/West and South/East of Africa (Figure 1.5a). In the North/West savannas, the floristic was partitioned into the Sudanian (drier) and Guinean (wetter) clusters. Within the highly heterogeneous South/East savannas and woodlands, six clusters were identified: Ugandan, Ethiopian, Mozambican, Zambezian, Namibian and South African.
Figure 1.5 Floristic clusters identified by Fayolle et al. (2014, 2018) across tropical
Africa and plotted in geographical and environmental spaces. The symbols differentiate the clusters assigned to the forest biome (circle) and to the savanna biome (triangle), as originally defined by the authors of the species list collated. (a) Map of the floristic clusters. Each point corresponds to a sample site assigned to a particular floristic cluster. The black line represents the High and Low division of Africa proposed by White (1983), which has been associated with a major floristic discontinuity between the North/West/Central and the South/East part of Africa. (b, c) Environmental space defined by the mean annual precipitation (MAP, in mm) and the mean annual temperature (MAT, in °C) as occupied by sample sites across African forest and savannas an in the original
1.3 The climatic correlates of plant spatial patterns
The association between climate and vegetation are among the earliest ecological observations, dating back to the third century B.C., by Theophrastus in his Enquiry into Plants (Historia Plantarum). At very large scale, climate is implicated as the major driver of vegetation patterning, shaping the structure and the functioning of vegetation. Because of this close relationship, climate-based classification systems have historically been used as proxy for the continental and global biomes patterning (see Box 2016 for a review on the climate-based classifications). For instance, the early works of Köppen (1900) resulted in climatic classification systems that have had a major influence on understanding the global vegetation zonality.
Holdridge (1947) and Whittaker (1970) proposed two simple and consistent bioclimatic systems to infer biome distribution. Holdridge (1947) was the first to create a scheme that positions each biome within an environmental space defined by three climatic axes: temperature, precipitation and potential evapotranspiration. More recently, Whittaker (1970) associated the biome distribution with only two climatic factors: mean annual precipitation and mean annual temperature (Figure 1.5b). These two elementary bioclimatic systems are directly relevant to infer the distribution of biomes, even if the inclusion of information on zonal soils conditions (Walter 1973, Walter & Breckle 1985), or on the historical context of the region and disturbance factors can improve predictions. It has been shown that tropical biomes do not necessarily occupy the same environmental space across continents (see Lehmann et
al. 2014 for savannas, Moncrieff et al. 2015 for a global analysis), suggesting a
significant influence of history on the vegetation response to climatic drivers. In addition, tropical forests and savannas are not rigidly determined by climate and can be in some places alternative stables states, maintained by disturbance factors such as fire and mega-herbivore grazing (Staver et al. 2011).
In tropical Africa, current climate shows clear association with species distribution (Swaine 1996, Bongers et al. 1999) and floristic composition (Fayolle et al. 2014, 2018). Two main climatic gradients are strongly correlated with the distribution of the floristic clusters defined by Fayolle et al. (2014, 2018): precipitation and temperature (Figure 1.5c). Across forests, the variation of tree species composition is principally correlated with rainfall. The East African forests (Coastal and Upland) have a drier climate, typically less than 1500 mm/yr and only about 1000 mm/yr along the east coast. Similarly low annual rainfall is found in the dry West African forests, on the margins of the Dahomey Gap. The major floristic discontinuity between the North/West/Central and the South/East parts of Africa is related to a steep change in elevation and temperature. In the South/East part of Africa, the savanna clusters occupied different temperature ranges with relatively low overlap (Figure 1.5c). Particularly, the Zambezian cluster occupied higher altitude, cooler and moister sites, whereas the Namibian and South-African clusters occupied drier sites than the other
clusters. The Ugandan and Ethiopian clusters both occurred under a wide range of temperatures but were clearly separated along the rainfall gradient.
1.4 The legacy of past climate changes
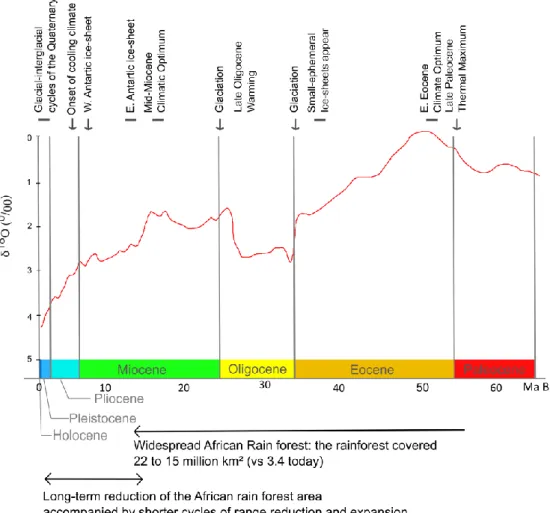
Climate is the first driver of present-day plant distribution and past climate changes are important drivers of plant migration and extinction, with long-lasting impacts on species diversity and composition (Overpeck et al. 1985). Climate fluctuations throughout the Tertiary and Quaternary, as well as tectonic plate movements, have largely determined the dynamics of the distribution of biomes on earth. During much of the last 65 million years, Earth’s climate system has experienced continuous change, drifting from extreme of expansive warmth to extremes of cold with massive continental ice-sheets and polar ice caps (Zachos et al. 2001; Figure 1.5). This long-term climate change has been associated with major shifts in biome distribution, and especially with the long-term range contraction of the tropical forest in Africa (Kissling et al. 2012).
Between 55 Ma and 11 Ma ago, the African tropical forest (wet, moist and dry forests) covered from 22 to 15 million km2. This area dropped to 10 million km2 3 Ma
ago and to 3.4 million km2 today (Kissling et al. 2012). The long-term range
contraction of the forest was accompanied by shorter range re-expansion during interglacial periods (Lézine et al. 2019; Figure 1.7a), especially during the glacial-interglacial cycles of the Quaternary (i.e. 120000 to 12000 years BP). During the cold and arid phases, such as the Last Glacial Maximum (ca. 18000 BP), the wet and moist forests became fragmented while savanna expanded (Figure 1.7a, b). During the interglacial periods, forests re-expanded and eventually formed a nearly continuous block. For instance, throughout the Holocene African humid period (ca. 11000–8000 years BP), the forest extended much further of their present range, the Dahomey Gap (a current coastal savanna corridor about 100 km wide separating the Upper and the Lower Guinea Subcentres, as defined by White (1979), Figure 1.7b) was forested and the Sahara was crossed by lakes and rivers (Watrin et al. 2009, Willis K. J. et al. 2013). At the Late Holocene (ca. 3000 years BP) a general degradation of the rain forest is documented in many pollen records from lake or marsh sediments, coinciding with both the onset of a drier climate and the southern expansion of Bantu farmers (Schwartz et al. 1996, Ngomanda et al. 2009).
Figure 1.6 Sixty-five Ma to Present global deep-sea oxygen records associated with
major climatic events and information of rain forest range reconstruction. D uring much of the last 65 million years, Earth’s climate system has experienced continuous change, drifting from extreme of expansive warmth to extremes of cold. Even if deep water trends are more suitable for high latitude, in the tropics, this long-term climate change has been associated with major shifts in biome distribution, and especia lly with the long-term range contraction of the tropical forest in Africa (Kissling et al. 2012). Adapted from Zachos (2001).
While the current climate is mainly relevant to infer the distribution of floristic assemblage in Africa, the biomes dynamics during these past climate fluctuations have also left an imprint on diversity (Mayr & O’Hara 1986, Maley 1996, Plana 2004, Parmentier et al. 2011, Hardy et al. 2013, Sosef et al. 2017). For instance, across wet and moist forests, high levels of endemism have been detected in several hilly and mountainous regions situated along the Atlantic coast in Lower and Upper Guinea and along the Albertine Rift in the Democratic Republic of Congo (Aubréville 1962,
Linder 2001, Tchouto et al. 2009). These areas have been proposed as candidate forest refugia during the cold and arid phases of the Pleistocene (e.g., Sosef 1994), acting as ‘museums’ by remaining climatologically stable through time and accumulating species gradually and experiencing low rates of extinction (Lovett & Friis 1996).
Past climate changes and associated biomes shifts have also been hypothesized as major drivers of diversification (Ackerly 2003, Donoghue & Edwards 2014). Recent data suggests that the forest refugia were not only ‘museum’ but also acted as major cradles of biodiversity, because the fragmentation of a species range in different refugia favoured allopatric speciation or, at least, genetic differentiation between isolated populations (Hardy et al. 2013, Duminil et al. 2015). As demonstrated for palm species (Blach-Overgaard et al. 2013), the repeated periods of climate warming could have also led to the diversification of several lineages by increasing the opportunity of individuals to adapt to dry and seasonal climates conditions (Donoghue 2008). The extent to which species tracked their native habitat, potentially resulting in species range fragmentation such as recognized for the forest refugia, or adapted as environments have changed is resumed by two crucial evolutionary processes: niche conservatism and niche evolution.
Figure 1.7 Vegetation dynamics during the quaternary glacial periods. (a) Relative
frequencies of pollen during the last 90 ka BO at lake Bambili (Cameroon). Black shading indicates selected taxa versus time. Gray shading shows the same results, multiplied by 10 for highlighting. Gray bands indicate the forest phases. Adapted from Lézine et al. 2019. (b) Reconstruction of the tropical forest range shifts. Current extent (grey) and hypothetical fragmentation during the quaternary glacial periods according to Maley (1996, in red) and Anhuf (2006, in orange). Adapted from Hardy (2013).
2 The evolutionary processes
2.1 The evolutionary responses to environmental shifts
At species level, niche conservatism and niche evolution over time are two crucial processes explaining biogeographical patterns of plant diversity, distribution and composition (Wiens & Donoghue 2004, Wiens & Graham 2005, Donoghue & Edwards 2014). While the fundamental niche describes all the abiotic conditions in which a species can persist and maintain viable population, the realized niche
includes, additionally, constraints arising from interspecific competition (Hutchinson 1978). This set of acceptable conditions is maintained over evolutionary timescale in the case of niche conservatism: the species fail to evolve as the environment changes and instead track their native habitats when the movement is possible. On the contrary, niche evolution, defined as any changes in the niche of a species such as the expansion of the niche breath or the specialization for new conditions, enables a species to disperse into new habitats and climatic regimes, and to persist in changing environment (Wiens & Donoghue 2004, Pearman et al. 2008). Niche evolution could result from changing biotic interactions, influencing the realized niche (Pearman et al. 2008)1.
Across phylogeny, the signal of species niche conservatism is called phylogenetic niche conservatism (PNC) and refers to the expectation that related species will tend to occupy similar environments (Donoghue 2008). Phylogenetic studies generally revealed that ecological niches are more conserved through evolutionary history than expected (e.g. Crisp et al. 2009, Peterson 2011), implying that adaptations to major climate changes have not been accomplished in all lineages. Many clades in angiosperms are mainly restricted to one of few major biomes. For instance, despite the great variety of environment occupied by the Asteraceae, they are largely more common (higher specific richness) in arid conditions than they are in tropical forest (Donoghue 2008). At global scale, niche conservatism is currently employed to explain the latitudinal gradient in species richness, i.e., the decrease of species richness from equator to the poles. The tropical niche conservatism hypothesis explains the greater richness in tropical regions because most groups originated in the tropics and are specialized for tropical climate (Wiens & Donoghue 2004, Donoghue 2008). Despite millions of years of opportunities, these groups have been unable to disperse into temperate regions because they failed to evolve tolerance to frost. The greater time and area available in the tropics has led to the higher richness for most taxa.
Although it is evident that niche conservatism has played a key role in shaping the distribution of diversity, many lineages have managed to adapt to new environments, resulting in a pattern of phylogenetic niche divergence (PND). For example, while it is true that many of tropical plant lineages have failed to adapt to cold and highly seasonal climate, it is also true that a subset of ancestrally tropical plant lineages have succeeded in making this transition, such as the the woody angiosperm clade
Viburnum (Adoxaceae, Schmerler et al. 2012). Simple evidences of niche evolution
1
According to Pearman et al. (2008), studies on niche evolution should, first, be based on the quantification of the fundamental niches and, second, be constrained by the effects of biotic interactions. Given that the fundamental niches can only be estimated using costly manipulative experiments in the field and/or under controlled conditions, these estimates have only been conducted for a few species. In
are also provided because there are ecologically distinctive clades within several families (such as the hyperdiverse Fabaceae and Bignoniaceae families) or because through the most recently biomes are occupied (Donoghue & Edwards 2014). Niche evolution obviously occurs, and may even be the norm under certain circumstances, such as climate changes.
2.2 The move or evolve dilemma
Through environmental changes, such as climate warming, the extent to which the niche of a species is conserved or evolved is function of two key variables: the rate of dispersal and the rate of trait evolution. This principle can be summarized by the sentence: ‘it is easier to move than to evolve, unless it isn’t’ (Donoghue 2008).
In a case of niche conservatism, the species fail to evolve in situ as the environment changes and instead track their native habitats when the movement is possible (species A in Figure 1.8). This scenario is achievable if suitable corridors exist for the dispersion of species and allow them to move into the appropriate regions relatively quickly. The incapacity of some species to adapt to changing conditions combined with limitation in dispersal has probably driven extensive extinctions during dramatic climatic events (species D in Figure 1.8) or led to the contraction and/or the fragmentation of the geographical range of species, as was the case for several African lineages restricted into forest refugia during past climatic events of the Pleistocene. In this case, niche conservatism is expected to be an important and widespread component of allopatric speciation (Wiens 2004). Under the same environment, genetic processes such as genetic drift2 or uniform selection3 can lead to
non-ecological speciation between allopatric populations (Rundell & Price 2009, Sobel et
al. 2010), resulting in PNC.
In the other hand, long-term shifts in climate and the exposure of the population to new environments also increase the adaptive evolution opportunities (Donoghue & Edwards 2014). In a case of niche evolution, the species could adapt to the new conditions (niche evolution, species C-C’ in Figure 1.8). The species could also migrate and evolve (species B and B’ in Figure 1.8), which potentially result in ecological speciation4 when the selection leads to reproductive isolation between
populations (Rundell & Price 2009, Nosil 2012). That’s why, the repeated past climate
2
reproductive isolation between allopatric populations due to alternate mutations fixed by stochastic processes (random changes in the frequency of alleles in a gene pool).
3
allopatric populations experience the same selective environment and evolve by fixing different adaptive mutations, resulting in similar phenotypes but reproductive isolation.
4 the process by which barriers to gene flow evolve between populations as a result of ecologically based divergent
selection between environments. Divergent selection could operate directly on reproductive traits or because traits under divergent selection, or those correlated with them, incidentally effect reproductive selection.
warming during Quaternary have been hypothesized to be major drivers of evolutionary shifts between the forest and savanna biomes.
Figure 1.8 Hypothesized responses of species to climate change. In a case of niche
conservatism, the species migrate and track their native habitat, (species A) or go extinct (species D). In a case of niche evolution, species adapt to the new condition (species C -C’) or might migrate and evolve in situ, potentially resulting in ecological speciation (species B-B’). Figure adapted from Ackerly (2003) and Donoghue & Edwards (2014).
Of course, these scenarios are simplistic and the current pattern of phylogeny certainly results from multiple processes, which probably lie in between the cases mentioned above. For instance, adaptive differentiation can occur after a non-ecological speciation between isolated populations (Rundell & Price 2009). Otherwise, ecological speciation between populations previously isolated may be common because allopatric populations will often occur in environments with subtle differences and experience absence or very low gene flow between them ("habitat isolation"; Rundle & Nosil, 2005).
ecologically adaptive phenotypes (i.e., traits evolution). This second factor is expected to vary enormously from lineage to lineage, with lineages possessing “enabler traits” (sensu Donoghue 2008), predisposing them to make certain ecological transitions. One of the few recognized examples of major ecological evolution is that of the appearance of C4 photosynthesis in grass clades ancestrally originated from tropical
forest understory. Despite the complexity of this adaptation, this ecological evolution has been detected 26 times within the last 10 million years, mostly within a unique clade (Edwards & Smith 2010). Aside from this remarkable case of trait evolution, little is known about the morphological and physiological shifts that allow a particular lineage to disperse in contrasting environments.
2.4 The biome shifts within tropical tree lineages in Africa
As mentioned above, PNC has been identified for many lineages (e.g. Crisp et al. 2009, Peterson 2011) and, comparatively, few niche evolutions have been reported in phylogenetic studies (see Donoghue & Edwards 2014 for a review on biome shifts). In Africa, while some genera have been associated with specific biomes (Linder 2014), evidence of widely distributed genera transcending biome or habitat boundaries have also been reported for herbaceous plants (for palms species see Blach-Overgaard et al. 2010, or for the Coccinia genus Holstein & Renner 2011) and for trees (see the early work of White 1978 on Diospyros, and the more recent genetics studies of Donkpegan 2017 on Afzelia, and Tosso 2018 on Guibourtia). Using the RAINBIO dataset, we identified more than 190 tropical tree genera encompassing both forest and savanna species (Figure 1.9). The evolutionary processes that allowed these particular lineages to disperse and adapt into new environments, transcending biomes boundaries, are far from being resolved. Therefore, within these lineages, dissecting the strategies of the species and understanding the functional traits involved in those strategies could be the strongest evidence for niche evolution and will allow the understanding of the mechanistic underpinnings of ecological transitions (Westoby 1998, Wiens & Donoghue 2004).F ig u r e 1 .9 D is tr ib u tio n in g e o g ra p h ic a l s p a c e a n d in W h it ta k e r‘s b io cli m ati c sc h e m e f o r 1 2 A fr ic a n tr e e g e n e ra tr a n sc e n d in g fo re st a n d s a v a n n a b o u n d a ry . D a ta a re e x tr a c te d f ro m t h e R A IN B IO d a ta se t, a v a ila b le a t h ttp :/ /r a in b io .c e sa b .o rg / .
3 The functional understanding of tropical tree
diversification
3.1 The functional trait approach
The niche, strategy and trait concepts are widely used in evolutionary biology and in plant ecology, with not necessarily the exact same meaning. In plant ecology ‘strategy’ is defined as ‘how a species sustains a population in the presence of competing species, in varied landscapes and under regimes of disturbance’ (Westoby 1998, Reich 2014). The strategy of a plant species is underpinned by trade-offs in resource use: the allocation of limited resources to one purpose vs another. One fundamental axis of evolutionary specialization across ecosystems is that of rapid acquisition of resources at one end of the spectrum and conservative use of resources at the other end (Diaz et al. 2004, Wright et al. 2004, 2010). Plants at the ‘fast’ end of the acquisition-conservation trade-off had high growth potential when resources are available. In contrast, plants at the ‘slow’ end of the trade-off survived better when the resources are scarce. To explain the position of a species on this slow-fast continuum, the role of multiple variations in morpho-physio-phenological plant traits (i.e., the ‘functional traits’ sensu Violle et al. 2007) have been reported for leaves (the leaf economic spectrum, Wright et al. 2004), stem (the stem economic spectrum, Chave et al. 2009) and roots (Bardgett et al. 2014), each viewed independently. Reich (2014) demonstrated the link across organs and coupling among resources, resulting in an integrated whole-plant economics spectrum. Species capable of moving water rapidly have low tissue density, short tissue life span and high rates of resource acquisition and flux at organ and individual scales.
3.2 The drought strategies of tropical trees
The biome shift from forests to drier habitats relies on niche evolution along rainfall and temperature gradients. This suggests adaptation to drought and the adoption of a conservative water use strategy could be important for the success of the plant species. For trees, conservative water use can be achieved through efficient use of limited water (i.e. desiccation tolerance) or through desiccation avoidance (Tyree et al. 2003, Markesteijn & Poorter 2009). The desiccation tolerance strategy is promoted by physiological traits that sustain continued water transport, gas exchange, or cell survival at low water content (WC) and low water potential (Ψ), such as resistance of xylem to embolism, and the ability of cells to remain alive at low WC and Ψ. In contrast, the desiccation delay strategy involves traits that increase access to water and reduce water loss, including deep roots, early stomatal closure, water storage in plant organs, photosynthetic stems and leaf shedding (Westoby et al. 2002, Lachenbruch et al. 2011, Santiago et al. 2016).
In the tropics, the paucity of data on drought resistance strategies, and especially on hydraulics traits has to be noted (see Choat et al. 2007 for available hydraulic data), specifically for African tree species (but see Epila, Maes, et al. 2017 for Maesopsis
eminii (Malvaceae)).
3.3 The wood hydraulics and associated anatomical traits
Sensitivity of xylem to embolism represents an important constraint on tree functioning and survival during drought (Brodribb & Cochard 2009, Urli et al. 2013, O’Brien et al. 2017). Intense drought reduces plant water potential, leading to the embolism of the xylem water column, the cessation of water supply to leaves and finally plant death (i.e. the hydraulic failure, McDowell et al. 2008). Quantifying the resistance of a plant to embolism, by measuring the relationship between xylem pressure and loss of hydraulic conductivity due to conduit occlusion by gas emboli, has been the principal approach to characterize drought resistance in woody species (Choat et al. 2007, 2012, Santiago et al. 2016; Figure 1.11a). Ѱ50, the water potential
at which the xylem experiences 50 % loss of conductivity is the most commonly used index of embolism resistance (Figure 1.10). Low embolism resistance is associated with high transport efficiency and low structural ‘costs’, making this an advantageous acquisitive strategy in highly productive environments (Sperry et al. 2008, Choat et
al. 2012). In a recent publication, Körner (2019) affirmed that xylem embolism is a
byproduct of the disruption of the soil-root capillary continuum, the latter being the main cause of tree death under severe drought. However, the association between critical degree of tree dehydration and the vulnerability of the xylem to embolism is not called into question and the action of evolutionary selection on this traits is emphasized.
Figure 1.10 Embolism resistance (Ѱ50) plotted against mean annual precipitation (MAP)
for 384 angiosperm and 96 gymnosperm species across the world. Ѱ50 is the water
potential at which 50% loss of conductivity occurs. Ѱ50 is the most commonly used index
of embolism resistance. Each point represents one species. Extracted from Choat et al. (2012)
More recently, the used of stored water to supply the transpiration stream and protect xylem from precipitous drops in water potential has emerged as one of the most important aspects of tree hydraulics (Scholz et al. 2011, Vergeynst, Sause, et al. 2015, Epila, Maes, et al. 2017). Tropical trees with high capacitance have been shown to survive drought even with low embolism resistance, because of the buffering role of stored water and the lower risk of reaching the xylem tension that causes hydraulic failure (Meinzer et al. 2004, Sperry et al. 2008, Epila, Maes, et al. 2017, Wolfe 2017). The hydraulic capacitance, defined as the amount of water released from the tissue into the xylem per unit decrease in ψ, is calculated for two distinct phases as the slope of the linear regression between the wood volumetric water content and the water potential Ѱ (i.e. the desorption curve; Vergeynst, Dierick, et al. 2015). The elastic phase or phase I (Figure 1.11b), and the related capacitance, occurs when water is released from the elastic shrinkage of living cells. In contrast, the inelastic phase or phase II (Figure 1.11b) occurs when embolism is strong and water is released from embolized conduits into the still functional ones (Vergeynst, Dierick, et al. 2015, Epila, Baerdemaeker, et al. 2017). In addition to the above-mentioned water flows, a greater focus on the dynamics of the internals water pools may improve the capacity to monitor and anticipate drought-induced mortality (Martinez-Vilalta et al. 2019).
Wood anatomy indeed directly relates to conductivity, xylem safety and hydraulic capacitance (Borchert & Pockman 2005, Lachenbruch & McCulloh 2014, Beeckman 2016). Angiosperms with wide vessels have higher water transport efficiency, but are more vulnerable to embolism (Zanne et al. 2014, Gleason et al. 2016). However, vessel size and abundance only partially explain conductivity and xylem safety (Choat
et al. 2008). The passage of sap flow through the intervessel pits, the vessel cell-wall
reinforcement and the connectivity of the conduit network are at least as important as conduit size and abundance. In addition, the high water storage capacity of parenchyma of the secondary xylem is expected to contribute to hydraulic capacitance together with the conduits (Anderegg & Meinzer 2015, Morris & Jansen 2016, Epila, Maes, et al. 2017).
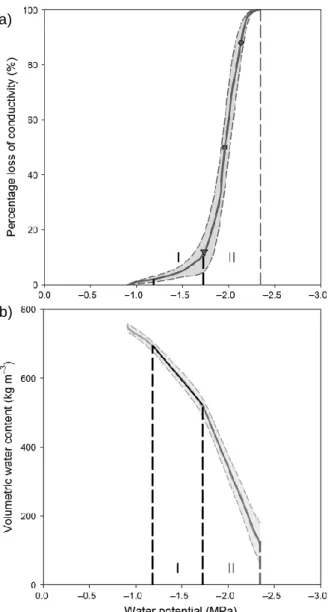
Figure 1.11 Average vulnerability curve (a) and desorption curve (b) of Maesopsis
eminii, an African forest tree species. Average vulnerability curve was obtained by plotting the percentage loss of conductivity against xylem water potential during the bench dehydration experiment. The vulnerability thresholds ψ12 (triangle), ψ50 (square),
ψ88 (circle) and ψ100 (dashed line) are indicated as well. The desorption curve was
obtained by plotting the volumetric wood water content against xylem water potential. Phases I and II are delimited by vertical lines and the slopes within these phases represent elastic and inelastic hydraulic capacitance, respectively. Extracted from Epila, Baerdemaeker, et al. (2017).
a)