Component-resolved-diagnosis and validation of an allergen-microarray
technology.
Romy
Gadisseur
1
, Jean-Paul Chapelle
1
, Etienne Cavalier
1
1 : University Hospital of Liège, Department of Clinical Chemistry, Liège, Belgium;
1. Background:
In the laboratory, the diagnosis of Type I allergy is generally performed by measuring the
specific IgE antibodies (sIgE) using allergen extracts. In the recent years, a large number of
allergens from various sources have been characterized. Indeed, for some sources, a
complex allergen expression pattern has been described. Recombinant allergens can be
used for Component-Resolved-Diagnosis (CRD) of the patients’allergen sensitization
profile, whereas allergen extracts allow us to identify allergen-containing sources. CRD
permits to diagnose the genuine sensitization of patients towards a given allergenic source
or cross-reactive molecules that point to cross-sensitization to several allergen sources.
Recently, microarrays have been developed and allows the determination of sIgE against
103 recombinant or purified allergen components from many different allergen sources in
a single analytical step.
The aim of our study was to establish a comparison of the sIgE results for recombinant
allergens provided by the microarray method with the traditional sIgE measurements
(ImmunoCAP© 250, Phadia, Uppsala, Sweden). Finally, we evaluated the effects of some
patients with a high total IgE rate (
TotIgE) on the ImmunoCAP
©ISAC results.
2. Method:
2.1. Patients.
We selected 86 patients with an anamnesis and a clinical diagnosis of Type
1 allergy on the basis of their sIgE tests for recombinant allergens performed
with the Phadia ImmunoCAP
©250. The sIgE were directed against 55
recombinant or natural purified proteins (Table 1). Secondly, we selected two
patients with a high TotIgE rate (above 10.000 kU/L) to evaluate the
potential unspecific binding of IgE.
2.2. ImmunoCAP
©ISAC determination.
All the samples were screened for an allergen-specific IgE determination
applying the allergen microarray ImmunoCAP
©ISAC according to the
manufacturer’s recommendations.
3. Results
:
•In all, 555 sIgE for recombinant allergens have been performed with ImmunoCAP
©250.
– Three hundred eighty four results out of the 555 were positive (>0,10 kUA/L) with the CAP method and 171 were found negative (<0,10 kUA/L).
•With ImmunoCAP
©ISAC, 302 out of the 384 positive results with CAP
©were also found positive (concordance 78,65 %).
– The mean of the 82 discrepant results measured with the ImmunoCAP© was 0.67±2.06 kUA/L.– We observed that 52 out of the 82 discrepant results were below 0,35 kUA/L, the former cut-off level of ImmunoCAP©250. With this cut-off, the concordance of the positive results was 92,19 % (Table 2).
•Amongst the 171 results found negative with ImmunoCAP
©250, we observed that 160 of them were also found negative with ISAC
©(concordance 93,57 %).
– The mean of those 11 sIgE measured with the ISAC© technique was 1.57±3.56 ISU.
•No unspecific binding was observed up to 150 000 kU/L.
•The discrepancies were more frequently observed with some specific allergens (Table 1).
– Among those allergens for which we often observed negative results with the ImmunoCAP©ISAC method but positive results with ImmunoCAP© 250, we found notably of rAsp f 1 (7 discrepant results out of 14
measurements), rPru p 3 (5 discrepant results out of 13 measurements), nAna c 2 (4 discrepant results out of 11 measurements), Api g 1 (4 discrepant results out of 10 measurements).
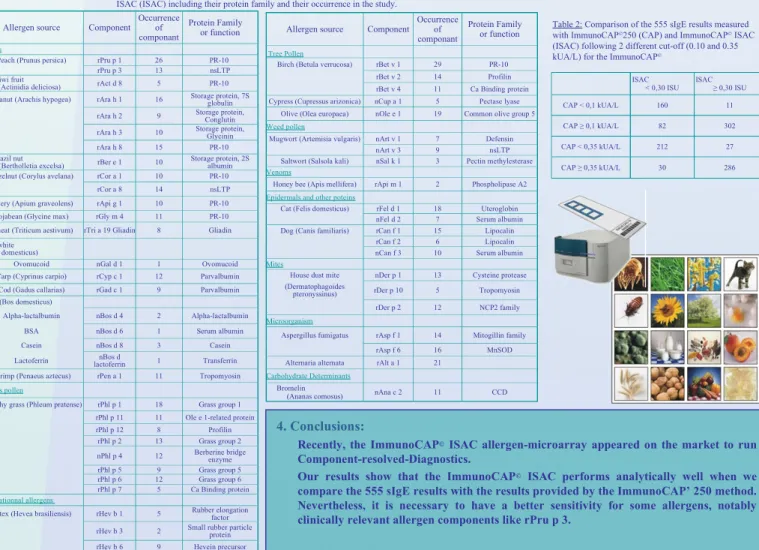
4. Conclusions:
Recently, the ImmunoCAP
©ISAC allergen-microarray appeared on the market to run
Component-resolved-Diagnostics.
Our results show that the ImmunoCAP
©ISAC performs analytically well when we
compare the 555 sIgE results with the results provided by the ImmunoCAP’ 250 method.
Nevertheless, it is necessary to have a better sensitivity for some allergens, notably
clinically relevant allergen components like rPru p 3.
Allergen source
Component
Occurrence
of
componant
Protein Family
or function
Foods
Peach (Prunus persica) rPru p 1 26 PR-10 rPru p 3 13 nsLTP Kiwi fruit
(Actinidia deliciosa) rAct d 8 5 PR-10 Peanut (Arachis hypogea) rAra h 1 16 Storage protein, 7S globulin
rAra h 2 9 Storage protein, Conglutin rAra h 3 10 Storage protein, Glycinin rAra h 8 15 PR-10 Brazil nut
(Bertholletia excelsa) rBer e 1 10 Storage protein, 2S albumin Hazelnut (Corylus avelana) rCor a 1 10 PR-10
rCor a 8 14 nsLTP Celery (Apium graveolens) rApi g 1 10 PR-10 Sojabean (Glycine max) rGly m 4 11 PR-10 Wheat (Triticum aestivum) rTri a 19 Gliadin 8 Gliadin Egg white
(Galus domesticus)
Ovomucoid nGal d 1 1 Ovomucoid Carp (Cyprinus carpio) rCyp c 1 12 Parvalbumin Cod (Gadus callarias) rGad c 1 9 Parvalbumin Cow (Bos domesticus)
Alpha-lactalbumin nBos d 4 2 Alpha-lactalbumin
BSA nBos d 6 1 Serum albumin
Casein nBos d 8 3 Casein
Lactoferrin lactoferrinnBos d 1 Transferrin Shrimp (Penaeus aztecus) rPen a 1 11 Tropomyosin
Grass pollen
Timothy grass (Phleum pratense) rPhl p 1 18 Grass group 1 rPhl p 11 11 Ole e 1-related protein rPhl p 12 8 Profilin
rPhl p 2 13 Grass group 2 nPhl p 4 12 Berberine bridge enzyme rPhl p 5 9 Grass group 5 rPhl p 6 12 Grass group 6 rPhl p 7 5 Ca Binding protein
Occupationnal allergens
Latex (Hevea brasiliensis) rHev b 1 5 Rubber elongation factor rHev b 3 2 Small rubber particle protein rHev b 6 9 Hevein precursor rHev b 8 6 Profilin rHev b 11 1 Chitinase
Allergen source
Component
Occurrence
of
componant
Protein Family
or function
Tree Pollen
Birch (Betula verrucosa) rBet v 1 29 PR-10 rBet v 2 14 Profilin rBet v 4 11 Ca Binding protein Cypress (Cupressus arizonica) nCup a 1 5 Pectase lyase
Olive (Olea europaea) nOle e 1 19 Common olive group 5
Weed pollen
Mugwort (Artemisia vulgaris) nArt v 1 7 Defensin
nArt v 3 9 nsLTP
Saltwort (Salsola kali) nSal k 1 3 Pectin methylesterase
Venoms
Honey bee (Apis mellifera) rApi m 1 2 Phospholipase A2
Epidermals and other poteins
Cat (Felis domesticus) rFel d 1 18 Uteroglobin nFel d 2 7 Serum albumin Dog (Canis familiaris) rCan f 1 15 Lipocalin
rCan f 2 6 Lipocalin nCan f 3 10 Serum albumin
Mites
House dust mite nDer p 1 13 Cysteine protease (Dermatophagoides
pteronyssinus) rDer p 10 5 Tropomyosin rDer p 2 12 NCP2 family
Microorganism
Aspergillus fumigatus rAsp f 1 14 Mitogillin family
rAsp f 6 16 MnSOD
Alternaria alternata rAlt a 1 21
Carbohydrate Determinants
Bromelin
(Ananas comosus) nAna c 2 11 CCD
Table 1: Classification of the 555 sIgE measured with ImmunoCAP©250 (CAP) and ImmunoCAP©
ISAC (ISAC) including their protein family and their occurrence in the study.
Table 2: Comparison of the 555 sIgE results measured
with ImmunoCAP
©250 (CAP) and ImmunoCAP
©ISAC
(ISAC) following 2 different cut-off (0.10 and 0.35
kUA/L) for the ImmunoCAP
©ISAC
< 0,30 ISU ISAC ≥ 0,30 ISU CAP < 0,1 kUA/L 160 11
CAP ≥ 0,1 kUA/L 82 302
CAP < 0,35 kUA/L 212 27 CAP ≥ 0,35 kUA/L 30 286