Colonization Credit in Restored Wet Heathlands
Sara Cristofoli,1Julien Piqueray1, Marc Dufrêne,2 Jean-Philippe Bizoux,1 and Grégory Mahy11 Gembloux Agricultural University, Laboratory of Ecology, Passage des Déportés 2, B-5030 Gembloux, Belgium
2 Ministère de la Région Wallonne, Centre de Recherche de la Nature, des Forêts et du Bois, Avenue Maréchal Juin 23, B-5030 Gembloux,
Belgium
Abstract: Although human-driven landscape modification is generally characterized by habitat destruction and
fragmentation, it may also result in the creation of new habitat patches, providing conditions conducive to spontaneous colonization. In this article, we propose the concept of "colonization credit" (i.e., the number of species yet to colonize a patch, following landscape changes) as a framework to evaluate the success of colonization, in terms of species richness, in new/restored habitats, taking into account the spatial structure of landscapes. The method mirrors similar approaches used to estimate extinction debt in the context of habitat fragmentation, that is, comparisons, between old and new habitat patches, of the relationships among spatial patch metrics and patch species richness. We applied our method to the case of spontaneous colonization of newly created habitat patches suitable for wet heathland plant communities in South Belgium. Colonization credit was estimated for the total species richness, the specialist species richness, and the species richness of three emergent groups (EGs) of specialist species, delineated on the basis of dispersal traits. No significant colonization credit was identified either in patches created 25-55 years ago or in those created within the past 25 years, with the exception of species from our first EG (mostly anemochorous species with long-term persistent seed bank). However, the differential response of species in that first EG could not be explained through their characteristic life history traits. The results of this study are encouraging and suggest that deliberate, directed restoration activities could yield positive developments in a relatively short period of time.
Key words: colonization credit, habitat restoration, heath-lands, life history traits, plant species richness.
Introduction
Anthropogenic activities are currently the primary drivers behind landscape and hence, biodiversity dynamics (Baudry & Tatoni 1993; Jongman 2002). A common characteristic of human-driven landscapes is the destruction and fragmentation of natural and seminatural habitats (Saunders et al. 1991). Such fragmentation is expected to increase the risk of extinction in remnant populations due to population size reduction and/or low colonization rates and, as a result, to affect species diversity (Saunders et al. 1991; Fahrig & Merriam 1994; Young & Clarke 2000). However, in a human-driven landscape, changing conditions may also give threatened species an opportunity to recover. Dynamics within these landscapes may include the creation of new habitat patches, encouraging conditions that are conducive to spontaneous colonization by species from natural or seminatural habitats and hence allowing for the potential extension of isolated populations (Krüger et al. 2002). This situation may be represented by locations resulting from undirected management such as road sides (Quintana-Ascencio et al. 2007), abandoned quarries and mining sites (Krüger et al. 2002; Bizoux et al. 2004), and forest clearings (Collins et al. 1985) as well as by directed restorations. Understanding how far, and how fast, species will travel to colonize the newly created habitat patches, as well as the underlying processes involved, is crucial for the understanding and management of biodiversity. A large body of studies dedicated to evaluating the colonization success in new or restored habitats have focused, first, on a local scale, that is, how species diversity relates to site management (e.g., Cullen & Wheater 1993; Bossuyt et al. 2001; Kiehl et al. 2006) and, more recently, on the qualitative effect of landscape spatial structure surrounding newly created habitat patches (Jacquemyn et al. 2003; Vellend 2003; Verheyen et al. 2006). Those studies highlighted that the probability for a species to establish depends on its presence in the local or regional species pool and on environmental filters such as landscape structure, biotic interactions (e.g., presence of dispersal agents), the ability of newly arrived seeds to germinate, and the longevity of the soil seed bank (as reviewed by Bakker & Berendse 1999). A methodology that aims to quantitatively evaluate the success of colonization, in an explicit spatial context, would be especially relevant to activities associated with the restoration of ecological networks (Jongman & Pungetti 2004).
In this article, we propose a methodology for evaluating colonization success in newly created patches, using species richness in a spatially explicit context, in reference to a regional species pool. This process was derived from reverse dynamics theories and models, that is, loss of patch area and subsequent extinction debt. Extinction debt theory postulates that, following habitat loss, a survival threshold area exists, which is crossed by some species but, due to the time lag in the response to environmental change, these species have not yet been extirpated from the affected habitat (Tilman et al. 1994; Hanski & Ovaskainen 2002). A mirror hypothesis may
be postulated in the case of colonization of newly created habitat patches: new patches of habitat may exhibit a
"colonization credit" in comparison to old patches due to the time lag for species dispersal, that is, the length of
time it takes new species to move into new habitat patches. The colonization credit is defined herein as the number of species yet to colonize a patch, following landscape changes, until the patch reaches the equilibrium between species richness and patch spatial properties.
Species differ in dispersal ability and may therefore be expected to respond differently to colonization opportunities. However, due to considerable differences in the regional species pool, studying each species individually may result in site-specific results not transferable to other areas (Adriaens et al. 2006). Trade-offs between seed attributes, linked to both space and time dispersal (e.g., seed production, seed size, seed bank persistence, seed dispersal vector), have been reported (e.g., Eriksson & Jakobsson 1998; Moles & Westoby 2006). As a result, comparing species with a similar combination of traits would be more pertinent than comparing species based solely on individual traits. Hence, to detect plant characteristics that favor or hamper the colonization process, an emergent group (EG) (i.e., a set of species that share similar life history trait combinations) approach can be useful (Lavorel et al. 1997).
Heathlands are good case study sites for the assessment of the colonization dynamics in restored habitats in fragmented landscapes. On the one hand, those open habitats have been highly fragmented in Western Europe since the end of the nineteenth century due to abandonment of traditional agropastoral practices (mowing, extensive grazing, sod cutting), agriculture intensification, and natural or anthropic reforestation. On the other hand, due to specific forest management practices, vegetative cover may shift from woody type to open habitat dominated by grasses and herbaceous forbes. Moreover, their status as one of the main (semi-) natural landscapes in Western Europe (Webb 1998), and refugia for unique plant and animal species, makes them valuable from a conservation standpoint (Gimmingham 1972; Michael 1996) and has fostered restoration programs.
In this study, we used vascular plant communities of wet heathlands and closely associated habitats in the High Ardenne, Belgium, to address questions of how species richness may be restored in newly created habitat patches. For this purpose, we developed a method to test for a colonization credit in newly created habitat patches. Our specific goals were to (1) quantify a potential colonization credit in newly-created habitat patches suitable for wet heathland plant communities by relating species richness estimates to patch spatial configuration and (2) investigate whether the extent of the colonization credit is related to combinations of species dispersal traits by the use of EGs.
Methods Study Sites
The study region covers an area of 797 km2 (lat 50°N, long 5°E) including two plateaus at the highest altitudes in Belgium (Plateau de Saint-Hubert and Plateau des Tailles, 400-650 m above sea level.). This region hosts one of the last significant aggregations of boglands, poor fens, and wet heathlands in Belgium, which are the target habitats of this investigation. This complex of habitats is restricted to nutrient poor, relatively acid and poorly drained environments (Gimmingham 1972; Manneville et al. 1999). The distinction between the three habitats mainly relies on peat depth, depending on the soil moisture regime. Wet heathlands develop on mineral soils with high phreatic fluctuations (<10 cm peat), poor fens on soils with temporary or almost permanent floods (20-80 cm peat), and boglands on soils with suboutcropped perched water table (>1 m peat). Due to the continuous variation of environmental conditions, target habitats are, in fact, generally closely associated in mosaics and form a complex of habitats hardly separable. Nevertheless, those habitat mosaics are restricted to limited spatial areas within well-defined patches surrounded by forests and intensive meadow. In the study region, Spruce (Picea abies [L.] Karst) was intensively planted since the end of the nineteenth century (Clicheroux 1985), resulting in an important fragmentation of (semi-) natural habitats. However, forest clearing in less productive areas has been promoted over several years either because conditions were judged less than ideal for wood production or for nature conservation purposes. Assuming abiotic conditions meet the requirements of the target communities (see below), those newly created habitat patches (clear-cut) present colonization opportunities for species. It is understood that colonization process was not subjected to human intervention. Since the abandonment of traditional agropastoral practices, no management actions were undertaken on those patches.
Patch Configuration and History
To quantitatively estimate the colonization credit, we used a method inspired by Helm et al. (2006), whereby the relationships between patch spatial metrics and species richness for two groups of patches were compared; in our case, the two groups were old and new habitat patches (Fig. 1). Old habitat patches were patches historically present, on the basis of a reference date, in the landscape.
Figure 1: Location of the study area in Belgium and on the Plateau de Saint-Hubert (a) and Plateau des Tallies (b). The surveyed patches greater than 55 years, approximately 25-55, and less than 25 years old are displayed
in black, light gray, and white, respectively.
They serve as a reference to evaluate restoration success in newly created patches. Because those old patches were present in the landscape for a long period, we can postulate that they provide the situation closest to equilibrium for relationships between patch spatial configuration and species diversity. New patches were habitat patches suitable for wet heathland plant communities created since the reference date. Hence, the estimation of a colonization credit required that we (1) identified patches currently suitable for target habitat development in the landscape, (2) distinguished between old patches and new patches, and (3) determined current patch metrics among the selected patches. Recent habitat maps (2002, 2004; 1:10,000) produced by the regional Research Center for Nature, Forest and Wood were used to identify existing patches of the target habitats within the study area. All patches were digitized using ArcGIS 8.3 (ESRI 2002). The study was completed on 59 patches. We used detailed older topographic maps with land use information (1950s and 1980s, 1:20,000 and 1:10,000, respectively, National Geographical Institute, Bruxelles) to confirm that patches were (1) present before the 1950s (old patches), (2) created between the 1950s and the 1980s (new patches approximately 25-55 years old), or (3) created after the 1980s (new patches <25 years old). Separating new patches by dates allowed us to test for a difference in the level of the colonization credit in relation to the colonization time lags (i.e., approximately 25-55 years old and <25 years old). To verify abiotic conditions for target communities were met in new patches, a potential habitat map was created on the basis of soil properties (derived from the Walloon digital soil map, FUSAGx 2004) and altitude. It is hereafter understood that a new patch is located inside potential areas. In addition, and because target habitats underwent an important fragmentation process, we characterized the evolution of old patches area/connectivity before the 1950s, using topographic maps from the 1770s and the 1880s (1:25,000 and 1:20,000, respectively, National Geographical Institute, Bruxelles).
To assess present patch configuration, we used patch area and connectivity. Patch area was directly derived from the geographical information system (GIS). Patch connectivity was computed with Hanski's IFM (Incidence Function Model) (Hanski 1994), using edge
account distances to (dij) and the area of (
Nieminen 2002). Because the species diversity measured (Tremlovà & Münzbergov
the focal patch area (At) (Moilanen & Nieminen 2002):
IFM and S calibration parameters were selected following Moilanen and Nieminen (2002) recomm following values commonly used in recent plant
2000; Kolb & Diekmann 2005; Adriaens et al. 2006; Lind connectivity metrics and species rich
Because species diversity within a patch may also be linked to environmental heterogeneity of the patch (Harner & Harper 1976), we also used a measure of diversity of soil conditions as in
richness. Soil diversity was measured with the Shannon's Diversity Index (Shannon & Weaver 1949), taking into account the relative surface of the different soil types identified on the basis of the Walloon digital soil (FUSAGx 2004). The soil classification was simplified; soil types were combined from a functional standpoint into 10 classes based on depth of peat and drainage.
Plant Species Richness and EGs
Plant species richness at each of the 59 selected patches
complete inventory of the vascular plants. Nomenclature followed Lambinon et al. (1992). From the 169 species recorded, we identified 48 specialist species of the target habitats on the basis of (1) regional
plant communities (Lebrun et al. 1949; Noirfalise & Vanesse 1976; Duvigneaud 2001) and (2) the judgment of experts.
To delineate EGs, using only specialist species, six plant life history traits were selected (Table 1). As trade among life history traits are frequent (e.g. Rees 1993; Ehrl
reduced number of traits. Traits were chosen in order to characterize species dispersal abilities (spatial and temporal) because we were interested in t
characteristics (weight, dispersal agent, and seed bank persistence), we also took into account the breeding system and clonal reproduction, both of which help determine dispersal cap
regional scale (Eriksson & Jakobsson 1998). Life span was not included in the study because all specialist species were perennials. Trait values were taken from the scientific literature and databases (Fitter & Peat 1994; Hodgson et al. 1995; Bastin et al. 1996; Klotz et al. 2002). On average, 95% of the trait values were available per species. Because evaluation of the colonization credit is based on the relationships between species richness of each EG and patch metrics (see below), we decided that only life history traits exhibiting a strong correlation with these metrics should be kept to delineate EGs. We made the hypothesis that the species richness of old patches was closer to equilibrium with patch metrics than the
Consequently only old patches were used in the subsequent analysis. Using a redundancy analysis (RDA), we tested for a linear relationship between a matrix containing the number of occurrences of each life history t categories at each patch (depending on the species found in the patch) and a matrix containing explanatory spatial and soil metrics at each patch. To deal with plant life history traits expressed by more than a single category (dispersal agent), categories were coded in a binary fashion and treated independently in the RDA. Only life history traits for which categories were explained at a level of at least 20% by patch metrics were kept for further analysis.
Additional analysis was similar to that desc
using the Sokal and Sneath coefficient of similarity (Sneath & Sokal 1972) based on species life history traits. Patch coordinates on the first six axes of a Principal Coordinates Analysi
were used for the K-means nonhierarchical clustering method (MacQueen 1967) to delineate EGs of species (the sixth axis corresponding to the inflection point of the axes eigenvalues). The contribution of each plant life history trait to the clustering was analyzed with the chi
guration, we used patch area and connectivity. Patch area was directly derived from the geographical information system (GIS). Patch connectivity was computed with Hanski's IFM (Incidence Function Model) (Hanski 1994), using edge-to-edge distances between all patches. This metric takes into and the area of (Aj) all possible source populations in the landscape (Moilanen &
Nieminen 2002). Because the species diversity-isolation relationships may be sensitive to the way connectivity nzbergovà 2007), a second connectivity measure (S) was used.
(Moilanen & Nieminen 2002):
calibration parameters were selected following Moilanen and Nieminen (2002) recomm used in recent plant community studies: α = 1 ,b = 0.5, and
005; Adriaens et al. 2006; Lindborg 2007). The general relationships among connectivity metrics and species richness were not modified by using lower α values (results not shown).
Because species diversity within a patch may also be linked to environmental heterogeneity of the patch (Harner & Harper 1976), we also used a measure of diversity of soil conditions as independent variable to explain species richness. Soil diversity was measured with the Shannon's Diversity Index (Shannon & Weaver 1949), taking into account the relative surface of the different soil types identified on the basis of the Walloon digital soil (FUSAGx 2004). The soil classification was simplified; soil types were combined from a functional standpoint into 10 classes based on depth of peat and drainage.
Plant species richness at each of the 59 selected patches was assessed during the summer of 2006 through a complete inventory of the vascular plants. Nomenclature followed Lambinon et al. (1992). From the 169 species recorded, we identified 48 specialist species of the target habitats on the basis of (1) regional
plant communities (Lebrun et al. 1949; Noirfalise & Vanesse 1976; Duvigneaud 2001) and (2) the judgment of
To delineate EGs, using only specialist species, six plant life history traits were selected (Table 1). As trade ng life history traits are frequent (e.g. Rees 1993; Ehrlén & van Groenendael 1998), we only selected a reduced number of traits. Traits were chosen in order to characterize species dispersal abilities (spatial and temporal) because we were interested in the potential for colonization of recent patches. In addition to diaspore characteristics (weight, dispersal agent, and seed bank persistence), we also took into account the breeding system and clonal reproduction, both of which help determine dispersal capacity and subsequent survival on a Jakobsson 1998). Life span was not included in the study because all specialist species were perennials. Trait values were taken from the scientific literature and databases (Fitter & Peat 1994; Hodgson et al. 1995; Bastin et al. 1996; Klotz et al. 2002). On average, 95% of the trait values were available per species. Because evaluation of the colonization credit is based on the relationships between species richness of (see below), we decided that only life history traits exhibiting a strong correlation with these metrics should be kept to delineate EGs. We made the hypothesis that the species richness of old patches was closer to equilibrium with patch metrics than the species richness of more recent patches. Consequently only old patches were used in the subsequent analysis. Using a redundancy analysis (RDA), we tested for a linear relationship between a matrix containing the number of occurrences of each life history t categories at each patch (depending on the species found in the patch) and a matrix containing explanatory spatial and soil metrics at each patch. To deal with plant life history traits expressed by more than a single ories were coded in a binary fashion and treated independently in the RDA. Only life history traits for which categories were explained at a level of at least 20% by patch metrics were kept for
Additional analysis was similar to that described by Adriaens et al. (2006). A species distance matrix was built using the Sokal and Sneath coefficient of similarity (Sneath & Sokal 1972) based on species life history traits. Patch coordinates on the first six axes of a Principal Coordinates Analysis (PCoA) made on the distance matrix means nonhierarchical clustering method (MacQueen 1967) to delineate EGs of species (the sixth axis corresponding to the inflection point of the axes eigenvalues). The contribution of each plant life history trait to the clustering was analyzed with the chi-square statistic.
guration, we used patch area and connectivity. Patch area was directly derived from the geographical information system (GIS). Patch connectivity was computed with Hanski's IFM (Incidence all patches. This metric takes into all possible source populations in the landscape (Moilanen & isolation relationships may be sensitive to the way connectivity is ) was used. S weights the IFM by
calibration parameters were selected following Moilanen and Nieminen (2002) recommendations and 0.5, and c = 0.3 (e.g., Bruun borg 2007). The general relationships among
values (results not shown). Because species diversity within a patch may also be linked to environmental heterogeneity of the patch (Harner
dependent variable to explain species richness. Soil diversity was measured with the Shannon's Diversity Index (Shannon & Weaver 1949), taking into account the relative surface of the different soil types identified on the basis of the Walloon digital soil map (FUSAGx 2004). The soil classification was simplified; soil types were combined from a functional standpoint
was assessed during the summer of 2006 through a complete inventory of the vascular plants. Nomenclature followed Lambinon et al. (1992). From the 169 species recorded, we identified 48 specialist species of the target habitats on the basis of (1) regional classification of plant communities (Lebrun et al. 1949; Noirfalise & Vanesse 1976; Duvigneaud 2001) and (2) the judgment of
To delineate EGs, using only specialist species, six plant life history traits were selected (Table 1). As trade-offs n & van Groenendael 1998), we only selected a reduced number of traits. Traits were chosen in order to characterize species dispersal abilities (spatial and he potential for colonization of recent patches. In addition to diaspore characteristics (weight, dispersal agent, and seed bank persistence), we also took into account the breeding acity and subsequent survival on a Jakobsson 1998). Life span was not included in the study because all specialist species were perennials. Trait values were taken from the scientific literature and databases (Fitter & Peat 1994; Hodgson et al. 1995; Bastin et al. 1996; Klotz et al. 2002). On average, 95% of the trait values were available per species. Because evaluation of the colonization credit is based on the relationships between species richness of (see below), we decided that only life history traits exhibiting a strong correlation with these metrics should be kept to delineate EGs. We made the hypothesis that the species richness of old species richness of more recent patches. Consequently only old patches were used in the subsequent analysis. Using a redundancy analysis (RDA), we tested for a linear relationship between a matrix containing the number of occurrences of each life history trait categories at each patch (depending on the species found in the patch) and a matrix containing explanatory spatial and soil metrics at each patch. To deal with plant life history traits expressed by more than a single ories were coded in a binary fashion and treated independently in the RDA. Only life history traits for which categories were explained at a level of at least 20% by patch metrics were kept for
ribed by Adriaens et al. (2006). A species distance matrix was built using the Sokal and Sneath coefficient of similarity (Sneath & Sokal 1972) based on species life history traits. s (PCoA) made on the distance matrix means nonhierarchical clustering method (MacQueen 1967) to delineate EGs of species (the sixth axis corresponding to the inflection point of the axes eigenvalues). The contribution of each plant life
MINITAB 14.0 (Minitab 2000) was used to build the distance matrix and for the K-means clustering method; RDA and PCoA were completed using Canoco 4.5 (Ter Braak & Smilauer 2002). A list of specialist species' life history traits can be found in Appendix S1.
Table 1: List of life history traits used to classify specialist species of the complex of wet heathland in this study.
Plant Trait Trait Categories
Breeding system (1) allogamous, (2) autogamous, (3) mixed mating system
Reproduction type (1) mixed propagation, (2) mostly vegetative, (3) mostly by seed
Diaspore type (1) fruit, (2) seed
Diaspore weight (g) (1) less than 0.1, (2) 0.1-0.5, (3) more than 0.5
Seed bank type (1) long-term persistent (>5 yr),(2) short-term persistent (1-5 yr), (3) transient (<1 yr)
Dispersal agent (1) unspecialised, (2) anemochory, (3) hydrochory, (4) zoochory, (5)
myrmechory
Estimation of the Colonization Credit
Because relationships between the different species richness types and patch metrics were not significantly different between both plateaus (results not shown), data were combined into a single dataset for further analysis. Estimation of the colonization credit was based on the comparisons of patch metrics-species richness relationships for old (>55 years old) and new patches (considering independently approximately 25- to 55-year-old patches and <25-year-55-year-old patches).
Colonization credit was estimated for the total species richness (RTOT), the specialist species richness (RSPEC),and the species richness of the EGs (EG I-III). In our method, species richness was fitted with the four patch metrics (area, IFM, S, and soil diversity) through simple linear regression. This was done independently for new and old patches and for the different estimates of species richness. Two models were selected on the basis of coefficients of determination (r2): one for new patches and one for old patches (Fig. 2). Model criteria were that both models should (1) be built with the same independent variable, (2) not exhibit nonnormality or heteroscedasticity of residuals at a 5% significance level, and (3) exhibit the lowest possible p value for determination of the significance of the regression model. Parallelism between regression lines of the two models was tested using a general linear model (GLM). Nonparallelism would indicate that species richness responded differently to patch metrics for new and old patches. If the parallelism was accepted, a perfect parallelism between both straight regression lines was forced. The distance between the two regression lines was estimated (GLM), providing a measure of the colonization credit (Fig. 2). The selected independent variable was set as covariable in the model.
Results
Patch Configuration and History
Patch area varied from 0.22 to 94.25 ha. Twenty-six out of 59 studied patches were created after the 1980s (<25 years old). Sixteen out of 59 patches were created between the 1950s and the 1980s (approximately 25-55 years old). Seventeen out of 59 patches were already present in 1950s (old patches). Whatever reference date was used, new patches were significantly smaller and more isolated than old patches (Table 2). Old patches underwent fragmentation primarily between the 1770s and the 1880s (mean area loss 98.7%). Since the 1880s, however, old patch area was more stable: we recorded a further decline of 0.8% from the 1880s until present day (results not shown).
Figure 2: Illustration of the method used to estimate colonization credit. Two linear regression models between species richness and the selected patch/landscape metric (independent variable) were built: one for
and one for new patches. When parallelism between regression l
and the colonization credit is estimated by the intercept differences.
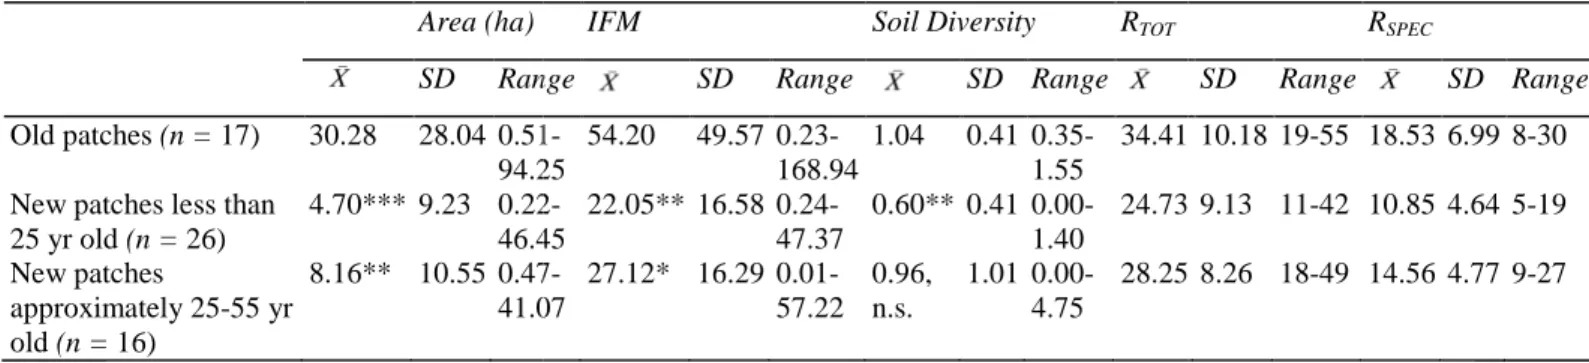
Table 2: Comparison of mean area, IFM, and soil diversity, as well as total (R
richness between old patches (>55 years old) and new patches less than 25 years old (i.e., with the 1980s as reference date) or new patches approximately 25
Area (ha)
SD Range
Old patches (n = 17) 30.28 28.04 0.51 94.25 New patches less than
25 yr old (n = 26) 4.70*** 9.23 0.22 46.45 New patches approximately 25-55 yr old (n = 16) 8.16** 10.55 0.47 41.07
n.s. indicates p≥ 0.05. p values were obtained from an analysis of variance 0.001; ** p < 0.01; *p < 0.05.
Plant Species Richness and EGs
Using the 1980s as the reference date, specialist species richness averaged 10.85 species per new patches (<25 years old) and 18.53 per old patches. Using the 1950s as the reference date, new patches (approximately 25 years old) hosted a mean of 14.56 species (Table 2).
The total variability of life history traits explained by all patch metrics reached 48.0% (
canonical axes resulting from the RDA. The explained variance of life history trait categories ranged from 26.6 to 73.3%. All plant life history traits and categories were, therefore, kept for subsequent analysis. After a thorough examination of different cutt
reproducing by seeds or by a combination of asexual and sexual propagation, with small diaspores mainly dispersed by anemochory and forming persistent seed banks, including most of grass
species with a low potential of strict vegetative reproduction, heavy diaspores dispersed in an unspecialized way or by zoochory, hydrochory; these were mainly of the
vegetative or mixed reproduction strategies. For those relying on seed reproduction, most have a mixed mating system (none are strict allogamous). Zoochory is a commonly used dispersal method.
species were clustered in this third group.
Estimation of the Colonization Credit
Patch area was selected to test for differences of species richness between new and old patches in all cases, at the exception of RTOT for which the metric
stronger relationship to the selected patch metrics than did new patches. Depending on species richness estimates, the proportion of variation in species richness explained by the selected metric (
method used to estimate colonization credit. Two linear regression models between species richness and the selected patch/landscape metric (independent variable) were built: one for
When parallelism between regression lines is accepted, a perfect parallelism is forced, and the colonization credit is estimated by the intercept differences.
Comparison of mean area, IFM, and soil diversity, as well as total (RTOT) and specialist
old patches (>55 years old) and new patches less than 25 years old (i.e., with the 1980s as reference date) or new patches approximately 25-55 years old (1950s).
IFM Soil Diversity RTOT
Range SD Range SD Range
0.51-94.25 54.20 49.57 0.23-168.94 1.04 0.41 0.35-1.55 34.41 0.22-46.45 22.05** 16.58 0.24-47.37 0.60** 0.41 0.00-1.40 24.73 0.47-41.07 27.12* 16.29 0.01-57.22 0.96, n.s. 1.01 0.00-4.75 28.25
values were obtained from an analysis of variance comparing each parameter between old and new patches. ***
Using the 1980s as the reference date, specialist species richness averaged 10.85 species per new patches (<25 per old patches. Using the 1950s as the reference date, new patches (approximately 25 years old) hosted a mean of 14.56 species (Table 2).
The total variability of life history traits explained by all patch metrics reached 48.0% (
nical axes resulting from the RDA. The explained variance of life history trait categories ranged from 26.6 to 73.3%. All plant life history traits and categories were, therefore, kept for subsequent analysis. After a thorough examination of different cutting levels, three EGs were retained (Table 3). EG I contained species reproducing by seeds or by a combination of asexual and sexual propagation, with small diaspores mainly dispersed by anemochory and forming persistent seed banks, including most of grass species. EG II included species with a low potential of strict vegetative reproduction, heavy diaspores dispersed in an unspecialized way or by zoochory, hydrochory; these were mainly of the Carex genus. EG III was composed of plants with xed reproduction strategies. For those relying on seed reproduction, most have a mixed mating system (none are strict allogamous). Zoochory is a commonly used dispersal method.
species were clustered in this third group.
the Colonization Credit
Patch area was selected to test for differences of species richness between new and old patches in all cases, at the for which the metric S was selected (Table 4). Species richness of old patches showed a relationship to the selected patch metrics than did new patches. Depending on species richness estimates, the proportion of variation in species richness explained by the selected metric (
method used to estimate colonization credit. Two linear regression models between species richness and the selected patch/landscape metric (independent variable) were built: one for old patches ines is accepted, a perfect parallelism is forced, and the colonization credit is estimated by the intercept differences.
) and specialist (RSPEC)species
old patches (>55 years old) and new patches less than 25 years old (i.e., with the 1980s as 55 years old (1950s). RSPEC SD Range SD Range 10.18 19-55 18.53 6.99 8-30 9.13 11-42 10.85 4.64 5-19 8.26 18-49 14.56 4.77 9-27
comparing each parameter between old and new patches. ***p <
Using the 1980s as the reference date, specialist species richness averaged 10.85 species per new patches (<25 per old patches. Using the 1950s as the reference date, new patches (approximately 25-55
The total variability of life history traits explained by all patch metrics reached 48.0% (p = 0.020) for all nical axes resulting from the RDA. The explained variance of life history trait categories ranged from 26.6 to 73.3%. All plant life history traits and categories were, therefore, kept for subsequent analysis. After a ing levels, three EGs were retained (Table 3). EG I contained species reproducing by seeds or by a combination of asexual and sexual propagation, with small diaspores mainly species. EG II included species with a low potential of strict vegetative reproduction, heavy diaspores dispersed in an unspecialized way genus. EG III was composed of plants with xed reproduction strategies. For those relying on seed reproduction, most have a mixed mating system (none are strict allogamous). Zoochory is a commonly used dispersal method. Juncus and Vaccinium
Patch area was selected to test for differences of species richness between new and old patches in all cases, at the was selected (Table 4). Species richness of old patches showed a relationship to the selected patch metrics than did new patches. Depending on species richness estimates, the proportion of variation in species richness explained by the selected metric (r2), using the 1980s as
the reference date, ranged from 8.7 to 26.9% for new patches (<25 years old) and from 44.1 to 59.9% for old patches. Using the 1950s as the reference date, new patches (approximately 25-55 years old) had an r2 range of
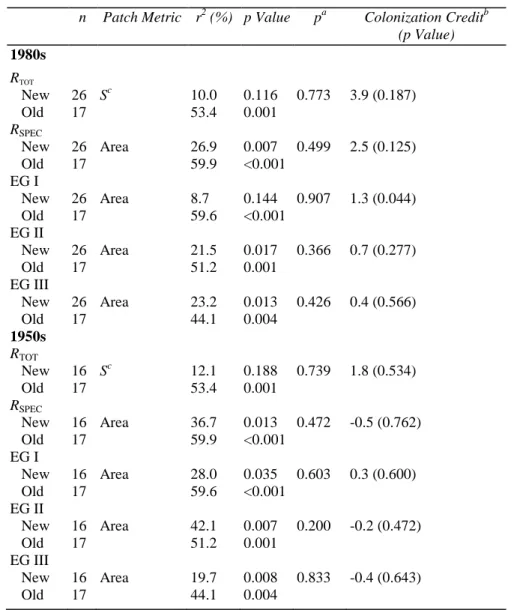
12.1 to 42.1% (Table 4). The null hypothesis of parallelism between regression lines for old and new patches was rejected in none of the cases, allowing estimation of the colonization credit. No significant colonization credit was found on any date with regard to either total species richness or total richness of specialist species. However, when looking at EGs independently, we identified a colonization credit of an average level of 1.3 species (i.e., 8.1% of all EG I species) with the 1980s as the reference date (p = 0.044). The number of 1.3 species from EG I expected to colonize new patches is a constant for all values of the independent variable (see Fig. 2). Expressed as a percent of species expected to colonize a patch compared to species that have already colonized that patch, the mean credit is 35%, ranging from 19% for large patches to 65% for small patches (Fig. 3). When excluding three outliers, that is, three patches hosting only one species from EG I and thus having a credit of 130%, the relationship between the credit expressed as a percentage and the patch area (log) is significant (r2 = 0.20; p = 0.040). The colonization credit was also computed with the "nonselected" patch variables (results not shown), when the p value associated to the regression line for new patches was not too high (<0.200). In all cases, that is, at least with one nonselected variable per species richness estimate, trends were confirmed: no colonization credit at the exception of EG I species. No colonization credit was detected for EG I species with 1950s as the reference date.
Discussion
In response to the fragmentation of natural and seminatural habitats, steps have been made in recent years to identify the impacts of fragmentation and formulate strategies to halt population declines and potential extirpation or even extinction. As a consequence, the restoration of functional habitat networks has become an important goal, and the understanding of colonization dynamics and processes is a critical component of those efforts (Jongman & Pungetti 2004). The cost of habitat restoration-recreation and maintenance of suitable environmental conditions (Bakker et al. 1996)-can be borne by society only if the true success of colonization can be evaluated in terms of potential new species in target communities. To this end, we proposed the concept of "colonization credit" as a framework to evaluate the success of colonization in restored habitats, in reference to an existing regional species pool, taking into account the spatial structure of landscapes.
We found that species richness response to the selected patch metrics was similar for new and old patches. In the contrary case, both groups of patch (old vs. new) would exhibit different slopes of regression lines, that is, species richness response to an increase of the selected metric would be higher for one of the group. In this latter case, the colonization credit would vary as a function of the selected metric and would not be computable by the proposed method, which is the most important limitation of our method.
Despite parallelism of regression lines, the part of the variation of species richness explained by patch metrics was higher for old patches than for new ones. This may be an indication that-on average-new patches have not yet achieved relative equilibrium between species richness and patch configuration and may therefore exhibit a potential colonization credit. Our results, however, suggest that the difference of species richness between new and old patches is not substantial. No significant colonization credit could be found for patches created approximately 25-55 years ago or for those created over the past 25 years, with the exception of species from EG I. The failure to detect a significant colonization credit in most cases suggests that species have responded relatively quickly (<25 years) to modifications of the landscape structure (i.e., creation of new patches). Although a more precise estimate of colonization rate would only be possible if better information on when the "less than 25 years" patches were actually created was available, the data in hands are, nevertheless, encouraging as they imply a relatively fast species response. Restoration projects, therefore, become more favorable because the time scale for response is relatively short. Moreover the absence of colonization credit for species richness estimates based on specialist species indicated that beyond similar species richness to old patches, new patches host species of conservation importance (and not only generalist species). These data are all the more encouraging because the study was conducted in highly fragmented habitats. With high level of habitat fragmentation, diaspore would be expected to be dispersed between isolated patches with greater difficulty, and the rescue effect (Brown & Kodric-Brown 1977) would be less likely to prevent newly established populations from going extinct. In addition, the significantly smaller size of the new patches and the lower degree of connectivity (relative to old patches) are likely to be additional constraints to colonization (especially in the case of low-productivity habitats known to exhibit limited dispersal probabilities [Pärtel & Zobel 2007]). The lower diversity in potential microhabitats (with soil types diversity as a proxy) in the more recent habitat patches might also impact on species richness within those patches. We are aware that some bias may arise in the general method that was used or in the particular case study. First, we estimated the colonization credit with reference to old patches that have been highly fragmented in the past. It could be argued that those patches presented a nonequilibrated extinction debt and then provided a reference situation that overestimated the species richness expected at equilibrium. However, this assumption is not supported by our data. The species richness achieved in
new patches was similar to old patches, suggesting that the extinction debt (in old patches) has been reduced to zero. Moreover, in a study focusing on the effect of past landscape configuration on current patch species richness in the same complex of habitat, we did not find any strong evidence supporting an extinction debt (Cristofoli, unpublished data). The reason might be that the most important large-scale landscape changes occurred between the 1770s and the 1930s, leaving species more than 150 years to react.
Other studies related the long periods of time needed to "cancel" extinction debts (Helm et al. 2006; Piessens & Hermy 2006; Gustavsson et al. 2007). This highlights the contrasted time lags between both phenomenons (response of species to fragmentation vs. restoration). There were two situations, specific of our case study, where bias in the estimation of the colonization credit may also have arisen. First, some species can subsist in marginal landscape areas, contribute to the survival of populations in a fragmented landscape (Jonsen & Fahrig 1997; Steffan-Dewenter & Tscarntke 2000), and constitute a source of dispersal agents for the colonization process. However, this simplification of the model was not indicated in our results. Heather (Calluna vulgaris (L.) HULL) and Purple moor grass (Molinia caerulea (L.) MOENCH) are examples of species that can be found on forest tracks or in gaps resulting from windfalls. Both of them belonged to EG I and did not appear to impede the detection of a colonization credit in this group. Second, in a patch of "target habitats," boglands, poor fens, and wet heathlands are usually found in mosaics. Species richness of a patch might thus depend on the proportion of each of the three target habitats within the patch. However, wet heathland and poor fens were generally the more common target habitats in the selected patches; boglands were more marginal. Finally, habitat management has been shown to impact on species pools (Aavik et al. 2008) and may therefore contribute to the nonexplained part of the variance in our study.
Table 3: Overview of life history trait distribution among EGs of specialist species.
γ2 Test EG* I EG* II EG* III % of Available
Values
Life History Trait P df n = 16 n = 14 n = 18
Breeding system <0.001 4 69/31/0 (0.85/1.33/4.67) 100/0/0 (6.17/2.62/4.08) 0/22/78 (9.38/0.12/14.58) 100
Reproduction type 0.001 4 62/0/38 (0.04/3.33/8.00) 79/21/0(0.30/0.01/1.75) 61/39/0 (0.08/2.82/2.25) 100
Diaspore type 0.150 2 44/56 (0.74/1.12) 79/21 (0.76/1.17) 61/39 (0.01/0.01) 100
Diaspore weight (g) <0.001 4 50/29/21 (2.65/0.01/1.53) 0/8/92 (3.54/2.10/7.26) 29/47/24 (0.03/1.76/1.52) 92 Seed bank type 0.144 4 79/14/7 (1.65/0.48/1.56) 50/17/33 (0.03/0.22/0.52) 35/35/30 (1.05/1.06/0.28) 90 Dispersal agent <0.001 8 7/80/0/0/20 (0.64/5.48/2.54/4.00/3.34) 33/0/33/22/0 (0.34/3.09/2.34/0.00/0.54) 12/29/24/53/0 (0.19/0.96/0.21/3.20/1.36) 81
Specialist species Agrostis canina Caltha palustris Andromeda polifolia
Calamagrostis canescens Carex canescens Carex demissa
Calluna vulgaris C. echinata C. hostiana
Dactylorhiza maculata C. laevigata C. panicea
D. sphagnicola C. lasiocarpa Comarum palustre
Deschampsia cespitosa C. nigra Eriophorum
angustifolium
D. flexuosa C. ovalis Galium palustris
Drosera rotundifolia C. paniculata Juncus acutiflorus
Epilobium palustris C. rostrata J. bulbosus
Erica tetralix Empetrum nigrum Juncus effusus
Eriophorum vaginatum Menyanthes trifoliata J. squarrosus Luzula mutliflora
congesta
Potentilla erecta Narthecium ossifragum
L. multiflora Scirpus cespitosus Poa palustris
Molinia caerulea Trientalis europaea Vaccinium myrtillus
Polygala serpilifolia V. oxycoccos
Salix repens V. vitis-ideae
V. uliginosum Viola palustris
EG = emergent group. Values are occurrences (%) of each trait category (respective to Table 1) within EGs. Contribution of each category to chi-square is italicized next to the % occurrence. Specialist species are listed for each EG.
Table 4: Estimation of the colonization credit for the different species richness estimates on two dates. n Patch Metric r2 (%) p Value pa Colonization Creditb
(p Value) 1980s RTOT New 26 Sc 10.0 0.116 0.773 3.9 (0.187) Old 17 53.4 0.001 RSPEC New 26 Area 26.9 0.007 0.499 2.5 (0.125) Old 17 59.9 <0.001 EG I New 26 Area 8.7 0.144 0.907 1.3 (0.044) Old 17 59.6 <0.001 EG II New 26 Area 21.5 0.017 0.366 0.7 (0.277) Old 17 51.2 0.001 EG III New 26 Area 23.2 0.013 0.426 0.4 (0.566) Old 17 44.1 0.004 1950s RTOT New 16 Sc 12.1 0.188 0.739 1.8 (0.534) Old 17 53.4 0.001 RSPEC New 16 Area 36.7 0.013 0.472 -0.5 (0.762) Old 17 59.9 <0.001 EG I New 16 Area 28.0 0.035 0.603 0.3 (0.600) Old 17 59.6 <0.001 EG II New 16 Area 42.1 0.007 0.200 -0.2 (0.472) Old 17 51.2 0.001 EG III New 16 Area 19.7 0.008 0.833 -0.4 (0.643) Old 17 44.1 0.004
r2 = percentage of variation of species richness (Y) explained by the selected metric (X), respectively, for new and old patches. When
parallelism between regression lines for new and old patches is accepted (p value), an estimation of the mean number species expected to colonize new patches, with the associated
statistical significance, was calculated.
a The p values were obtained from a GLM testing the interaction between new/ old factor and the independent factor.
b Units are a number of species. c Connectivity index (IFM x patch area).
Figure 3: Relationship between patch area (log) and the percentage of specialist species from EG I expected to colonize new patches with respect to the number of species from EG I that have already colonized new patches
(r2 = 0.20, p = 0.040). All percentages correspond to the value of 1.3 species as colonization credit.
Recently, attention has been paid to the relationships between species
isolation), and species distribution in fragmented habitats; however, studies have produced conflicting results. Some studies have emphasized the substantial impact dispersal traits have on distribution patterns relationships with landscape structure (Kolb & Diekmann 2005; Piessens et al. 2005; Adriaens et al. 2006; Tremlovà & Münzbergovà 2007), whereas others have reported that species distribution did not appear to depend on dispersal traits (Eriksson & Jakobsson 1998; Maurer et al. 2003). In the current study, when examining the relationships between dispersal traits and colonization credit on the basis of EG, we found that species from EG I exhibited a differential response compared to other species richne
not readily explainable by their characteristic life history traits. Species in EG I produced lighter seeds than in other groups, mostly dispersed by wind. These two characteristics have been cited as facili
especially between isolated patches (Kolb & Diekmann 2005; Tremlov
contained the highest proportion of species capable of seed dispersal over an extended period of time through the development of long-term persistent seed banks, a feature expected to promote colonization of restored habitats. On this basis, we would have expected species of EG I to display a lower colonization credit than other species. The long-term persistent characteristic is define
years (Bakker et al. 1991). Little is known, however, about viability over an even longer period of time. A whole forestry rotation can last far past 5 years, triggering the disappearance of
and leaving seed bank viability in question.
Among the 48 identified specialist species, 18 (37%) are listed in the Walloon Red Data Book for vascular plants (Saintenoy-Simon et al. 2006), conferring a high conserva
results are encouraging for restoration purposes, even though the equilibrium situation we referred to (in old patches) is only an equilibrium for the fragmented landscape being studied, that is, a regiona
However, only a few number of specialist species extinctions over the past 200 years are mentioned in a recent survey targeting the high plateaus in south Belgium, with two records on the plateau des Tailles and three on the plateau de Saint-Hubert (Saintenoy
observed in 2006 may still be representative of the original pool of species.
This article focused on the development of a framework and methodology with which to
colonization credits in new patches of habitat relative to reference patches. We applied the model to a particular case (wet heathland complex of habitats) and observed a rapid species response to landscape changes. Our findings suggest that such a model could be a useful tool for restoration activities.
Implications for Practice
• Wet heathland plant communities respond relatively quickly (<25 years) to modifications of the landscape structure by a fast and spontaneous coloniza
landscapes.
• The colonization credit concept could be a useful tool to evaluate restoration success as well as to identify plant characteristics that hamper the colonization process.
Relationship between patch area (log) and the percentage of specialist species from EG I expected to to the number of species from EG I that have already colonized new patches = 0.040). All percentages correspond to the value of 1.3 species as colonization credit.
Recently, attention has been paid to the relationships between species traits, landscape attributes (patch area and isolation), and species distribution in fragmented habitats; however, studies have produced conflicting results. Some studies have emphasized the substantial impact dispersal traits have on distribution patterns relationships with landscape structure (Kolb & Diekmann 2005; Piessens et al. 2005; Adriaens et al. 2006;
2007), whereas others have reported that species distribution did not appear to depend obsson 1998; Maurer et al. 2003). In the current study, when examining the relationships between dispersal traits and colonization credit on the basis of EG, we found that species from EG I exhibited a differential response compared to other species richness estimates. Nevertheless, this observation was not readily explainable by their characteristic life history traits. Species in EG I produced lighter seeds than in other groups, mostly dispersed by wind. These two characteristics have been cited as facili
especially between isolated patches (Kolb & Diekmann 2005; Tremlovà & Münzbergov
contained the highest proportion of species capable of seed dispersal over an extended period of time through the term persistent seed banks, a feature expected to promote colonization of restored habitats. On this basis, we would have expected species of EG I to display a lower colonization credit than other species. term persistent characteristic is defined here as a seed bank remaining viable in the soil for at least 5 years (Bakker et al. 1991). Little is known, however, about viability over an even longer period of time. A whole forestry rotation can last far past 5 years, triggering the disappearance of habitats for an extended period of time and leaving seed bank viability in question.
Among the 48 identified specialist species, 18 (37%) are listed in the Walloon Red Data Book for vascular plants Simon et al. 2006), conferring a high conservation value to the studied complex of habitats. Our results are encouraging for restoration purposes, even though the equilibrium situation we referred to (in old patches) is only an equilibrium for the fragmented landscape being studied, that is, a regiona
However, only a few number of specialist species extinctions over the past 200 years are mentioned in a recent survey targeting the high plateaus in south Belgium, with two records on the plateau des Tailles and three on the Hubert (Saintenoy-Simon et al. 2003). This suggests that the regional pool of species we observed in 2006 may still be representative of the original pool of species.
This article focused on the development of a framework and methodology with which to
colonization credits in new patches of habitat relative to reference patches. We applied the model to a particular case (wet heathland complex of habitats) and observed a rapid species response to landscape changes. Our
ggest that such a model could be a useful tool for restoration activities.
• Wet heathland plant communities respond relatively quickly (<25 years) to modifications of the landscape structure by a fast and spontaneous colonization of new/restored habitat patches even in highly fragmented
• The colonization credit concept could be a useful tool to evaluate restoration success as well as to identify plant characteristics that hamper the colonization process.
Relationship between patch area (log) and the percentage of specialist species from EG I expected to to the number of species from EG I that have already colonized new patches = 0.040). All percentages correspond to the value of 1.3 species as colonization credit.
traits, landscape attributes (patch area and isolation), and species distribution in fragmented habitats; however, studies have produced conflicting results. Some studies have emphasized the substantial impact dispersal traits have on distribution patterns and relationships with landscape structure (Kolb & Diekmann 2005; Piessens et al. 2005; Adriaens et al. 2006; 2007), whereas others have reported that species distribution did not appear to depend obsson 1998; Maurer et al. 2003). In the current study, when examining the relationships between dispersal traits and colonization credit on the basis of EG, we found that species from EG I ss estimates. Nevertheless, this observation was not readily explainable by their characteristic life history traits. Species in EG I produced lighter seeds than in other groups, mostly dispersed by wind. These two characteristics have been cited as facilitating seed dispersal, nzbergovà 2007). Also, EG I contained the highest proportion of species capable of seed dispersal over an extended period of time through the term persistent seed banks, a feature expected to promote colonization of restored habitats. On this basis, we would have expected species of EG I to display a lower colonization credit than other species. d here as a seed bank remaining viable in the soil for at least 5 years (Bakker et al. 1991). Little is known, however, about viability over an even longer period of time. A whole habitats for an extended period of time
Among the 48 identified specialist species, 18 (37%) are listed in the Walloon Red Data Book for vascular plants tion value to the studied complex of habitats. Our results are encouraging for restoration purposes, even though the equilibrium situation we referred to (in old patches) is only an equilibrium for the fragmented landscape being studied, that is, a regional pool of species. However, only a few number of specialist species extinctions over the past 200 years are mentioned in a recent survey targeting the high plateaus in south Belgium, with two records on the plateau des Tailles and three on the Simon et al. 2003). This suggests that the regional pool of species we
quantitatively estimate colonization credits in new patches of habitat relative to reference patches. We applied the model to a particular case (wet heathland complex of habitats) and observed a rapid species response to landscape changes. Our
• Wet heathland plant communities respond relatively quickly (<25 years) to modifications of the landscape tion of new/restored habitat patches even in highly fragmented
Acknowledgments
S.C. was awarded a PhD grant from the Fund for Research Training in Industry and Agriculture. This study was supported by the Fonds National de la Recherche Scientifique (contract FRFC 2.4556.05).
Supporting Information
Additional Supporting Information may be found in the online version of this article.
Appendix S1.
Please note: Wiley-Blackwell is not responsible for the content or functionality of any supporting information supplied by the authors. Any queries (other than missing material) should be directed to the corresponding author for the article.
Literature cited
Aavik, T., J. Ü. Jogar Liira, I. Tulva, and M. Zobel. 2008. Plant diversity in a calcareous wooded meadow—the significance of management continuity. Journal of Vegetation Science 19:475-484.
Adriaens, D., O. Honnay, and M. Hermy. 2006. No evidence of a plant extinction debt in highly fragmented calcareous grasslands in Belgium. Biological Conservation 133:212-224.
Bakker, J. P., A. F. Bos, J. Hoogveld, and H. J. Muller. 1991. The role of the seed bank in restoration management of semi-natural grasslands. Pages 449-455 in O. Ravera, editor. Terrestrial and aquatic ecosystems: perturbation and recovery. Ellis Horwood, New York. Bakker, J. P., and F. Berendse. 1999. Constraints in the restoration of ecological diversity in grassland and heathland communities. Tree 14: 63-68.
Bakker, J. P., P. Poschold, R. J. Strykstra, R. M. Bekker, and K. Thompson. 1996. Seed bank and seed dispersal: important topics in restoration ecology. Acta Botanica Neerlandica 45:461-490.
Bastin, L., J. De Sloover, C. Evrard, and P. Moens. 1996. Flore de la Belgique. Artel, Namur, Belgium.
Baudry, J., and T. Tatoni. 1993. Changes in landscape patterns and vegetation dynamics in Provence, France. Landscape and Urban Planning 24:153-159.
Bizoux, J. P., F. Brevers, P. Meerts, E. Graitson, and G. Mahy. 2004. Ecology and conservation of Belgian populations of Viola calaminaria, a metallophyte with a restricted geographic distribution. Belgian Journal of Botany 137:91-104.
Bossuyt, B., O. Honnay, K. Van Stichelen, M. Hermy, and J. Van Assche. 2001. The effect of a complex land use history on the restoration possibilities of heathland in central Belgium. Belgian Journal of Botany 134:29-40.
Brown, J. H., and A. Kodric-Brown. 1977. Turnover rates in insular bio-geography: effect of immigration on extinction. Ecology 58:445-449.
Bruun, H. H. 2000. Patterns of species richness in dry grassland patches in an agricultural landscape. Ecography 23:341-650.
Clicheroux, E. 1985. La forêt de 1800 à nos jours. Organisation de la forêt publique. Pages 34-44 in P. Mardaga, editor. Le grand livre de la forêt Wallonne. Pierre Mardaga, Liège, Belgium.
Collins, B. S., K. P. Dunne, and S. T. A. Pickett. 1985. Responses of forest herbs to canopy gaps. Pages 217-234 in S. T. A. Pickett and P. S. White, editors. The ecology of natural disturbance and plant dynamics. Academic Press, San Diego, California.
Cullen, W. R., and C. P. Wheater. 1993. The flora and invertebrate fauna of a relocated grassland at Thrislington Plantation, County Durham, England. Restoration Ecology 1:130-137.
Duvigneaud, J. 2001. Essai de réalisation d'un synopsis des groupements végétaux de Wallonie (avec quelques références relatives aux régions voisines). Adoxa 1:23.
Ehrlén, J., and J. M. van Groenendael. 1998. Plant species diversity and the trade-off between dispersability and longevity. Applied Vegetation Science 1:29-37.
Eriksson, O., and A. Jakobsson. 1998. Abundance, distribution and life histories of grassland plants: a comparative study of 81 species. Journal of Ecology 86:922-933.
ESRI. 2002. ArcGIS 8.3 Geographic information System. Environmental Research Institute, Inc., Redlando, California. Fahrig, L., and G. Merriam. 1994. Conservation of fragmented populations. Conservation Biology 8:50-59.
Fitter, A., and H. Peat. 1994. The ecological flora database. Journal of Ecology 82:415-425.
FUSAGx. 2004. Carte Numérique des Sols de Wallonie. Pour le compte de la Région Wallonne (DGA). D'après la Carte des Sols de la Belgique levée 1/20.000, pour le compte de l'Institut pour l'encouragement de la Recherche Scientifique dans l'Industrie et l'Agriculture (IRSIA), DGA, Namur, Belgium.
Gustavsson, E., T. Lennartsson, and M. Emanuelsson. 2007. Land use more than 200 years ago explains current grassland plant diversity in a Swedish agricultural landscape. Biological Conservation 138:47-59.
Hanski, I. 1994. A practical model of metapopulation dynamics. Journal of Animal Ecology 63:151-162. Hanski, I., and O. Ovaskainen. 2002. Extinction debt at extinction threshold. Conservation Biology 16:666-673.
Harner, R. F., and K. T. Harper. 1976. The role of area, heterogeneity, and favorability in plant species diversity of Pinyon-Juniper ecosystems. Ecology 57:1254-1263.
Helm, A., I. Hanski, and M. Pärtel. 2006. Slow response of plant species richness to habitat loss and fragmentation. Ecology Letters 9:72-77. Hodgson, J., P. J. Grime, R. Hunt, and K. Thompson. 1995. The electronic comparative plant ecology. Chapman & Hall, London, United Kingdom.
Jacquemyn, H., J. Butaye, and M. Hermy. 2003. Impacts of restored patch density and distance from natural forests on colonization success. Restoration Ecology 11:417-423.
Jongman, R. H. G. 2002. Homogenization and fragmentation of the European landscape: ecological consequences and solutions. Landscape and Urban Planning 58:211-221.
Jongman, R. H. G., and G. Pungetti. 2004. Introduction: ecological networks and greenways. Pages 1-5 in R. J. G. Pungetti, editor. Ecological networks and greenways: concept, design, implementation. Cambridge University Press, Cambridge, United Kingdom. Jonsen, I. D., and L. Fahrig. 1997. Response of generalist and specialist insect herbivores to landscape spatial structure. Landscape Ecology 12:185-197.
Kiehl, K., A. Thormann, and J. Pfadenhauer. 2006. Evaluation of initial restoration measures during the restoration of calcareous grasslands on former arable fields. Restoration Ecology 14:148-156.
Klotz, S., I. Kühn, and W. Durka. 2002. BIOLFLOR—eine Datenbank zu biologisch—ökologischen Merkmalen der Gefäβpflanzen in Deutschland. Bundesamt für Naturschutz, Bonn, Germany.
Kolb, A., and M. Diekmann. 2005. Effects of life-history traits on responses of plant species to forest fragmentation. Conservation Biology 19:929-938.
Krüger, A. M., F. H. Hellwig, and C. Oberprieler. 2002. Genetic diversity in natural and anthropogenic inland populations of salt-tolerant plants: random amplified polymorphic DNA analyses of Aster tripolium L. (Compositae) and Salicornia ramosissima Woods
(Chenopodiaceae). Molecular Ecology 11:1647-1655.
Lambinon, J., J. -E. De Langhe, L. Delvosalle, and J. Duvigneaud. 1992. Nouvelle flore de la Belgique, du Grand-Duché de Luxembourg, du nord de la France et des régions voisines (ptéridophytes et Spermatophytes). Editions du patrimoine du jardin botanique national de Belgique, Meise, Belgium.
Lavorel, S., S. Mcintyre, J. Landsberg, and T. D. A. Forbes. 1997. Plant functional classifications: from general groups to specific groups based on response to disturbance. Trends in Ecology and Evolution 12:474-478.
Lebrun, J., A. Noirfalise, P. Heinemann, and C. Vanden berghen. 1949. Les associations végétales de Belgique. Bulletin de la Société Royale de Botanique de Belgique 82:105-207.
Lindborg, R. 2007. Evaluating the distribution of plant life-history traits in relation to current and historical landscape configurations. Journal of Ecology 95:555-565.
MacQueen, J. B. 1967. Some methods for classification and analysis of multivariate observations. Pages 281-297 in L. M. Le Cam and J. Neyman, editors. 5th Berkeley Symposium, Mathematical Statistics and Probability. University of California Press, Berkeley. Manneville, O., V. Vergne, and O. Villepoux. 1999. Le monde des tourbières et des marais. BETA, Lausanne, Switzerland, Maurer, K., W. Durkab, and J. Stöcklin. 2003. Frequency of plant species in remnants of calcareous grassland and their dispersal and persistence characteristics. Basic and Applied Ecology 4:307-316.
Michael, N. 1996. Lowland heathland: wildlife value and conservation status. English Nature Research Reports, English Nature, Peterborough, United Kingdom.
Minitab. 2002. Minitab 15.0. State College, Pennsylvania.
Moilanen, A., and M. Nieminen. 2002. Simple connectivity measures in spatial ecology. Ecology 83:1131-1145. Moles, A. T., and M. Westoby. 2006. Seed size and plant strategy across the whole life cycle. Oikos 113:91-105.
Noirfalise, A., and R. Vanesse. 1976. Les landes a bruyère de l'Europe Occidentale. Conseil de l'Europe, Strasbourg, France.
Partel, M., and K. Zobel. 2007. Dispersal limitation may result in the unimodal productivity-diversity relationship: a new explanation for a general pattern. Journal of Ecology 95:90-94.
Piessens, K., and M. Hermy. 2006. Does the heathland flora in northwestern Belgium show an extinction debt? Biological Conservation 132:382-394.
Piessens, K., O. Honnay, and M. Hermy. 2005. The role of fragment area and isolation in the conservation of heathland species. Biological Conservation 122:61-69.
Quintana-Ascencio, P. F., C. W. Weekley, and E. S. Menges. 2007. Comparative demography of a rare species in Florida scrub and road habitats. Biological Conservation 137:263-270.
Saintenoy-Simon, J., Y. Barbier, L. Delescaille, M. Dufrêne, J.-L. Gathoye, and P. Verté. 2006. Première liste des espèces rares, menacées et protégées de la Région Wallonne (ptéridophytes et spermatophytes). Version 1 (available from http://biodiversite.wallonie.be/especes/ ecologie/plantes/listerouge/) accessed 24 July 2007.
Saintenoy-Simon, J., J. Duvigneaud, and S. Rouxhet. 2003. Flore et vegetation du plateau de Saint-Hubert. Adoxa 39:1-19.
Saunders, D. A., R. J. Hobbs, and C. R. Margules. 1991. Biological consequences of ecosystem fragmentation: a review. Conservation Biology 5:18-32.
Shannon, C, and W. Weaver. 1949. The mathematical theory of communication. University of Illinois Press, Chicago. Sneath, P. H. A., and R. R. Sokal. 1972. Numerical taxonomy. Freeman, San Francisco and London.
Steffan-Dewenter, I., and T. Tscarntke. 2000. Butterfly community structure in fragmented habitats. Ecology letters 3:449-456. Ter Braak, C. J. F., and P. Smilauer. 2002. Canoco reference manual and Canodraw for Windows user's guide: software for canonical community ordination (version 4.5). Microsoft computer, Ithaca, New York.
Tilman, D., R. M. May, C. L. Lehman, and M. A. Nowak. 1994. Habitat destruction and the extinction debt. Nature 371:65-66.
Tremlovà, K., and Z. Münzbergovà. 2007. Importance of species traits for species distribution in fragmented landscapes. Ecology 88: 965-977.
Vellend, M. 2003. Habitat loss inhibits recovery of plant diversity as forests regrow. Ecology 84:1158-1164.
Verheyen, K., I. Fastenaekels, M. Vellend, L. Keersmaeker, and M. Hermy. 2006. Landscape factors and regional differences in recovery rates of herb layer richness in Flanders (Belgium). Landscape Ecology 21:1109-1118.
Webb, N. R. 1998. The traditional management of European heathlands. Journal of Applied Ecology 35:987-990.
Young, A., and G. Clarke. 2000. Genetics, demography and viability of fragmented populations. Cambridge University Press, Cambridge, United Kingdom.