O
pen
A
rchive
T
OULOUSE
A
rchive
O
uverte (
OATAO
)
OATAO is an open access repository that collects the work of Toulouse researchers and
makes it freely available over the web where possible.
This is an author-deposited version published in :
http://oatao.univ-toulouse.fr/
Eprints ID : 11690
To link to this article
: URL :
http://www.hfes-europe.org/wp-content/uploads/2014/06/regis.pdf
To cite this version
:
Regis, Nicolas and Dehais, Frédéric and Tessier, Catherine and Gagnon, Jean-François Ocular metrics for detecting attentionaltunnelling. (2012) In: Human Factors and Ergonomics Society Europe Chapter
Annual Meeting, October 2012 (Toulouse, France).
Any correspondance concerning this service should be sent to the repository
administrator:
[email protected]
In D. de Waard, K. Brookhuis, F. Dehais, C. Weikert, S. Röttger, D. Manzey, S. Biede, F. Reuzeau, and P. Terrier (Eds.) (2012). Human Factors: a view from an integrative perspective. Proceedings HFES Europe Chapter Conference Toulouse. ISBN 978-0-945289-44-9. Available from http://hfes-europe.org
Ocular metrics for detecting attentional tunnelling
Nicolas Regis1, Frédéric Dehais1, Catherine Tessier2, Jean-François Gagnon31ISAE, Toulouse, France 2ONERA, Toulouse,F rance 3Université Laval, Québec, Canada
Abstract
This paper focuses on ocular measurement to detect the human operator’s particular state of “attentional tunnelling” during a robot supervisory task. After a survey of the existing ocular metrics, an innovative fixation detection algorithm is proposed. Then the metrics derived from the ocular parameters calculated by the algorithm are tested in a human-robot experiment. Among the metrics calculated, 3 of them appear to be able to statisticaly discrimintate the operators who faced attentional tunnelling. Introduction
Despite the constant efforts aimed at improving the operator-system interface, there is still an important share of accidents caused by the inability of the human operators to detect unexpected changes in the environment (e.g. alarms). This issue is a major concern in aeronautics (Thomas & Wickens, 2004) or automotive (Crundall & Underwood, 2011). An explanation of the phenomenon is proposed by Wickens (2005) under the name of “attentional tunnelling” which he defines as “the allocation of attention to a particular channel of information, diagnostic hypothesis or task goal, for a duration that is longer than optimal, given the expected costs of neglecting events on other channels, failing to consider other hypotheses, or failing to perform other tasks”. The design and implementation of tools to detect operators’ attentional impairments is a critical issue from a human factor point of view. Such tools would allow cognitive countermeasures1 to be triggered to re-orientate the
operator’s attention. Since there is no model of attentional tunnelling, relevant metrics have to be defined to characterize the occurrence of this state in the operator. One particularly promising avenue for attentional state prediction is ocular metrics computed from eye-tracking measurements (Tsai & al., 2007; Cowen, Ball, & Delin, 2002; Thomas & Wickens, 2004). In the literature, such an attentional focus of the human operator has been associated with a decreased saccadic activity and long concentrated eye fixations (Tsai & al., 2007; Cowen, Ball, & Delin, 2002). Consequently fewer areas of interests (AOIs) are scanned by the operator on the
1A cognitive countermeasure is a means to mitigate a cognitive bias. It relies on removing
temporarily the pieces of information on which the human operator is focused and their replacement by the relevant ones (Dehais, Tessier, & Chaudron 2003; Dehais, Causse, & Tremblay, 2011)
interface (Thomas & Wickens, 2004).This paper this work in the context of robot supervision further, an environment that is prone to attentional tunnelling due to its high mental demands (Chen, Haas, & Barnes, 2007). Three interface based ocular metrics have been tested during an Unmanned Ground Vehicule (UGV) supervisory and control task (Pizziol, Dehais, & Tessier, 2011). One potential concern with these metrics results from the analysis of the operator's gaze related to the AOIs on the interface, which requires the expert knowledge of the interface. Consequently, we would like to provide generic metrics that would be interface-independent and thus could be extended to other domains. This work focuses on the analysis of the ballistic behaviour of the eye and on finding relationships between the eye behaviour and the operator’s attentionnal state. Analysis methods of the eye motion will be discussed and an innovative Eye State Identification Algorithm (ESIA) will be presented. Then metrics derived from the ocular parameters calculated by the ESIA will be tested on the UGV supervisory and control task cited before.
Measuring the ocular activity: The eye state vector (ESV) concept
The aim of the ESIA is to associate a state to the eye for each sample measured by the eye tracker. The sequence of the eye states computed from the sequence of eye positions is called the ESV.
Preliminary definitions of the ocular states
The eye movement is mainly saccadic; it consists in a sequence of fixations interrupted by saccades changing the locus of the point of gaze (Robinson, 1964). These movements are closely linked with attention even though restrictions have been elicited (Posner, 1980). The phenomena considered in this study are fixations, saccades, blinks and smooth pursuit:
- Fixations are defined as relatively stable positions of the eye allowing information encoding. Fixation length and frequency are relevant indicators of the complexity or the importance of a piece of information and allow the efficiency of a user interface to be assessed (Goldberg & Kotval, 1999); - Saccades are rapid ballistic movements of the eye between two fixations
with high velocity in the 400-600°/s range (Liang, Reyes, & Lee 2007). Metrics derived from saccades qualify information search (Goldberg & Kotval, 1999).
- Blinks occur when the eyelids cover the eye globes. Different metrics are derived from the blinks frequency as an indicator of workload (Bonner & Wilson, 2002), visual load (Veltman & Gaillard, 1996) or fatigue (Bruneau, Sasse, & McCarthy, 2002);
- Smooth pursuit is another eye movement based on continuous adaptation of the eye position in order to keep the eye pointing at a defined target (Robinson, 1965). Smooth pursuit is associated with speeds between 1 and 30°/s (Liang, Reyes, & Lee, 2007).
Temporal criteria for fixation classification
According to (Marshall, 2000), we consider that a fixation is a stable position of the eye for at least 100ms. A classification of the types of fixations is proposed by (Graf & Krueger, 1989) depending on their duration:
Involuntary fixation: fixation length < 240ms; this fixation is too short to have a high level processing of the information at the locus of the fixation; only fast search of information is possible.
Voluntary fixation: fixation length > 320ms; this fixation corresponds to information extraction at the locus of the fixation.
Undetermined fixation: fixation length between 240ms and 320ms; it is a “safety net” against threshold effects.
These temporal parameters have been taken into account as temporal criteria in the ESIA as they should give interesting information on visual stimulus processing.
Content of the ESV
Marshall (2000) underlines that “at any instant, the eye of an awaken individual is in one of three states: blinking, moving, or fixating.” If we try to identify separately the eye states from the eye position sequence, there is a risk of identifying an eye position as belonging to two states at the same time. Therefore, we compute the ESV where only one eye state can be associated with an eye position. There are five possible states in the ESV:
- Blink : the eye lid covers the eye;
- Involuntary fixation : fixation length < 240ms
- Undetermined fixations: fixation length between 240ms and 320ms - Voluntary fixation: fixation length > 320ms
- Saccade: fixation length < 100ms or speed > 30°/s out of the last fixation area.
Eye-tracker data and ocular parameters identification
Eye tracking systems are commonly used to analyze the ocular behaviour. They produce a sequence of angular eye positions at various rates (from 25Hz to more than 1kHz) with an average precision of 0.25°, but also blinks, pupillary dilation and/or vergence depending on the kind of device. In our case, each frame analyzed by the eye-tracker takes the shape of a line vector containing all the parameters computed by the eye-tracker. The eye-tracking log of an experiment is therefore a time-stamped matrix where each line corresponds to one eye position. The data within the line vector are the following:
Horizontal eye angular position : X°
Vertical eye angular position : Y°
Eye detection tags
This position sequence is generally turned into a fixation-saccade sequence allowing further analyses on the operator’s visual processing. Even though eye-trackers come with their own fixation identification algorithm, many different approaches have been developed to fit with more specific needs. In order to set a basis on which the
algorithms could be compared, Salvucci & Goldberg (2000) have proposed a taxonomy for classifying the various fixation identification algorithms. Three classes of algorithms are isolated: AOI-based, Velocity-based, Dispersion based. Since AOIs are specific areas defined on the interface (generally delimiting the different sources of information), AOI-based algorithms are necessarily interface-dependant. To compute the ESV with the ESIA, we will only focus on the last two algorithms, which are interface-independent.
Velocity-based and Dispersion-based algorithms Velocity-based identification
The velocity of the eye is computed from the consecutive frames of the eye tracker log. Velocity-threshold identification is based on the comparison between the current eye velocity and a fixed velocity threshold. If the current eye velocity is under that threshold then the eye is considered as doing a fixation. If the velocity is above that threshold it is considered that the eye is doing a saccade. This method is straightforward, very fast, but is exposed to threshold issues as the transition between both states is binary. Furthermore, the velocity values associated with the state of fixation are still in debate in the literature and differ from one author to the other:
Under 100°/s (Salvucci & Goldberg, 2000)
In the 15-100°/s area (Jacob & Karn, 2003)
Under 1°/s (Liang, Reyes, & Lee, 2007)
We have chosen to use the velocity-threshold algorithm with a 30°/s threshold. Because the eye velocity during a smooth pursuit movement is under that threshold (see Preliminary definitions of the ocular states), smooth pursuit will be considered as a fixation (i.e. the information is processed at the locus of fixation eventhough the target is moving slowly).
Dispersion-based identification
The dispersion-threshold algorithm is equivalent to consider that a fixation is a group of positions included within a fixed shape area of a predefined surface. Different shapes can be found in literature:
Circular shape: with a radius of 0.5° (Hoffman & Subramaniam, 1995) or around 1° (Liang, Reyes, & Lee, 2007).
Square shape: 1° by 1° (Marshall, 2000).
As soon as the eye gaze moves away from this area, the current fixation is considered as ended.
Contrary to the Minimum Spanning Tree identification (Salvucci & Goldberg, 2000), the dispersion-based identification is a linear time algorithm which is therefore suitable for real time analysis. This method has been chosen as the basis of the ESIA also because the spatial criterion is simple to control and the robustness of fixation identification is easily improved by adding the temporal criteria presented before (Salvucci & Goldberg, 2000) on top on the velocity-threshold condition.
ESIA scheme
The algorithm reads the time stamped matrix produced by the eye tracker line after line in chronological order. The blink analysis is possible thanks to the eye detection tag (see Eye-tracker data and ocular parameters identification). The detection tag switches from 1 to 0 when the eyelid masks the eye. Each frame vector with a zero detection tag is labelled as blink. Therefore blinks interrupt a saccade or a fixation at any point in the detection and the next frame is analyzed.
If the vector is labelled with a 1 detection tag, then the X° and Y° parameters are analyzed: a block of consecutive eye positions is opened. At the beginning the block is composed of only one eye position. It will grow if the next eye position verifies the following conditions:
- First, a dispersion-based condition is evaluated: successive positions have to be less than 1° away from the first position (horizontally and vertically, square shape) which allows some noise around the first fixation point with no velocity restriction.
- If the point-of-gaze moves out of the fixation area then the velocity-based condition is evaluated: the speed should not exceed 30°/s (smooth pursuit is considered as a fixation). In that case, the center of the square in which the eye is considered as fixating is moved at the current point-of-gaze.
- When none of these two conditions is validated the block is closed.
The length of the block is evaluated and compared to the temporal criteria presented before (see Temporal criteria for fixation classification) in order to be classified. All the frames belonging to this block are then labeled with the fixation type. The sequence of the eye states is stored in the ESV. The position, the type, and the length of the blocks are also saved in a log for statistical post-hoc analysis. Consequently the ESIA computes the ESV and a log associated to it.
Derived metrics
Many metrics can be derived from the ESV. In this study, we evaluated how the 5 ocular states are distributed in time. The ratio of time spent in each state was computed thanks to a moving average window that runs through the ESV. The state distribution was then used to compute the fixation/saccade ratio which highlights the balance between research (saccades) and information extraction (all types of fixations) (Goldberg & Kotval, 1999). The eye velocity was also computed directly from the eye position sequence.These metrics have been tested to detect attentional tunnelling in the context of an experimental task involving a human operating a UGV.
Experiment
Experimental setup
An experiment was conducted at ISAE with a UGV and a scenario was completed by 23 participants (for more details see Dehais, Causse, & Tremblay, 2011). The
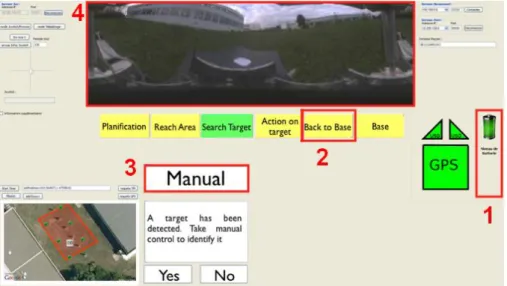
participants used an interface to remotely control the UGV without any direct visual contact (see figure 1). At the beginning of the mission, the UGV autonomously navigated in supervised mode to reach the search area (segment 1). Upon arrival, it started autonomous scanning for detecting the target (segment 2). When the robot was in the vicinity of the target, a message was sent to the human operator to take over and control the rover in manual mode for a discrimination task associated with the target (segment 3). While the human operator was involved in the discrimination task, a “low battery event” was sent by a wizard of Oz (start segment 4). In turn, this event triggered a safety procedure that made the robot return to base in supervised mode. As this event happened at a critical moment of the mission, it was expected that the human operator would not notice the alerts dedicated to warn him of the low battery event.
Figure 1: Interface used for supervising the robot.
The participants were split in two groups depending on how the low battery event was presented. The control group (N=12) experienced a “classical” presentation of the event via three alarms: the battery icon (area 1) switched from green to orange, the display (area 2) showed "Back to base" in green, and the piloting mode (area 3) blinked twice from "manual" to "supervised".
The countermeasure group (N=11) experienced the disappearance of the panoramic video screen for 1s (area 4). Then the reason for the robot’s behaviour was shown for 3s in place of the panoramic video. After a 3s transition during which the panoramic video appeared behind the explanatory text, the interface got back to the “nominal” layout.
In the control group 8 participants out of 12 experienced attentional tunnelling and faced a conflict between their goal (achieve the target identification task) and the goal of the UGV (go back to base). All of the 11 participants from the countermeasure group noticed the battery failure and understood the behaviour of
the robot. Therefore the discrimination between the two groups should be found over segment 4 (battery failure) as the control group experienced attentionnal tunnelling and the countermeasure group did not.
ESV state distribution during the UGV mission
The 23 participants were equipped with a Pertech head-mounted eye tracker recording eye position data at a frequency of 25 Hz. The eye state distribution is computed from the ESV as explained in paragraph ESIA scheme. An example of the state distribution during the UGV mission for a participant from the countermeasure group is presented in Figure 2.
Figure 2: Eye state ratio of a subject from the countermeasure group. Red vertical lines
represent separation between segments.
On figure 2, segments S1 and S2, which correspond to autonomous phases, are homogeneous. During segment S3, the voluntary fixations (in pink) increase, corresponding to the manual identification task whereas the saccadic activity (in black) decreases to zero. After the operator received the countermeasure (start of segment S4), saccades, which are an indicator of ocular research on the interface, increase suddenly aiming at restoring the right situation awareness. The peak at the end of segment S4 is not explained at this stage. The end of the record corresponds to the arrival of the robot at the base.
Figure 3: Eye state ratio of a subject from the control group. Red vertical lines represent separation between segments.
On figure 3, Segments S1 and S2, which correspond to autonomous guidance phases, are also homogeneous with a similar distribution of the state ratios for the two subjects. During segment S3, a major change in ocular activity is observed with a high saccadic activity. The subject was surprised by the authority switch. He spent some time scanning the different information sources before starting to manoeuver the robot. Then the voluntary fixations increased as the identification task actually started. There was no significant change as the alarm was triggered, the saccadic activity remained low and the ratio of voluntary fixations remained high. The operator persevered on the identification task till the end of the record when the robot had run out of battery.
Statistical results
In this section, the ability of the metrics derived from the ESIA to isolate attentionnal tunnelling using two-way repeated measure ANOVAs is evaluated. Due to data collection issues, only 11 out of the 12 participants from the control group are considered and all the 11 participants from countermeasure group.
Ocular metrics presented above are compared across groups. We will focus first on the involuntary fixations. Involuntary fixations significantly vary across Segment x Group interaction F(3,60) = 8.39, p < 0.01. Specifically, involuntary fixations are different over segment S4 (p < 0.01) but not over the other segments. Results are grouped in Table 2 for the other metrics.
Table 2 – GroupxSegment interaction F P Voluntary fixations 3.20 0.03 Eye velocity 7.27 < 0.01 Saccades 1.80 0.16 Fixations/saccades ratio 2.27 0.09 Undetermined Fixations 5.45 < 0.01
We can see that the SegmentxGroup interaction on time spent on voluntary fixations is not statistically significant. The eye velocity is significantly lower over segment 4 for the control group than for the countermeasure group (p < 0.01). Saccades are not significantly different over segment 4 which is surprising as saccades are tightly linked with eye velocity. The fixation/saccade ratio defined by (Goldberg & Kotval 1999) is not significant. It has to be noticed that undetermined fixations show significant SegmentxGroup interaction with significant differences over segment 4. This observation needs further work to be analyzed.
Conclusion
In this paper we have shown how interface-independent eye metrics are able to discriminate individuals in the state of attentionnal tunnelling from the individuals in nominal state: indeed eye speed, undetermined fixations and involuntary fixations are potential interface-independent candidates for attentionnal tunnelling prediction. In this work, we have used the fixation classification presented in (Graf & Krueger 1989). It seems that this classification has not been validated nor criticized by other works. Our results using this classification elicit the fact that undetermined fixations seem to react significantly to attentionnal tunnelling. This suggests that the thresholds defined by Graf and Krueger do not apply here as some information appear to be lost when not associating any role to the undetermined fixations. The correlations between the eye states are currently under investigation and seem to indicate that it is possible to extract some information from undetermined fixations. Furthermore, it is reasonable to think that if the eye velocity is a discriminating indicator of attentionnal tunnelling, saccades should also react significantly as saccades are high-velocity eye movements. The ESIA detects saccades if the velocity exceeds 30°/s. But the eye velocity during a saccade may be way higher than 30°/s as explained in the Preliminary definitions of the ocular states section. It means that saccades are detected without taking the saccade velocity into account. Therefore the eye speed metric and the saccade metric can evolve separately. Over
segment 4, the eye speed is significantly higher for the countermeasure group than for the control group. It means that saccades are of greater magnitude for the countermeasure group than for the control group.
The on-going work takes advantage of this analysis. The eye speed is used to compute a new ocular metrics that appears to be highly correlated with the switching rate. This would provide another interface-independent metric that could elicit attentional tunnelling, as the switching rate does (Pizziol, Dehais, & Tessier 2011).
References
Bonner, M.A, & Wilson, G. (2002). Heart rate measures of flight test and evaluation. The International Journal of Aviation Psychology, 12, 63–77. Bruneau, D., Sasse M.A, & McCarthy J.D. (2002). The eyes never lie: The use of
eye tracking data in HCI research. In Proceedings of the CHI, 2:25. ACM, Washington, Washington DC USA.
Chen, J.Y.C., Haas E.C., & Barnes M.J. (2007). Human Performance Issues and User Interface Design for Teleoperated Robots. IEEE Transactions on
Systems, Man and Cybernetics, Part C (Applications and Reviews), 37,
1231–1245
Cowen, L., Ball L.J., & Delin J. (2002). An eye movement analysis of webpage usability. In Proceedings People & Computers XVI: Memorable yet
invisible: (pp. 317–335). Springer-Verlab, London, England.
Crundall, D., & Underwood G. (2011). Visual Attention While Driving. Handbook
of Traffic Psychology, 137.
Dehais, F., Causse M., & Tremblay S. (2011). Mitigation of Conflicts with Automation. Human Factors, 53, 448–460.
Dehais, F., Tessier C., & Chaudron L. (2003). GHOST: experimenting conflicts countermeasures in the pilot’s activity. In 18th IJCAI (International Joint
Conference on Artificial Intelligence), 18 (pp.163–168). AAAI, Palo Alto,
California.
Goldberg, J.H., & Kotval X.P. (1999). Computer interface evaluation using eye movements: Methods and constructs. International Journal of Industrial
Ergonomics 24, 631–645.
Graf, W., & Krueger H. (1989). Ergonomic evaluation of user-interfaces by means of eye-movement data. In Proceedings of the third International
Conference on Human-Computer Interaction, 1 (pp. 659–665). Elsevier
Science Inc. New York City, USA.
Hoffman, J.E., & Subramaniam B. (1995). The role of visual attention in saccadic eye movements. Attention, Perception, & Psychophysics 57, 787–795. Jacob, R.J.K., & Karn K.S. (2003). Eye tracking in human-computer interaction and
usability research: Ready to deliver the promises. Mind 2 (3), 4.
Liang, Y., Reyes M.L., & Lee J.D. (2007). Real-Time Detection of Driver Cognitive Distraction Using Support Vector Machines. IEEE Transactions on
Intelligent Transportation Systems, 8, 340–350.
Marshall, S. P. (2000). Method and apparatus for eye tracking and monitoring pupil
Parati, G., Saul J.P., Di Rienzo M., and Mancia G. (1995). Spectral analysis of blood pressure and heart rate variability in evaluating cardiovascular regulation: a critical appraisal. Hypertension, 25, 1276–1286.
Pizziol, S., Dehais F., & Tessier C. (2011). Toward human operator “state” assessment. In Proceedings of the 1st ATACCS (Automation in Command
and Control Systems). IRIT Press, Toulouse, France.
Posner, M.I. 1980. Orienting of attention. Quarterly Journal of Experimental
Psychology 32, 3–25.
Robinson, D.A. 1965. The mechanics of human smooth pursuit eye movement. The
Journal of Physiology 180, 569.
Robinson, DA. 1964. The mechanics of human saccadic eye movement. The Journal
of physiology 174, 245.
Salvucci, D.D., & Goldberg J.H. (2000). Identifying fixations and saccades in eye-tracking protocols. In Proceedings of the 2000 symposium on Eye eye-tracking
research & applications, (pp. 71–78). ACM, Washington, Washington DC,
USA.
Thomas, L.C., & Wickens C.D. (2004). Eye-tracking and individual differences in off-normal event detection when flying with a synthetic vision system display. In Human Factors and Ergonomics Society Annual Meeting
Proceedings, 48 (pp. 223–227). HFES, Santa Monica, California, USA.
Tsai, Y.F., Viirre E., Strychacz C., Chase B., & Jung T.P.. 2007. Task performance and eye activity: predicting behavior relating to cognitive workload.
Aviation, space, and environmental medicine 78 (Supplement 1): B176–
B185.
Veltman, J. A., & Gaillard A.W.K.. 1996. Physiological indices of workload in a simulated flight task. Biological psychology 42, 323–342.
Wickens, C.D. (2005). Attentional tunnelling and task management. In 13th
International Symposium on Aviation Psychology. Lawrence Erlbaum