Pépite | Transduction Raman et compositions de membranes non conventionnelles pour les capteurs polymères
153
0
0
Texte intégral
(2) Thèse de Yulia Ashina, Université de Lille, 2018. Preface The present document, resulting of four years of research, would not have been possible without the support of many persons. First of all, I would like I would like to express my gratitude to the supervisors, Dr. Cyril Ruckebusch and Dr. Dmitry Kirsanov, for their guidance, encouragement and the incredible motivational capabilities during these years. I also want to thank the jury members for their participation to my thesis committee: Dr. Jean-François Bardeau for the insightful and challenging comments, Dr. Manel del Valle for viewing at my results from different angles, Dr. Vasily Babain and Dr. Ludovic Duponchel for clarifying unexpected findings and outlining the unusual prospects for further research, Myriam Moreau for offering plenty of assistance with Raman spectroscopy. I consider myself very lucky to share the office with amazing people, both in Russia and France, and I am very grateful to my colleagues for being an infinite source of inspiration and support during hard times.. I gladly acknowledge the ITMO University (Saint-Petersburg, Russia) that gave me the opportunity to be enrolled in the double-degree program.. Last but not the least I would like to thank my boyfriend, mom, dad and my sisters for the unconditional support and sense of humour that helped me to keep balance.. Yulia Ashina 2. © 2018 Tous droits réservés.. lilliad.univ-lille.fr.
(3) Thèse de Yulia Ashina, Université de Lille, 2018. Abstract In recent years, the number of studies devoted to the development of simple and inexpensive chemical sensors has significantly increased. The development of new approaches is mainly aimed at novel sensor signal transduction schemes and designing sensors with programmable properties. This thesis presents three new approaches to the analytical signal transduction in the polymeric membranes of potentiometric sensors. The first part of the study describes a novel technique for indirect metal cations detection with micro-Raman spectroscopy. The evolution of the Raman spectrum of the polymeric membrane, upon contact with the sample solution, is used as the analytical signal. Multivariate calibration methods were used to provide a quantitative estimation of the metal content in the aqueous solutions from the measured Raman spectra. The second part of the thesis reports on studying the feasibility of ionophorefree sensor array with membranes based on various ion-exchangers and plasticizers only. The sensor performance in the analysis of Ca2+-Mg2+ mixtures was evaluated through a combination of multisensor approach and multivariate calibration and was compared to traditional ionophore-based selective sensors. The final part of the thesis is aimed at programmable modification of the sensor sensitivity patterns using the membranes containing several ionophores. Three ionophores, which were previously used for the determination of the lanthanide cations, were chosen for the membrane preparation. The performance of the corresponding multi-ionophore array was tested in the analysis of Ln 3+ mixtures and compared to conventional mono-ionophore sensors.. Keywords: potentiometric sensors, PVC-plasticized membranes, multisensory systems, Raman spectroscopy, multivariate calibration. 3. © 2018 Tous droits réservés.. lilliad.univ-lille.fr.
(4) Thèse de Yulia Ashina, Université de Lille, 2018. Résumé Au cours des dernières années, le nombre de travaux scientifiques qui portent sur le développement de capteurs chimiques simples et moins chers a été significativement augmenté. Les études dans ce domaine sont principalement orientées vers la recherche de nouveaux schémas de transduction du signal du capteur et vers le développement de capteurs dont les propriétés peuvent être programmées. Trois approches originales pour la transduction du signal des membranes polymères des capteurs potentiométriques sont présentées dans la thèse. La première partie de l’étude est consacrée à la description d’une nouvelle technique pour la détection indirecte de cations métalliques au moyen de la spectrométrie micro-Raman. Le spectre Raman est mesuré à la surface de la membrane polymère au contact avec la solution échantillon. Ce spectre est converti en information analytique quantitative par le biais de méthodes d’étalonnage multivariée. Dans la deuxième partie, nous étudions la faisabilité de capteurs ne contenant pas d’ionophore, les membranes n’étant alors composées que des différents échangeurs d'ions et plastifiants. La performance de ces capteurs pour l’analyse quantitative de mélanges binaires de Ca2+-Mg2+ est évaluée en combinant une approche originale basée sur des capteurs multiples. Les résultats sont comparés à ceux obtenus avec des capteurs à base d’ionophores traditionnels. Enfin, la modification à façon des schémas de sensibilité des capteurs utilisant des membranes contenant plusieurs ionophores est présentée dans la dernière partie de la thèse. Trois ionophores (utilisés auparavant pour la détermination de cations des lanthanides) ont été choisis pour la préparation de la membrane. Les performances du réseau de capteurs ainsi créé sont testées sur l’analyse de mélanges de Ln3+ et les résultats sont comparés à ceux des capteurs mono-ionophores conventionnels.. Mots-clés: capteurs potentiométriques, membranes PVC plastifiées, systèmes multicapteurs, spectroscopie Raman, calibration multivariée 4. © 2018 Tous droits réservés.. lilliad.univ-lille.fr.
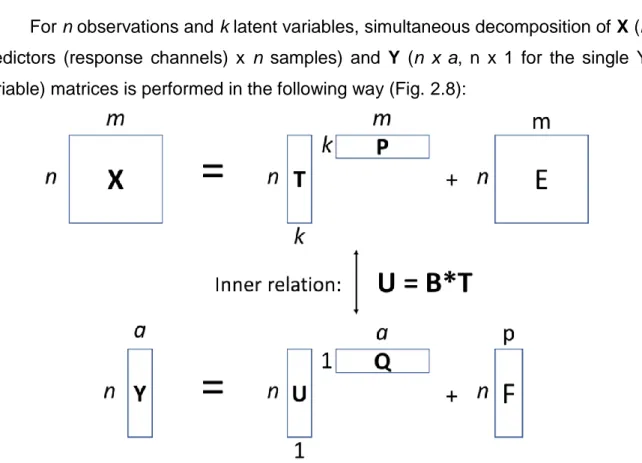
(5) Thèse de Yulia Ashina, Université de Lille, 2018. Table of contents Introduction............................................................................................................. 9 CHAPTER 1. Potentiometric sensors................................................................. 13 Electrochemical sensors ....................................................................... 13 Construction of ion-selective electrodes (ISE) ...................................... 15 1.2.1.. Solid membrane ISE ...................................................................... 16. 1.2.2.. Liquid membrane ISE ..................................................................... 17. 1.2.3.. Polymeric membrane ISE ............................................................... 19. 1.2.4.. Phase boundary potential model .................................................... 25. 1.2.5.. Analytical characteristics of ISEs .................................................... 27. 1.2.6.. Applications of ISEs and recent developments .............................. 34. 1.2.7.. Multisensor systems ....................................................................... 36. Statement of purpose ............................................................................ 40 1.3.1.. Raman transduction for ISE membranes........................................ 40. 1.3.2.. Ionophore-free sensors .................................................................. 41. 1.3.3.. Multi-ionophore ISE membranes .................................................... 44. CHAPTER 2. Feasibility study of Raman transduction for polymeric ISE membranes. 46 Raman spectroscopy ............................................................................ 46. 2.1.1.. Principle of Raman scattering......................................................... 48. 2.1.2.. Raman micro-spectroscopy ............................................................ 50. 2.1.3.. Applications of Raman spectroscopy ............................................. 51. Multivariate data analysis techniques ................................................... 53 2.2.1.. Principal component analysis (PCA) .............................................. 55. 2.2.2.. Partial Least Squares (PLS) ........................................................... 59. 2.2.3.. Data preprocessing ........................................................................ 62. 5. © 2018 Tous droits réservés.. lilliad.univ-lille.fr.
(6) Thèse de Yulia Ashina, Université de Lille, 2018. Experimental ......................................................................................... 65 2.3.1.. Membrane preparation ................................................................... 66. 2.3.2.. Spectra acquisition ......................................................................... 67. 2.3.3.. Raman spectra of membrane components..................................... 70. 2.3.4.. Quantum-chemical calculations...................................................... 70. 2.3.5.. Data analysis .................................................................................. 71. Results and discussion ......................................................................... 73 2.4.1.. Membrane components spectra ..................................................... 73. 2.4.2.. Optimization of the membrane composition ................................... 93. Conclusions ........................................................................................ 102 CHAPTER 3. Ionophore-free ISE membranes ................................................. 103 Experimental ....................................................................................... 103 3.1.1.. Reagents ...................................................................................... 103. 3.1.2.. Membrane preparation and potentiometric measurements .......... 104. 3.1.3.. Data processing ........................................................................... 109. Results and discussion ....................................................................... 110 3.2.1.. Sensitivity of ionophore-free sensors ........................................... 110. 3.2.2.. Mixture analysis ............................................................................ 111. 3.2.3.. Results of calcium and magnesium quantification in sample sets 2-4. 115. Conclusions ........................................................................................ 116 CHAPTER 4. Multi-ionophore potentiometric sensor membranes ................... 117 Experimental ....................................................................................... 117 4.1.1.. Reagents ...................................................................................... 117. 4.1.2.. Membrane composition and preparation ...................................... 119. 4.1.3.. Potentiometric measurements and data processing ..................... 120 6. © 2018 Tous droits réservés.. lilliad.univ-lille.fr.
(7) Thèse de Yulia Ashina, Université de Lille, 2018. Results and discussion ....................................................................... 122 4.2.1.. Sensitivity of ionophore-free sensors to lanthanide cations .......... 122. 4.2.2.. Mixture analysis ............................................................................ 125. Conclusions ........................................................................................ 129 CHAPTER 5. Conclusion ................................................................................. 130 Annex 1. The NIPALS algorithm (PCA). ............................................................. 134 Annex 2. NIPALS algorithm (PLS regression) .................................................... 135 Annex 3. NMR spectrum of the acrylate copolymer ........................................... 136 Annex 4. Original contributions........................................................................... 137 References: ........................................................................................................ 138. 7. © 2018 Tous droits réservés.. lilliad.univ-lille.fr.
(8) Thèse de Yulia Ashina, Université de Lille, 2018. List of abbreviations AsLS. Asymmetric Least Squares. CARS. Coherent anti-Stokes Raman spectroscopy. CCD. Charged coupled device. CTA. Cellulose triacetate. DOP. bis(2-ethylhexyl) phthalate (“dioctyl phthalate”). DOS. bis-(2-ethylhexyl) sebacate (“dioctyl sebacate”). EIS. Electrochemical Impedance Spectroscopy. EMF. Electromotive Force. ET. Electronic tongue. FNDPE. 2-fluoro-2'-nitrodiphenyl ether. IR. Infrared. ISE. Ion-Selective Electrode. ISFET. Ion-Selective Field Effect Transistors. IUPAC. International Union of Pure and Applied Chemistry. KTTFPB. Potassium 3,5-bis(trifluoromethyl)phenyl] borate. KTClPB. Potassium tetrakis(4-chlorophenyl)borate. LOD. Limit of Detection. MSC. Multiplicative Scatter Correction. NPOE. 2-nitrophenyl octyl ether. PCA. Principal Component Analysis. PDAM. N2,N2,N9,N9-tetrabutyl-1,10-phenanthroline-2,9-dicarboxamide. PMMA. Poly (methyl methacrylate). PLS. Partial Least Squares. PU. Polyurethane. PVC. Poly (vinyl chloride). REE. Rare-earth elements. RMSE. Root-Mean-Square Error. RSS. Residual sum of squares. SERS. Surface-Enhanced Raman spectroscopy 8. © 2018 Tous droits réservés.. lilliad.univ-lille.fr.
(9) Thèse de Yulia Ashina, Université de Lille, 2018. TEHP. tris(ethylhexyl) phosphate. TSS. Total Sum of Squares. VIP. Variable Importance in Projection. Introduction According to the modern definition, a chemical sensor is a compact device that transforms chemical information into useful analytical signal [1]. With the development of chemical sensing, these devices became smaller, simpler and more widely available [2]. One can think of a traditional pH sensor converting the hydrogen ion activity in solution into electrical potential measured with an mV-meter. Chemical sensors normally have both recognition and transduction functions combined within one device. The recognition function is related to the chemical or physical changes of the sensing element, and its changes are proportional to the analyte concentration in the investigated object. Interaction of an analyte with recognition centers may consist of either a chemical reaction (e.g. affinity recognition in biosensors) or a physical sorption on a recognition site. The transduction function assumes the transformation of these changes into measurable values. The nature of a sensor output then defines the classification of chemical sensors into physical and chemical sensors. Chemical transduction consists of the quantification of changes in the chemical composition of the sensing element. If the analytical signal is not derived from the analyte itself but it is the product of an interaction with a secondary molecule, then the transduction is called indirect, or also labeled transduction. Physical transduction in its turn is derived from varying the physical properties and, therefore, physical transduction is usually label-free. Electrochemical sensors are the largest and the oldest type of chemical sensors. Due to their simple and robust instrumentation, and relatively easy 9. © 2018 Tous droits réservés.. lilliad.univ-lille.fr.
(10) Thèse de Yulia Ashina, Université de Lille, 2018. production, electrochemical sensors are widely applied in different areas of industry and research. By now, it is the most widespread platform for routine analyses in clinical chemistry [3]. Progress in this area is mainly associated with the application of new chemical materials and optimization of sensor construction. Potentiometric membrane sensors are among the most popular research objects in the field, not only due to their simplicity and robustness, but also due to the variety of possibilities that exist for the modification of their sensing properties. One of the main challenges of sensor applications is the analysis of real objects. High content of various interfering components is the most common reason of inadequate sensor selectivity towards the target analyte. Also, the influence of the sample matrix on the sensor performance is hardly predictable as it is sampledependent. For example, limitations of the analysis would be drastically different for Mg2+ determination in seawater [4, 5], food products [6] and biological liquids [7]. For instance, in blood electrolytes determination, the sensor surface will be continuously altered due to the adsorption of blood plasma/serum proteins, resulting in a poor reproducibility of the analysis. Although novel sensors appear regularly, their application is strictly specified by the objects of analysis [8, 9]. This extensive way of problem-solving requires a significant time and money investment, and the development of selective sensors for each type of sample is hardly possible. Regarding electrochemical sensors, one of the most successful ways to address this issue is the multisensor approach [10]. Instead of using one selective sensor, several cross-sensitive sensors are used simultaneously. Sensors of the array should be selected in relation to the type of object analyzed in order to compensate for interferences and sample matrix effects [11]. The multisensor approach is indispensable in cases where integral parameters are required instead of the information on the exact sample composition. For example, the concentration of individual toxicants in a given environmental sample may be below the threshold limit value, but the sample would still be classified as “toxic” in terms of bioassay evaluation. The assessment of such “integral toxicity” can be performed with 10. © 2018 Tous droits réservés.. lilliad.univ-lille.fr.
(11) Thèse de Yulia Ashina, Université de Lille, 2018. multisensor system as far as it is calibrated against the reference response (i.e. the one of the chosen bioassay), without a priori knowledge on the sample composition [12]. Modern studies on sensor arrays are aiming at the development of a sensor array that can be easily adapted to an unpredictable environment. This task includes simplification of the measurement procedure, sensor construction [13] or data processing without losing the sensor performance [14]. More recently, attention has focused on multi-transduction platforms (e.g. opto-potentiometric [15] when both optical and electrochemical signals are registered simultaneously for one particular sensor), providing complementary information on a sample composition using the same polymeric membrane. It was shown that this approach can significantly improve sensor performance [16]. This thesis research is dedicated to the development of new approaches for the transduction of analytical signals in potentiometric sensor membranes. In Chapter 1 the main aspects of electrochemical sensors and related techniques are given. At first, the different types of electrochemical sensors are discussed in general. The main focus is on potentiometric sensors, namely ion-selective membrane electrodes (ISE). Their working principle, construction, types of membranes and components are reviewed. In the end of the Chapter 1, the objectives of this study are described. The three following chapters then give the detailed description of the results of this study. Chapter 2 describes a new methodology for Raman signal transduction from potentiometric sensor membranes. This methodology is directed towards the abovementioned multi-transduction approach, e.g. the possibility of getting optical information from the membrane of an electrochemical sensor. The changes in the Raman spectrum of the membrane upon binding of the analyte by the ionophore are used as analytical signal. The first part is devoted to Raman spectroscopy with a focus on the micro-Raman technique. In addition, the basics of multivariate data analysis are given in this chapter. This includes the principal component analysis (PCA) and partial least squares regression (PLS). The feasibility of the approach is performed with Cd2+ cations binding with phenanthroline diamide ligand immobilized in a polymeric sensor 11. © 2018 Tous droits réservés.. lilliad.univ-lille.fr.
(12) Thèse de Yulia Ashina, Université de Lille, 2018. membrane and the study includes the optimization of the membrane composition (e.g. ligand concentration, polymer type, etc.). In the following chapters, two new modifications of the multisensor approach are described. Chapter 3 presents the application of ionophore-free sensors based on a polymer, plasticizer and a lipophilic additive only. The sensor membranes based on the combination of different plasticizers and lipophilic additives are used within a multisensor approach for ion mixtures analysis. Chapters 4 discusses the design and implementation of multiionophore polymeric sensor membranes. Several kinds of sensors containing 2 or 3 ligands within one membrane were united into the array and tested for the analysis of multicomponent solutions of lanthanide cations, demonstrating mutual interference in mixtures. Chapter 5 contains the summary of the main research findings and conclusions.. 12. © 2018 Tous droits réservés.. lilliad.univ-lille.fr.
(13) Thèse de Yulia Ashina, Université de Lille, 2018. CHAPTER 1.. Potentiometric sensors. Electrochemical sensors The response of electrochemical sensors is in general governed by the processes of electronic and/or ionic transfer. There are different types of electrochemical sensors depending on the way the analytical signal is obtained. These types. are. amperometric. (voltammetric),. conductometric,. impedimetric. and. potentiometric sensors. In amperometry, the potential of an electrochemical cell is measured while the current flowing through the cell is varied. By contrast, for voltammetry, a subclass of amperometry, the current is measured as a function of the potential variation. Voltammetric sensing is very popular for construction of biosensors, with mainly enzymatic applications, for the specific determination of biomolecules [1719]. Voltammetry can also be applied for qualitative analysis, because the voltammetric peak current values are associated with the potential of Red/Ox halfreaction, making the recognition of different ions and functional groups of organic molecules possible. The most popular technique – cyclic voltammetry – is based on inverting the direction of the applied potential once the half-reaction point has been reached, so that the oxidized species get reduced and vice versa. Cyclic voltammetry can be used for the investigation of Red/Ox processes, e.g. reversibility, reaction speed, etc. [20]. Voltammetry is also extensively applied to study various fermentative reactions. One of the most popular devices are enzymatic biosensors which are used for the determination of glucose, and is based on glucose oxidase [21]. This kind of measurement can be performed not only in laboratory conditions but also on test strips and even as a component of implantable devices. This way, blood analysis became commercially available and simple enough for daily household use by untrained customers [22]. Another parameter of the electrochemical cell that can give essential information about the analyzed substance is conductivity. Conductometric sensors rely on the measurement of the conductivity of electrolyte solutions, which is a function of 13. © 2018 Tous droits réservés.. lilliad.univ-lille.fr.
(14) Thèse de Yulia Ashina, Université de Lille, 2018. the total ion concentration with respect to individual constants ki’ for each of the components:. k = F ki'ci. (Eq.1). where ci is the concentration of individual ions, F is the Faraday constant. The constant ki’ is determined by the ion mobility, ion activity coefficients and the dissociation degree of the electrolyte. Since the difference between mobility values is quite small for most of the ions (except for H3O+ and OH-), classical conductometric sensors are only suitable for the determination of the total ion concentration (e.g. salinity of seawater), and not for the distinction between the concentrations of individual species [1]. However, a few types of selective layer-based conductometric devices have opened new fields of application. For example, there are many types of gas sensors based on the measurement of the conductivity variation of a sensitive layer due to the absorption of the volatile compounds [23]. Electrochemical impedance spectroscopy (EIS) can be employed for the analysis of liquids [2]. The impedance of the electrochemical cell is evaluated under the application of a voltage of varying frequency. Electrochemical impedance (Z) is a complex multiparametric value that depends on double layer capacitance, electrolyte resistance, charge transfer resistance, Warburg impedance and some other parameters in complex systems. In practice, the equivalent electrical circuit considering all the contributions should be used for calculations. Considering the phase shift value φ and the Euler equation, the following expression is obtained, translating the dependence of electrochemical impedance on frequency:. Z ( ) = Z0 e i = Z0 (cos + i sin ). (Eq.2). The results of EIS measurements can be displayed by plotting |Z| as a function of the phase shift (Bode plot), or Re(Z) – the real part – as a function of Im(Z) – the imaginary part (Nyquist plot). One of the features of impedance spectroscopy is that the signal amplitude depends on the area of the working surface. The conductivity of the layer can also be influenced by selective interactions of analyte species with the 14. © 2018 Tous droits réservés.. lilliad.univ-lille.fr.
(15) Thèse de Yulia Ashina, Université de Lille, 2018. binding agents immobilized on the sensor surface. As one of the recent trends in EIS, these two features found an application for biosensing with interdigitated electrodes [24, 25]. In this thesis we will deal with potentiometric sensors. Their analytical signal is registered under zero-current conditions (without the current flowing through the electrochemical cell). The simplicity of potentiometric measurements together with the tendency to miniaturization brought up the concept of ion-selective electrodes (ISE). Starting from the glass membrane electrode that was originally used as ion-selective pH sensor [26], ISE became one of the most popular analytical instruments. Their analytical signal is the electromotive force (EMF) across the cell. It should be noted that unlike for voltammetric and conductometric sensors, the analytical signal for potentiometric systems does not depend on the surface area of the electrode. Techniques based on ISE have numerous applications (see 1.2.6) due to fast and inexpensive. manufacturing procedures,. low response. times, wide. working. concentration ranges and the relatively low limit of detection. The detailed description of some fundamental aspects and the working principle of ISE, their analytical characteristics, and modern applications are given in the following sections.. Construction of ion-selective electrodes (ISE) Potentiometric measurements are typically performed in an electrochemical cell, made of two half-cells – a reference electrode and an ISE itself. The EMF of such cell is equal to the potential difference between two half-cells, according to Eq.3:. EMF = Eref.el. − E ISE. (Eq.3). where Eref.el. and EISE are the potential values of the reference electrode and ionselective electrode, respectively. The potential of the system is determined by the EISE only if all other contributions are kept constant during the measurements. For this reason the reference electrode should be mechanically and chemically stable. The potential of the 15. © 2018 Tous droits réservés.. lilliad.univ-lille.fr.
(16) Thèse de Yulia Ashina, Université de Lille, 2018. reference electrode should be reproducible in time and at a given temperature, is reversible and sample-independent. Silver/silver chloride electrodes are the most widely applied reference electrode for electrochemical measurements (Fig. 1.1). This is a second-type electrode, based on two equilibrium reactions: a redox equilibrium at the Ag0/Ag+ interface, and a AgCl/Ag+ solubility equilibrium. Due to the low water solubility of AgCl, the concentration of Ag+ ([Ag+]) is considered to be constant in the inner KCl solution, whatever the sample is.. Figure 1.1. Silver/silver chloride reference electrode construction.. 1.2.1.. Solid membrane ISE. The history of ISE started with solid-state sensing membranes. The first type of solid membrane for ISE sensors were the glass membranes. These membranes, developed by Haber and Klemensiewicz in 1909 [27], are made of silicate glass doped with metal oxides, in order to provide for Frenkel-type defects in the glass lattice. These defects are acting like binding sites for H+. In general, glass membrane electrodes demonstrate excellent selectivity to H+ over a wide working range. As a consequence, these electrodes became the most widely employed chemical sensors. At high pH, 16. © 2018 Tous droits réservés.. lilliad.univ-lille.fr.
(17) Thèse de Yulia Ashina, Université de Lille, 2018. monovalent metal cations can interfere with the response, as [M +] becomes comparable with [H+] (alkaline error). This issue, however, can be fixed by doping the glass with e.g. Li+ ions. The development of glass membrane electrodes was followed by many others based on different membrane materials, such as chalcogenide glasses, polycrystalline metal sulphides etc. [23, 28]. One of the most remarkable examples of solid state ISE is monocrystalline LaF3 doped with Eu3+. This sensor is extremely selective to F-, with a detection limit as small as 10-10 mol/L [29]. The ISEs with solid state membranes are robust and convenient tools widely applied in routine laboratory practice. However, the number of analytes that can be detected with these sensors is quite limited. For example, in case of polycrystalline membranes, only simple inorganic anions (e.g. halides) and cations (copper, cadmium, lead) are usually detected. Moreover, the selectivity patterns of these sensors cannot be tailored to some particular analytical tasks as they are depending on the fundamental properties of the membrane materials – e.g. solubility of corresponding sulphides. Moreover, the difficulty of designing crystalline materials, selective for particular ions of interest, hinders their further development. Thus, many studies are devoted to the search of alternative materials for ISE membranes that could allow for selectivity tuning with a wide range of practical applications [30]. The use of organic ligands as ion binding sites became the most prominent strategy for the ISE technique development.. 1.2.2.. Liquid membrane ISE. In the 1970’s, liquid membrane ISEs with sensing components dissolved in organic solvent were developed [31]. In these membranes the sample-dependent changes in the EMF of the cell were generated by charge separation at the membrane/sample interface, once the analyte is extracted into the liquid membrane and complexed by an incorporated ligand. The main disadvantage of these membranes was that it requires handling liquid phases, which is not very convenient for routine laboratory use. Lately, the sensor configuration was optimized and relatively 17. © 2018 Tous droits réservés.. lilliad.univ-lille.fr.
(18) Thèse de Yulia Ashina, Université de Lille, 2018. big volumes of liquid organic matrices were transformed into thin liquid layers dwelling in thin pores of a special filter membrane. The most popular type of liquid membrane ISE was based on organophosphorus compounds (see e.g. reference [32]) (Fig. 1.2). Then the approach underwent further improvements [33] and liquid membranes of ISE were transformed in plasticized polymeric membranes [34],[35], which should be considered more as organic gels rather than liquids in the traditional sense. Nowadays this type of ISE membranes is the most widely spread one (see Fig. 1.3).. Figure 1.2. Liquid membrane ISE construction illustrated with the example from [32]. Here, 2-ethylhexyl phosphoric acid is used as an ion exchanger and di(octyl) phenyl phosphonate acts as a solvent.. 18. © 2018 Tous droits réservés.. lilliad.univ-lille.fr.
(19) Thèse de Yulia Ashina, Université de Lille, 2018. 1.2.3.. Polymeric membrane ISE. Plasticized polymeric ISE membranes are composed of organic solventplasticizers and polymers. The plasticizer is the media to dissolve active organic ligands and ion-exchangers. The polymer acts as an inert matrix to impart the desirable mechanical properties to the membrane. The mechanical and chemical stability of polymeric matrices, as well as their flexibility to experimental conditions, resulted in the dominance of ISE in some application fields, such as clinical determination of sodium, potassium, calcium and magnesium [36]. Thus, the main functional parts of these ISEs are more compact and easier to handle than those with liquid membranes discussed above. Nevertheless, as for liquid membranes, plasticized polymeric ISE membranes require the inner reference electrode to be immersed into the internal solution that acts as a liquid junction. The typical construction of the polymeric ISE is described in the Fig. 1.3. The membrane is in equilibrium with the liquid internal reference solution that basically contains low concentrations of the analyzed ion. Changes in the concentration of the analyzed ion in the membrane, caused by its migration from the sample solution, result in changes in the EMF value. The constituents of a conventional ISE membrane, along with the polymeric matrix, are the lipophilic additive and the complexing agent (ionophore). More detailed information on the function, properties and typical examples of each membrane component will be given in the following subsections.. 19. © 2018 Tous droits réservés.. lilliad.univ-lille.fr.
(20) Thèse de Yulia Ashina, Université de Lille, 2018. Figure 1.3. The electrochemical cell for ISE measurements. Polymeric matrix The polymers considered as membrane matrices now include acrylates, cellulose triacetate (CTA) [37], polyurethanes (PU) [27, 38], silicon rubbers [39], polysiloxanes [40] or polystyrenes [41]. By now, among the huge variety of available 20. © 2018 Tous droits réservés.. lilliad.univ-lille.fr.
(21) Thèse de Yulia Ashina, Université de Lille, 2018. polymers, the most common is high-molecular weight poly (vinyl chloride)(PVC) [42]. This is due to its low price, its chemical inertness and stability. While for liquid membrane ISEs, the permeability of components of interest does not represent a problem, this issue is the key for the design of polymeric membranes. To obtain sufficient ion mobility in the membrane phase, the polymer should have a glass transition temperature (Tg) below ambient temperature. In case of PVC membrane (Tg=80 oC), it is essential to use plasticizers to decrease the Tg. Moreover, an additional advantage is that the plasticizer acts as a solvent for all the other components of the membrane. A wide range of compounds utilized in PVC processing industry was adopted as plasticizers for the adjustment of membrane mechanical properties. The structure of these compounds, their functional groups and, consequently, their physico-chemical properties may differ drastically. The majority of plasticizers are the molecules containing long alkyl chains, providing sufficient lipophilicity and polar or polarizable functional groups (e.g. phenyl, nitro- or carbonyl). This allows enhancing the interactions of the plasticizer with both hydrocarbon and polar groups of the polymer (C-Cl for PVC) and thus provides a minimal plasticizer leaching into a sample solution. The most common plasticizers for polymeric sensor membranes are: 2-nitrophenyl octyl ether, 2-fluoro-2'-nitrodiphenyl ether, bis-(2ethylhexyl) sebacate, bis(2-ethylhexyl) phthalate. One of the most essential requirements for ISE membranes is homogeneity of their chemical composition. All the components of the membrane should have a sufficient lipophilicity to prevent their leaching from the membrane into the sample, thus avoiding decomposition of the membrane [43]. The exact lipophilicity can be estimated by structural increments for each of membrane components with methods of Quantitative Structure-Activity Relationship [44]. However, a simple relation can be established by comparison of the dielectric constant values (ε), but the drastic difference of this value with respect to that one of the plasticized polymeric membrane should be taken into account. For instance, for PVC plasticized by NPOE (1:2 wt %), ε is 14, while for the pure NPOE, ε is 21 [45]. It is also important to point out that the 21. © 2018 Tous droits réservés.. lilliad.univ-lille.fr.
(22) Thèse de Yulia Ashina, Université de Lille, 2018. terms “lipophilicity” and “hydrophobicity” do not mean the same – for example most of the fluorocarbons are hydrophobic but not lipophilic [23, 28]. Also, PVC-plasticized membranes may lose their mechanical properties within approximately 6 months, due to the gradual leakage of plasticizer and other components into the aqueous solution in contact with the membrane. Lipophilic additive In order to obtain stable analytical signals, ISE membranes should exhibit good ion exchanging properties. For this purpose, they contain an ionic additive which consists of a lipophilic ion-exchanging site (also called lipophilic ionic additive) and a counter-ion that can be easily substituted with the analyzed ion. The counter-ion should be relatively hydrophilic to allow fast ion exchange at the membrane surface. The typical lipophilic cation-exchangers are tetraphenyl borate derivatives [46] (Fig. 1.4 a). The alkyl substituted quaternary ammonium salts are examples of typical anion-exchanging lipophilic additives [47-49] (Fig. 1.4 b).. Figure 1.4. a – Potassium tetrakis[3,5-bis(trifluoromethyl)phenyl] borate (KTTFPB); b – tridodecylmethylammonium bromide (TDMABr). The presence of a lipophilic additive lowers the electrical resistance of the membrane and facilitates ion transfer. This additive also acts as a counter-ion for the analyzed ionic species, and thus it compensates the charge excess in a membrane and prevents co-extraction of the interfering counter-ions from the sample solution.. 22. © 2018 Tous droits réservés.. lilliad.univ-lille.fr.
(23) Thèse de Yulia Ashina, Université de Lille, 2018. Ionophore The main functional part of ISE membrane is the ionophore (ion-carrier). It is responsible for the selectivity of the plasticized polymeric ISE and is capable of reversible selective complexation with the target ion. Ionophores can be either neutral or charged molecules. The presence of ionophore molecules promotes permselective mass transfer across a phase boundary (see 1.2.4.) [50]. This lowers the energy required for transferring the ion of interest into the membrane. This turns into an increased selectivity compared to that of ion-exchanger-based ISE. One of the first substances that was used as an ionophore was an antibiotic, named valinomycin [51] (Fig. 1.5), which selectively binds potassium cations, discriminating sodium as its common interference. Valinomycin-based ISE is still a very common instrument in clinical analysis.. Figure 1.5. The chemical structure of valinomycin, a widely employed potassiumselective ionophore. The strategy to design an ionophore consists in creating a molecule having a required binding capability towards the analyzed species, but, also important, a sufficient affinity to the membrane matrix (e.g. solubility in the plasticizer). The latter requires a suitable lipophilicity, usually provided by the presence of long alkyl substituents or other hydrocarbon subunits. Advances in ionophore design resulted in the availability of a big range of organic compounds [52, 53] such as amides [54], polyethers, peptides, crown ethers [55], thiourea derivatives [56, 57], etc. The mechanism of formation of the complex between target ion and ionophore can be of 23. © 2018 Tous droits réservés.. lilliad.univ-lille.fr.
(24) Thèse de Yulia Ashina, Université de Lille, 2018. various natures, such as e.g. donor-acceptor interaction, hydrogen bonding or inclusion. The design of ligands relies on the concepts of Pearson acid-base, chelate effect, ligand conformation stability and other principles of ligand chemistry. The ligand selectivity can be influenced by incorporation of donor groups acting as binding sites. Depending on the number of binding sites involved into the formation of the complex, ligands are divided into mono- and polydentate. Ionophores for metal cations are mainly polydentate ligands, typically containing neutral oxygen or nitrogen donor groups [58-60]. The high affinity of these ligands to metal cations is driven by their lower energy of complex formation, compared to that of monodentate ligands (chelate effect, from greek “chela” - claw). The chelate effect is driven by the entropic contribution to complex stabilization which plays a bigger role for the preorganized polydentate ligands compared to monodentate ones. When the chelate ring size of the ligand molecule and the size of metal cation match well, it results in an enhanced selectivity of the complexation, which is typical for ligands with rigid structures (e.g. [61]). Introducing the different donor groups and substituents in the rigid backbone of the ligand may also affect the size-based selectivity of complexation [62]. For example, using diamide of dipicolinic acid A (Fig. 1.6) as an ionophore provides a two times higher sensitivity to Lu3+ cations compared to diamide B [63]. This effect can be explained by delocalization of the electron density from the phenyl substituent to the amide group in diamide A. This leads to the strengthening of a ligand-ion complex (socalled “effect of anomalous aryl strengthening” [64]). The concentration of the analyte in the membrane phase is restricted by the lipophilic additive concentration. The ligand concentration should be sufficiently higher than the one of the lipophilic additive.. 24. © 2018 Tous droits réservés.. lilliad.univ-lille.fr.
(25) Thèse de Yulia Ashina, Université de Lille, 2018. Figure 1.6. Dipicoline diamide ligands with different substituents.. 1.2.4.. Phase boundary potential model. The analytical signal of ISE sensors is determined solely by the membrane potential. According to Bakker et al. [65], it is a function of the phase boundary potential across the membrane. Initially, the membrane potential is the sum of the interface potentials and the diffusion potential, as in Eq. 4.. Emembrane = const + Ediff + EP .B.( membrane / sample ) + E *. P .B.( membrane / inner solution ). (Eq.4). where Emembrane is the membrane potential, Ediff is the diffusion potential and EP.B. and E*P.B are the phase boundary potential across the membrane at the membrane/sample and membrane/inner solution interface, respectively. If there is no concentration gradient across the membrane, the diffusion potential Ediff can be omitted. The potential at the membrane/inner solution interface E*P.B. can be considered constant and is sample-independent if the membrane is quite thick. These two assumptions bring up the following expression for membrane potential Emembrane (Eq. 5):. 25. © 2018 Tous droits réservés.. lilliad.univ-lille.fr.
(26) Thèse de Yulia Ashina, Université de Lille, 2018. Emembrane = const + EP .B.. (Eq.5). where EP.B. is the phase boundary potential at the membrane/sample interface. The physical meaning of EP.B. is the difference of potential arising from the separation of charges across the electrolyte and membrane interface. The thermodynamical definition of the chemical potential is described by Eq. 6,. (. ) (. ). 0 0 µaq − µorg = µaq + RT ln ai (aq ) + zFaq − µorg + RT ln ai (org ) + zForg =. =µ −µ 0 aq. 0 org. + RT ln. ai (aq ) ai (org ). (Eq.6). + zF (aq − org ). where µ is the electrochemical potential, μ0 is a chemical potential under standard conditions, z is an ion charge, ai is the activity of the ion, R is the universal gas constant, T is the absolute temperature and F is the Faraday constant. “(org)” or “(aq)” indices denote the organic or aqueous phases, respectively. The phase boundary potential at the membrane/sample interface can be expressed through the difference of electrochemical potentials (Eq.7):. EP .B. = = (aq − org ) =. 0 0 µaq − µorg. zF. RT ai (aq ) + ln zF ai (org ). (Eq.7). Once the membrane/sample solution equilibrium is reached, the activity of the target ion in the membrane phase ai org is expected to be constant. This way, the phase boundary potential, and, therefore, the membrane potential, both depend linearly on the analyte activity ai aq in the sample solution. Merging all the sample-independent contributions into E0 value results in the expression for the potential of electrochemical cell (Eq.8), also known as Nernst equation, which describes the main principle of potentiometric measurements, i.e. linear dependence of the EMF on the logarithmic ion activity:. E = E0 +. RT ln ai zF. ( aq ). (Eq.8). 26. © 2018 Tous droits réservés.. lilliad.univ-lille.fr.
(27) Thèse de Yulia Ashina, Université de Lille, 2018. 1.2.5.. Analytical characteristics of ISEs. The main characteristics of the sensor performance are well-established and are similar to those used for other analytical methods. Analytical characteristics of ISEs can be found in the reports of International Union of Pure and Applied Chemistry (IUPAC) [50, 66]. They are briefly recapped below. -. The response time is determined as the time required for EMF/time slope to become equal to a limiting value selected on the basis of the experimental conditions and/or requirements concerning the accuracy. As a figure of merit for sensors the time taken to reach 95 % of the response value (t0.95) can be used.. -. Stability stands for the ability of the sensor to maintain its performance for a certain period of time. Stability can be assessed with a drift value (e.g. variation of the analytical signal in a solution of constant composition and temperature).. -. Repeatability can be described as the variability of the signal within a series of measurements performed under the same conditions by a given operator within a short period of time.. -. Sensitivity of the ISE is expressed as a slope of the calibration curve of an ISE toward a given ion.. -. Lower limit of detection (LOD, detection limit) is a concentration for which, under the specified conditions, the cell EMF, E, deviates from the average EMF in region I by a multiple of the standard error of a single measurement of the EMF in this region I The upper LOD is also observed for the ISE and denotes the analyte concentration, corresponding to the limiting high activity response and in practice is denoted as a plateau on the response curve. The graphical representation of the LOD values is shown in the Fig. 1.7.. -. Selectivity is the ability of an ion-selective electrode to distinguish a particular ion from the others in a mixture, without generating false-positive or false-negative signals. Selectivity is determined by the value of potentiometric selectivity coefficient (kij).. 27. © 2018 Tous droits réservés.. lilliad.univ-lille.fr.
(28) Thèse de Yulia Ashina, Université de Lille, 2018. According to the Nernst equation (Eq. 8), the ISE response curve can be represented as a dependent of the EMF of the electrochemical cell on the logarithm of activity of the analyzed ion (lgai). The typical calibration curve is represented in Fig. 1.7. 250. upper LOD 59/z mV/dec dynamic range. EMF (mV). 200. 150. 100. 50. lower LOD 0 -7. -6. -5. -4. -3. -2. -1. logai. Figure 1.7. Graphical representation of the LOD values in the ISE calibration curve. The sensitivity of ISEs can be determined graphically as the slope of the linear part of the calibration curve. Under standard conditions and switching to decimal logarithm, the Nernst equation (Eq. 8) turns into Eq. 9,. E = E0 +. 0.059 lg ai (aq) z. (Eq.9). The “ideal” sensitivity of ISE, expressed in mV/dec (unit of a logarithm of analyzed ion activity), is equal to 59/z mV/dec (25o C), (z is the charge of the analyzed ion). As follows from the phase boundary potential model, reversibility of the complexation of ionic species by the ionophore is required. If this condition is not met, non-Nernstian values can be observed for sensitivity. The reason of this may also be 28. © 2018 Tous droits réservés.. lilliad.univ-lille.fr.
(29) Thèse de Yulia Ashina, Université de Lille, 2018. related to a presence of interfering ionic species with charge values lower than the one of the target ion (e.g. formation of M(OH)+ in polyvalent metal salt solutions). For this reason, all the secondary processes like hydrolysis should be suppressed, and potentiometric measurements should be performed under controlled pH in order to get reliable results. It should be noted that the sensitivity value can be determined for the concentration range between lower and upper LOD in the so-called dynamic range (denoted in blue in Fig.1.7). The limit of detection (LOD, detection limit) for ISEs, considering the logarithmic nature of the response, is defined by IUPAC as the intersection of the extrapolated linear part of the calibration plot and the “final low concentration level segments” for lower LOD, and the “limiting high activity response” for upper LOD [50]. Both lower and upper LOD values may be observed experimentally and determined graphically from the calibration curve [67]. LODs of classical polymeric membrane ISEs are around 10-6 M. Several methods can be employed to decrease the lower LOD value, e.g. super-Nernstian sensitivity values can find their application in trace-level analysis [68]. The equilibrium shift leading to super-Nernstian response can be generated intentionally by creating a concentration polarization at the membrane interface with applying the current pulse (so-called pulstrodes [69]), or by using acidic ionophores [70]. Another way to decrease the LOD is bufferization of the ISE inner solution. The use of an ion buffer (e.g. EDTA) maintains the constant concentration of the primary ion in the inner solution, so its leaching toward the sample does not occur. This prevents biasing the analyzed ion activity at the corresponding membrane surface as it is not influenced by the inner solution anymore [71]. The upper LOD is related mainly to the influence of interfering counter-ions. At high concentration of an analyte in a sample solution, the concentration of the ionophore-analyte complex in the membrane significantly increases. As the membrane gets enriched with excessive charge, brought in by the complexed ions, it tends to possess ion-exchanging properties for the counter-ions, promoting their co-extraction into the membrane phase. This phenomenon, also known as Donnan exclusion failure [50], is the primary factor framing the upper LOD of ISEs. This may have significant influence on the sensor 29. © 2018 Tous droits réservés.. lilliad.univ-lille.fr.
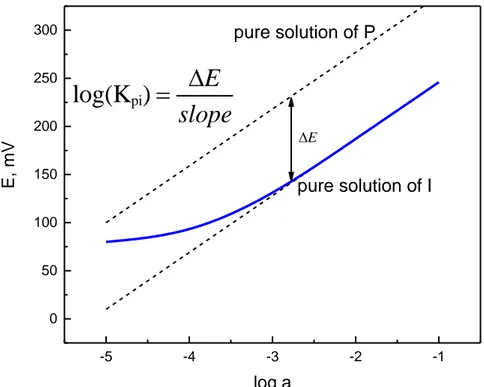
(30) Thèse de Yulia Ashina, Université de Lille, 2018. performance when one has strong complexation of highly lipophilic target ions by an ionophore [72]. The main contribution of interfering ions to the response is related to the ISE membrane permselectivity. Thus, one should have information about selectivity of the ISE prior to the analysis of real samples. Selectivity is driven mainly by ionophoreanalyte complex stability. In case of the presence of two interfering ions An+ and Bn+ in the solution at a time, for an ordinary ISE, two complex formation processes occur in the membrane media based on the neutral ionophore (I): kA An + + I ⎯⎯→ AI n +. B. n+. + I ⎯⎯→ BI kB. n+. (Eq.10). If the stoichiometry is the same for AI+ and BI+, the selectivity of the ISE would depend on the ratio of the two complex formation constants, Ka and Kb. Within the dynamic range for both target and interfering ions determination, the influence of the interfering ions was described by Nikolsky and Eisenmann [26, 73], later expressed as the semiempirical Nikolsky-Eisenmann equation (Eq. 11): z mix p RT mix E=E + ln ap + K pi ai zi , zpF i 0. (Eq.11). where apmix and aimix are the primary and interfering ion activities in their mixture, respectively, Kpi is a potentiometric selectivity coefficient and zi is the charge of the analyzed ion. The Nikolsky selectivity coefficient is the most widely applied measure of selectivity. It is supposed to be independent of the experimental conditions and thus, it is the main value to be reported for the characterization of selectivity. IUPAC suggests two procedures for the determination of this selectivity coefficient in practice: the separate solution method and the fixed interference method [67]. In the separate solution method, the lga vs E relations of an ISE for the primary (P) and interfering (I) ions are obtained independently. Then, the activities that correspond to the same EMF are used to determine the Kpi value. From the Nernst equation (Eq. 8) and Nikolsky30. © 2018 Tous droits réservés.. lilliad.univ-lille.fr.
(31) Thèse de Yulia Ashina, Université de Lille, 2018. Eisenmann equation (Eq. 11), the activity ap in a single-component solution can be expressed as (Eq.12):. ap = a. mix p. mix. + K pi ai. zp zi. (Eq.12). ,. In the limiting case where the primary and interfering ion activities induce the same EMF, the approximation of apmix = 0 can be taken. Therefore, apmix = ap, and the Kpi will be equal to the following ratio (Eq. 13):. a K pi = zpp a zi i. . (Eq.13). As E0 values for both calibrations (on P and I, respectively), are considered as constant, the resulting selectivity coefficient can be calculated according to the equation:. log K pi =. zp F ( E i − E p ) 2.303RT. a + log zpp a zi i. , . (Eq.14). If the target and interfering ions have the same charge value, the second part in the right term is equal to zero. Thus, an estimation of selectivity can be done by comparison of the EMF values for both ions at the same concentration (Fig. 1.8.).. 31. © 2018 Tous droits réservés.. lilliad.univ-lille.fr.
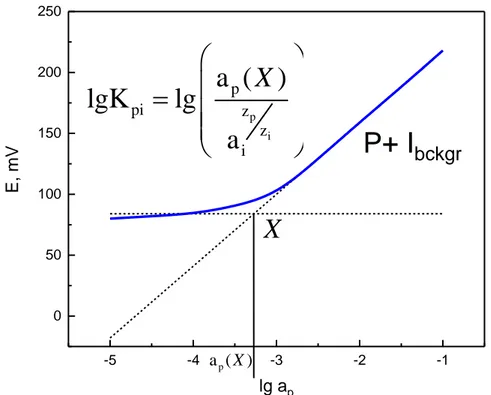
(32) Thèse de Yulia Ashina, Université de Lille, 2018. 300 250. pure solution of P. log(Kpi) =. E, mV. 200. E slope. E. 150. pure solution of I. 100 50 0 -5. -4. -3. -2. -1. log a. Figure 1.8. Graphical determination of the selectivity coefficient by the separate solutions method. The fixed interference method consists of the evaluation of the sensor sensitivity in the presence of a fixed concentration of the interfering ion [74]. The selectivity coefficient is then calculated according to the same approximation as for (Eq.12) (Fig. 1.9.) and aP is determined from the intersection of the two linear parts of the calibration curve that correspond to the lower LOD for P and ai background value (Eq.15):. a lg K pi = lg zpp a zi i. . (Eq.15). 32. © 2018 Tous droits réservés.. lilliad.univ-lille.fr.
(33) Thèse de Yulia Ashina, Université de Lille, 2018. 250. 200. E, mV. 150. ) X ( a lgK pi = lg p zp zi ai. P+ Ibckgr. 100. X 50. 0 -5. -4. ap ( X ). -3. -2. -1. lg ap. Figure 1.9. Graphical determination of the selectivity coefficient by the fixed interference method. Both the separate solution method and fixed interference method are based on the assumptions that the interfering ion only substitutes the target one at the ionic site, and that no “mixed ion response” is observed. Also, an equilibrium at the phase boundary is presumed. In case of deviations from a Nernstian response, it is recommended to use the matched potential method [75] instead. Unlike the two previous methods, the matched potential method is not bound by the limitations of the theoretical model. Within this method, a calibration for the target ion i is carried out by sequentially adding portions of Δi to the reference solution, containing known concentrations of i. Then the interfering ions j are added to an identical starting solution until the same potential change is observed [75]. As a figure of merit, the selectivity factor, ki,j is used. ki,j represents the ratio of Δi/Δj, that cause the same potential difference for both of the calibrations. The main disadvantage of the matched potential method is the dependence of ki,j on prescribed concentrations of the primary and. 33. © 2018 Tous droits réservés.. lilliad.univ-lille.fr.
(34) Thèse de Yulia Ashina, Université de Lille, 2018. interfering ions, and thus reported values should be provided together with experimental conditions.. 1.2.6.. Applications of ISEs and recent developments. Clinical analysis is the main application domain for ISEs, mainly for the determination of electrolytes in biological liquids. Valinomycin-based ISEs have up to now been employed for the determination of K + in blood. Other common application fields are soil analysis, plant analysis, quality control for food production, wastewater treatment or environmental monitoring [76-78]. The ease of operation, along with its reversibility and insusceptibility to the turbidity and color of the sample, allow ISEs to be used for online monitoring of technological processes [79]. Flow-injection systems were also successfully employed together with potentiometric detection for different analytical tasks [80]. The durability and long-term stability of polymeric membranes make ISE applicable even under extreme experimental conditions, such as in the analysis of soluble ionic species in Martian soils [81, 82] . The development of modern analytical methods is typically associated with the question of miniaturization [83]. Within the last 40 years, ISE membranes of 0.1–1 mm dimensions came into general use [84]. In some applications, even the sensors with the diameter in the order of 100 nm were reported [85]. Modern clinical analysis requires analyte volumes in the microliter scale. However, the analysis of microvolumes requires significant modifications of the technique. For instance, instead of the conventional reference electrode, another membrane ISE, highly selective to some ion of the background, can be used, as it is easier to miniaturize. Also, the concentration of the background ion should be kept constant in order to provide stable potential readings of the reference ISE [86, 87]. In the last decades, the construction of ion-selective field effect transistors (ISFET) revealed the possibility of reducing the scale of analytical instruments down to the micrometer size. One of the modifications of this technique consists of the 34. © 2018 Tous droits réservés.. lilliad.univ-lille.fr.
(35) Thèse de Yulia Ashina, Université de Lille, 2018. deposition of an ISE membrane on the transistor gate. For routine analysis, the durability of the system becomes especially important. Therefore, the range of possible membrane matrices significantly narrows, since, for example, a PVC matrix has a poor adhesion to the solid support of the ISFET [88], making this method very sensitive to the ambient conditions. A strategy for choosing the membrane composition should take into account the solubility of the components, adhesiveness of the polymeric matrix to the ISFET surface and membrane resistance, all at the same time. Recent studies are focused on ISFET geometry optimization [89, 90] using photopolymerized acrylic or polyurethane matrices [91]. Miniaturization of ISEs opened up the possibilities to integrate several technologies in one device, such as microfluidic platform [92]. An important problem in clinical analyses is the poor biocompatibility of ISE membranes that get in contact with biological liquids. For the majority of the membranes, an inflammatory effect on living tissues may be observed or the membrane may lose its functionality because of protein adsorption. Plasticizer leaching, inherent to PVC-plasticized membranes should be avoided, and for this reason, the membrane composition should be adjusted to the type of the biological object under analysis. This way, the requirement of haemocompatibility for medical applications brought cellulose triacetate and polyurethane into use for biocompatible membrane matrices [93]. For example, polyurethane-based membranes are widely applied for implantable devices [94]. A popular research direction is the development of disposable sensors for clinical analysis. A wide range of wearable electrochemical biosensors for online monitoring of electrophysiological parameters is available. For example, the concentration of glucose in saliva is found to be correlated with the blood glucose level, and saliva analysis can be used for indirect non-invasive monitoring of the glucose level in blood, lowering the requirements to biocompatibility [95]. By now, many types of compact devices have been constructed by immobilization of the sensing. 35. © 2018 Tous droits réservés.. lilliad.univ-lille.fr.
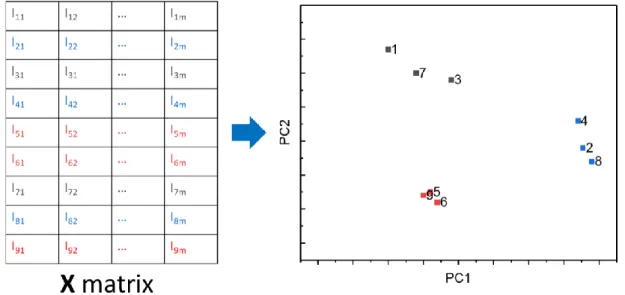
(36) Thèse de Yulia Ashina, Université de Lille, 2018. compounds into various polymers [96, 97], on textile support [98], paper support [99] and even in a form of tattoo-based sensors [100]. Another perspective for modern ISE is switching from traditional plasticized PVC membranes to plasticizer-free ones. This approach aims to eliminate the main problems of the plasticized PVC, i.e. plasticizer leaching and polymeric matrix degradation. The requirements the polymer should follow are in this case the same as those for the conventional membrane matrices: low Tg and resistance of the polymer and high solubility of the active sensing components in the membrane phase. In this area, remarkable results were demonstrated with various acrylate co-polymers by the group of Heng and Hall [101, 102]. They investigated the influence of the monomer content on the Tg and the influence of the molecular weight on the properties of the acrylate co-polymers. They could come up with sensor membranes that do not require the use of any plasticizer (or only at the low level of 10%). It was shown that copolymers containing more than 80% wt of n-butyl acrylate yield membranes with Tg below −20◦ C and allow obviating the need of the plasticizer.. 1.2.7.. Multisensor systems. Conventional ISEs often exhibit a high sensitivity towards several species at a time. There is very little chance for absolute selective complexation of one particular type of ions. This property is called cross-sensitivity. Moreover, the analytical objects under study often contain neutral species that can influence the sensor response towards ionic species. When analyzing multicomponent samples with ISE, the response function cannot be modelled with satisfactory precision using the traditional Nikolsky-Eisenmann equation. The problem of poor selectivity of a single sensor can be potentially solved with the use of multisensor approach. It consists of merging several sensors into an array and processing the response of this array by means of multivariate data analysis tools. This way, the data – the electrochemical signal – represent a kind of “fingerprint” of the analyzed multicomponent solution. This fingerprint can be processed further with various chemometric tools in order to derive 36. © 2018 Tous droits réservés.. lilliad.univ-lille.fr.
(37) Thèse de Yulia Ashina, Université de Lille, 2018. qualitative and quantitative information about the sample. Another important idea behind the development of multisensor approaches can be formulated as follows. While most of the complex quality parameters of a sample are not correlated with the content of a single chemical compound, a robust and reliable correlation with such parameters can still be found when multiple chemical compounds (groups of compounds) are being considered simultaneously. The elucidation of the detailed qualitative and/or quantitative composition of the sample may consume a lot of time and efforts and may still not produce the desired result. The multisensor arrays use the integral characteristics of the sample (e.g. its identity, such as belonging to a particular class of other samples, its taste attributes, toxicity (safety) or potential harmfulness of the sample for biota) as the output data instead of the information on the content or presence of a particular compound. The relative simplicity of the approach boosted numerous applications of sensor arrays in the food industry [103], manufacturing processes control [104], etc. When multisensor systems are aimed at evaluation of taste and quality parameters of food products, beverages and pharmaceuticals, the methodology is called “electronic tongue” (ET), and it has been a field under constant development since the mid 90’s [11, 105-108]. The traditional way of assessing the quality of food products is organoleptic and it is performed by descriptive sensory panels. It is well-known that taste is not directly correlated with the chemical structure of the constituents, but it is based on five basic taste features: sweet (taste of sucrose), sour (flavor associated with citric acid), salty (taste associated with sodium chloride), bitter (taste elicited by caffeine). The fifth one, umami, represents “taste intensity”. Umami receptors can be stimulated by, for example, glutamic acid. The resulting taste of the product is not just a superposition of these parameters, and, for example, the bitter taste of certain substances can be sometimes masked by the presence of sucrose. The sensitivity of the receptors differs in a wide range from person to person and depends on external factors, such as temperature, health condition etc. These circumstances complicate the objective perception of taste even within a well-trained sensory panel, so the results of routine determination are often biased. The evaluation of the taste of pharmaceutical has even 37. © 2018 Tous droits réservés.. lilliad.univ-lille.fr.
(38) Thèse de Yulia Ashina, Université de Lille, 2018. more difficulties due to the ethical implications associated with a sensory panel test of the substances that may have various health effects. The concept of “electronic tongue” (ET) consists of the evaluation of taste descriptors through mathematical models relating the response of a sensor array with target sample quality parameters (e.g. taste descriptors). The cross-sensitive sensor array intends to mimic the global selectivity concept, which assumes that every single sensor is not required to have specific interactions with the analyte [109], but should have a response towards several components of the sample simultaneously. The analysis of real samples by means of multisensor system is preceded by a “training” step where a set of samples with known characteristics (e.g. available from traditional sensory panel) is analyzed [110-113] and a regression model relating sensor responses with these parameters is constructed. Once the calibration is done, the mathematical model can be employed further to predict the target parameters in new samples based on the response of the multisensor system. ET may act as a complementary instrument to sensory panels in order to minimize their work load in routine analysis. In case of pharmaceutical samples using the ET is aimed to substitute human sensory panels completely. At the moment, there are numerous applications of ET described in the literature for the analysis of food products, beverages and pharmaceuticals [106, 112, 114, 115]. In spite of the name “electronic tongue”, the concept of cross-sensitive sensor arrays has found many applications far beyond the taste evaluation task. The multisensor approach allows for an elegant handling of complex analytical problems, like e.g. circumventing selectivity limitations of individual sensors. As a nice example of such advantage, one can consider the work in references [63, 116] addressing the quantitative analysis of individual lanthanides in their mixtures in aqueous solutions. Being neighbors in the periodic system of elements, lanthanides have similar electronic structure and thus very similar chemical properties. The determination of one particular lanthanide in the presence of others is a challenge for certain industrial applications (like e.g. analysis of spent nuclear fuel) which is hardly addressable by 38. © 2018 Tous droits réservés.. lilliad.univ-lille.fr.
(39) Thèse de Yulia Ashina, Université de Lille, 2018. using a conventional potentiometric sensor with one ionophore. It was shown that sensor arrays based on potentiometric membrane electrodes containing various ligands adopted from liquid extraction can effectively resolve lanthanide mixtures providing information on individual metal contents. Another interesting application field for multisensor systems is the analysis of complex media where individual sensors fail due to the large number of interfering species. A very representative example [117] is the quantification of metal content in sea water, where a multisensor system allows simultaneous determination of Cu2+, Zn2+, Cd2+ and Pb2+ in mixed buffered solutions at nanomolar level. Another example is the monitoring of industrial fermentation processes where numerous factors (presence of microbial population, specialized conditions, large number of interferents) hinder the application of individual selective sensors. This task can also be successfully accomplished with various sensor arrays, e.g. potentiometric sensor array can be used for automated on-line control of a fermentation process in a flow-through mode [118]. Within the last decade, a number of authors have considered the integration of sensor arrays into miniaturized devices to supply the needs of clinical analysis. For example, in the study in reference [119], flow injection was complemented by a multisensor approach in a “lab-on-a-chip” device. Also, the concept of sensor arrays as an alternative to more expensive instruments remains very popular for industrial process control. For instance, it can be advantageously used for waste water analysis or fermentation monitoring [104, 120]. Their low response time and the fast recovery of the sensor membranes make sensor arrays very useful for in-line monitoring procedures [121, 122]. Finally, the majority of the environmental applications of multisensor arrays is devoted to the analysis of natural waters [123, 124]. The main challenge today consists of the development of rapid test methods using compact devices for on-site measurements [125, 126]. Integral quality parameters that cannot be directly related to the presence of a single particular chemical substance in a sample can also be 39. © 2018 Tous droits réservés.. lilliad.univ-lille.fr.
(40) Thèse de Yulia Ashina, Université de Lille, 2018. predicted from the multisensor system response, like e.g. chemical oxygen demand [127] or toxicity in terms of bioassay [128].. Statement of purpose Potentiometric analysis with polymeric membrane ISEs is a rapidly growing research field, due to the numerous advantages of this method. Most of the studies nowadays are focused on lowering LODs, improving robustness, lifetime, and optimizing sensor performance in complex solutions. This manuscript describes three novel approaches to the development of polymeric membrane sensors in order to extend the analytical capabilities of the method. In the first part, the possibility of Raman transduction of analytical signal for ISE membranes is studied. The second part is devoted to sensor arrays based on ionophore-free membranes and the third section is a feasibility study of a multiionophore sensor array.. 1.3.1.. Raman transduction for ISE membranes. Raman spectroscopy can be employed for the analysis of aqueous solutions and for the determination of ionic species. There are numerous applications of this technique reported, ranging from the exploration of chemical reactions (e.g. disproportionation, hydration) to the monitoring of the content of ionic species [129131]. Obviously, some of the ions, e.g. monoatomic metal cations, have no vibrational modes and cannot be quantified with Raman directly. This issue can be circumvented using an indirect quantification procedure where the spectral signature of a reagent upon the interaction with the ion is registered [132],[133]. This approach, however, requires an additional step of preparation/titration of the sample solution. A possible way to simplify the analytical procedure is the micro-Raman investigation of a reagent immobilized in a solid matrix. The composition of a typical polymer plasticized ISE membrane not only allows traditional electrochemical transduction but also enables the readout of spectroscopic information. 40. © 2018 Tous droits réservés.. lilliad.univ-lille.fr.
Figure
![Figure 1.2. Liquid membrane ISE construction illustrated with the example from [32].](https://thumb-eu.123doks.com/thumbv2/123doknet/3623049.106465/18.892.139.769.341.705/figure-liquid-membrane-ise-construction-illustrated-example.webp)

+7

Documents relatifs