Analyzing the Effects of Product Architecture on
Technical Communication in Product Development Organizations
by
Manuel E. Sosa R.
Ingeniero MecanicoUniversidad Sim6n Bolivar, 1992
Master of Science in Mechanical Engineering Massachusetts Institute of Technology, 1996
Submitted to the Department of Mechanical Engineering in Partial Fulfillment of the Requirements for the Degree of
DOCTOR OF PHILOSOPHY IN MECHANICAL ENGINEERING
AT THE
MASSACHUSETTS INSTITUTE OF TECHNOLOGY
JUNE 2000
@ 2000 Massachusetts Institute of Teghnolggy. All rights reserved.
Signature of Author:
Manuel E. S sa RC, Depahment of Mechanical Engineering
May 22, 2000
Certified by:
Steven D. Eppinger, Associate Professor of Manaement 7Thesis Spe sor,9ocyog-4P6/ttee
Certified by: A W
David R.WallaceAAsociate Professor of Mechanical Engineering Chairman, Doctoral Committee
Certified by:
ThomaistiXln-,Professor of Management Doctoral Committee
Accepted by:
Acceptd by:Amn
A. &n$PAofeior of Mechanical Engineering
Chairman, CjmmitteinnlanudliatteStudents MASSACHUSETTS INSTITUTE
OF TECHNOLOGY
SEP 2 0 2000
Analyzing the Effects of Product Architecture on
Technical Communication in Product Development Organizations
by
Manuel E. Sosa R.
Submitted to the Department of Mechanical Engineering on May 22, 2000 in Partial Fulfillment of the Requirements for the Degree of Doctor of Philosophy in Mechanical Engineering
Effective communication in product development organizations has been identified as a key factor of product development performance. Furthermore, understanding how the development organization manages the knowledge associated with the product architecture is broadly recognized as a critical challenge for established firms facing architectural innovation. This thesis presents a research method and statistical analyses intended to enhance understanding of the coupling between the product architecture and the development organization.
The research method is summarized by three steps: 1) capture the product architecture by documenting design interfaces, 2) capture the development organization by documenting team interactions, and 3) couple the product architecture with the development organization by comparing design interfaces with team interactions. Our approach is illustrated by analyzing the development of a large commercial aircraft engine.
Several hypotheses are formulated to explain the mismatch between design interfaces and team interactions, that is, the cases when: 1) known design interfaces are not matched by team interactions, and 2) reported team interactions are not predicted by design interfaces. Effects due to organizational and system boundaries, design interface strength, design interface type, design interface redesign, indirect team interactions, and secondary design interfaces are studied. In addition, through the analysis of the distribution of cross-boundary design interfaces, modular and integrative systems are formally identified, and differences between designing modular versus integrative systems are studied.
Two types of statistical analyses were performed. First, categorical data analysis techniques were used to test the mentioned hypothesized effects. Second, a log-linear model, built upon social network analysis methods, was developed to study the association between design interfaces and team interactions controlling for effects of reciprocity, differential attraction, and differential expansiveness of both components and teams. Findings in this research are complemented with the results of another empirical study focused on the effects of distance and communication media use in geographically distributed development organizations.
By considering the results presented in this thesis, development organizations can improve the integration process for complex designs. The approach developed is particularly applicable to projects where the architecture of the product is well understood and the development team is organized around the product architecture.
Thesis committee: Prof. Steven D. Eppinger (thesis supervisor) Prof. David R. Wallace (chairman)
22 January 1971
Education
1987-1992
1994-1996
1996-2000
Biographical Note
Manuel Emilio Sosa Rosales
(msosa@alum.mit.edu)
Born in Merida, Venezuela.
Universidad Sim6n Bolivar. Caracas. Venezuela.
Bachelor of Science degree in Mechanical Engineering. CUMLA UDE.
Massachusetts Institute of Technology.
Master of Science degree in Mechanical Engineering
Research area: Design Optimization and Automation.
Massachusetts Institute of Technology
Ph.D. degree in Mechanical Engineering
Major: Product Development. Minor: Business Dynamics
Professional Experience
1992-1994
Petrochemical of Venezuela (PEQUIVEN). Mor6n, Venezuela.
Systems Engineer.
Summer 1995
Summer 1996
Mitsubishi Electric Research Laboratories. Cambridge, MA.
Summer Researcher.
Parametric Technology Corporation. Waltham, MA.
Technical Marketing Associate.
Research Interests
Information technology in product development;
Business dynamics; Network analysis methods.
Written
Work
(http://cadlab.mit.edu/users/msosa/research_phd.html):Sosa, M. E. "Optimizing the Packing of Three-Dimensional Shapes Using Genetic
Algorithms", unpublished Master's thesis in Mechanical Engineering, MIT, 1996.
Sosa, M. E., Eppinger, S. D., and Rowles, C. M. "Designing Modular and
Integrative Systems", Proceedings ofASME DTM Conference,
DETC2000/DTM14571, September 2000. (Nominated for Best Paper Award)
Sosa, M. E., Eppinger, S. D., and Rowles, C. M. "Understanding the Effects of
Product Architecture on Technical Communication in Product Development
Organizations".
Sosa, M. E., Eppinger, S. D., and Pich, M. "Factors that Influence Technical
Communication in Distributed Product Development: An Empirical Study in the
Telecommunications Industry".
Acknowledgments
Wow, and now I am writing the last portion of my thesis. This is perhaps the most important part of the thesis because it makes me realize about the ups and downs of the last four years, and the people who has directly or indirectly contributed on my achieving this goal.
I still remember the day that I fully decided to pursue a doctoral degree. I was making the conscious decision of formally learning how to identify relevant problems and seek for
innovative ways of solving them. To achieve such a demanding goal I put great emphasis on choosing the person who would be my mentor. Well, I cannot express in words how fortunate I have been of choosing Prof. Steven D. Eppinger as my advisor. Steve has surpassed all positive expectations I had for what I had considered the ideal advisor was. He has made the doctoral program the most fruitful teaming experience of my life. I have learned a new lesson, in many aspects of life, from every single interaction we have had all these years. Steve has timely provided me with the right doses of freedom, demand, encouragement, and wisdom. It has been great to have a mentor who believes in one as a student, as a researcher, and as a person.
The members of my thesis committee have been tremendously helpful throughout this thesis. Having Dave Wallace available in an everyday basis has provided me with a great deal of informal communication essential to succeed in a research project of this magnitude. Dave never forced the agenda on me, but instead contributed important guidance to pursue my own path. Having Tom Allen, one of the pioneers in this research area, as one of my thesis committee members has been a thrilling idea even before he accepted to be part of this team. I am very grateful to him for accepting being part of this committee, and even more grateful for the enormous contributions of his advises, questions, comments, and suggestions throughout this project.
This work would have been almost impossible to complete without the great help of Craig Rowles, a former SDM student, on the data collection. Our discussions to learn as much as we could from the data collected were very insightful. I am also pleased to thank Christophe Van den Butte, from The Wharton School, for his patience and willingness to share with me all his knowledge about social network analysis. It would have been impossible for me to learn so much so fast on that topic without his help.
The main reason we have the sixth chapter on this thesis is due to professors Michael Pich and Christophe Loch, from INSEAD. I am in great debt with both of them for hosting me at INSEAD during the Summer of 1998. That was one of the most productive summers of the last years. The discussions with Christophe were very insightful. I am very grateful to Mike for allowing me to explore his database, and encourage a joint research effort that has led to great results. The summer of 1998 would have not been such an amazing experience without the friendship of the doctoral students at INSEAD. Thanks to Stelios, Sezer, Goncalo, Nicola, and Stephanie for made me feel part of the group while I was there. I am particularly grateful to Stelios for his unconditional friendship and his willingness to read and discuss my crude paper drafts. His comments have been of great benefit in achieving a better understanding of my thoughts. Also, thanks to Paolo for being such a good host in Italy.
I cannot forget the people who gave me invaluable support during the first years of the program. My conversations with Prof. Ernesto Blanco were incredibly helpful to gain the maturity needed to face the challenge that it was going about to start. Thanks to other doctoral students Tim, Jim, Gu, Siduh, Jean Pierre, Osamah, Asif, and Jose, with whom I shared the struggling feelings of the first years.
I also want to thank other cadlabbers from whom I learned many lessons. I miss my conversations with Rahul, Krish, Kazu, Jay, Alok, Francis, Jun-Beom, Chun-ho, Dave, Paul, Naren, Shaun, Ashley, Nick, and Nicola. Thankfully the quality of cadlabbers has not decreased with time and I have been able to have good discussions with current cadlabbers Shaun, Ines, Priscilla, Bill, Stephen, Jeff, Juan Carlos, Jaehyun, Julie, Maria, and the rest of the gang.
Our DSM research team has been great. I am particularly grateful to Maria for all the quality time we spent together talking about research and life. I also thank Tyson, Nader, Inaki, Vesas, Jen, Soo-Haeng, Ali, and Dan for productive research conversations. I also thank Cara for being such a good assistant.
I am very pleased and proud of being part of the Center for Innovation in Product Development (CIPD) which has provided the funding to support this research effort. The
existence of the CIPD is clear evidence of how important interdisciplinary research is. I thank the directors, professors, students and staff of the CIPD for their constant support. I am also grateful
to Leslie and Joan for their support and their smiles every time I dropped by the mechanical engineering graduate studies office.
Many people have been indirectly involved in this project just by keeping me busy with other activities. I want to thank the people I have lived with all these years, Alvarito, Ingrid, Nicolas, and Chris, they helped a great deal just for being there every day. Thanks to my
unconditional friends Mark, Laura and Dom, for the extra brainpower they have given me since we met. Special thanks to Tony for being such an outstanding friend since I arrived to MIT, and for his perseverance on keeping me busy having fun.
There are many venezuelans I want to thank for their friendship and support, but then this section would be even longer. Special thanks to Enrique and Carlos for such a great system dynamics project, and to Leonela for her positive energy. Thanks to my "super-panas" in Venezuela Vitolo, Fofo, and Serrryo whom have been always in touch all these years.
I have been incredibly privileged of having a wonderful host family. The Briggss have contributed a great deal to my experience of living in US. Dave and Elaine have been a source of constant support, happiness, advises, and good experiences. I just love them with all my heart.
I want to thank "mi chamita" for sharing with me a wonderful time in the Boston area, for her unique way of enjoying life, and for teaching me how important listening to others is.
I can state with all certainty that this thesis would have never been completed without the support of all my family. Special thanks to my aunts Milagros and Morella. A million thanks to
"abuelita" for her infinite prayer. I thank my sister, Ana Beatriz, for spending so much time listening to me, even when I am senseless. She has been an infinite source of encouragement to me. I have no words to describe how thankful I am to my mom. She is without any doubt the most amazing person in this planet. As a friend, as a professional, as mom (and dad), she has been the greatest. She deserves all the credit for anything good I do.
Lastly, but certainly not least, I have to thank God for providing me with the stamina to start and conclude this project, and for putting all the people I mentioned above on my path through life.
Abuelita, linda, and mami:
This is for you all!
Table of Contents
1. INTRODUCTION... 17
1.1. COMPLEX PRODUCT DEVELOPMENT LEADS TO DECOMPOSITION AND INTEGRATION ... 18
1.2. TECHNICAL COMMUNICATION IN DEVELOPMENT ORGANIZATIONS ... 20
1.3. RESEARCH QUESTIONS... 21
1.4. THESIS OUTLINE ... 22
2. THE DEVELOPMENT OF A LARGE COMMERCIAL AIRCRAFT ENGINE...23
2.1. RESEARCH METHOD... ... 23
2.2. RESEARCH SITTE ... 24
2.3. CAPTURING THE PRODUCT ARCHITECTURE...25
2.3.1. Types of Design Interfaces...26
2.3.2. Criticality of the Design Interface ... 27
2.3.3. Design Interface Matrix... ... 27
2.4. IDENTIFYING MODULAR AND INTEGRATIVE SYSTEMS ... 29
2.5. CAPTURING THE DEVELOPMENT ORGANIZATION ... 32
2.5.1. Team Interaction Intensity ... 33
2.5.2. Team Interaction Matrix...33
2.6. COMPARING PRODUCT ARCHITECTURE AND DEVELOPMENT ORGANIZATION...35
3. FORM ULATING THE HYPOTHESES ... 37
3.1. DESIGN INTERFACES THAT ARE NOT MATCHED BY TEAM INTERACTIONS (THE "X" CELLS).... 38
3.1.1. Effect due to organizational boundaries...38
3.1.2. Effect due to design interface strength...39
3.1.3. Effect due to design interface type...39
3.1.4. Effect due to changes with respect to previous generation...40
3.1.5. Effect due to indirect team interactions ... 41
3.1.6. Effect due to cross membership of team members ... 42
3.1.7. Effect due to design escape...42
3.1.8. Effect due to measurement errors ... 42
3.2. TEAM INTERACTIONS THAT ARE NOT PREDICTED BY DESIGN INTERFACES (THE "0" CELLS).. 42
3.2.1. Effect due to system boundaries...43
3.2.2. Effect due to secondary design dependencies ... 43
3.2.3. Effect due to measurement errors ... 44
4.1. STATISTICAL TESTS... 45
4.1.1. The Chi-Square Test of Independence ... 45
4.1.2. The Chi-Square Test of Homogeneity ... 47
4.1.3. A Loglinear Model for Three-Dimensional Contingency Tables...47
4.2. THE BERNOULLI PROBABILITY DISTRIBUTION ... 48
4.2.1. Estimating the Constant Probability Governing a Bernoulli Distribution...50
4.3. OVERALLRESULTS ... 51
4.4. TESTING THE NOMINAL HYPOTHESIS ... 52
4.5. DESIGN INTERFACES NOT MATCHED BY TEAM INTERACTIONS...53
4.5.1. Effects due to organizational boundaries ... 54
4.5.1.1. Moderatiig effects due to systems modularity...55
4.5.2. Effects due to design interface strength ... 56
4.5.2.1. Moderating effects due to systems modularity...57
4.5.2.2. Moderating effects due to organizational boundaries...58
4.5.3. Effects due to design dependency type...61
4.5.3.1. Moderating effects due to systems modularity...62
4.5.4. Effects due to redesign of the interface...63
4.5.5. Effects due to potential indirect team interactions through other design teams...63
4.5.5.1. Moderating effects due to systems modularity...64
4.5.5.2. Moderating effects due to organizational boundaries...65
4.5.6. Indirect team interactions through system integration teams... 66
4.6. TEAM INTERACTIONS NOT PREDICTED BY DESIGN INTERFACES ... 67
4.6.1. Effects due to system boundaries ... 67
4.6.1.1. Moderating effects due to systems modularity...67
4.6.2. Effects due to potential secondary design interfaces...68
4.6.2.1. Moderating effects due to systems modularity...69
4.6.2.2. Moderating effects due to system boundaries ... 69
4.7. DISCUSSION OF RESULTS... 70
4.7.1.1. Designing Modular versus Integrative Systems ... 72
4.8. LIM ITATIONS OF THE ANALYSIS ... 73
5. A LOG-LINEA R M ODEL ... 75
5.1. MATHEMATICAL NOTATION... 76
5.2. THE P DISTRIBUTION ... 77
5.3. FiTTING P1 TO A SINGLE RELATIONAL DATA ... 79
5.4. OUR BASE LOG-LINEAR MODEL ... 82
5.4.1. Extending p to a two-relation data...82
5.4.3. Testing the correlation between design interfaces and team interactions...84
5.4.4. Fitting the base model to data ... 85
5.5. INCLUDING THE EFFECTS DUE TO ORGANIZATIONAIJSYSTEM BOUNDARIES...88
5.5.1.1. Testing Hypothesis H5.1... 89
5.6. INCLUDING THE EFFECTS DUE TO SYSTEMS MODULARITY...90
5.6.1.1. Testing Hypothesis H5.2... 91
5.7. DiscUssION OF THE RESULTS... 91
6. GEOGRAPHICALLY DISTRIBUTED PRODUCT DEVELOPMENT: AN EMPIRICAL STUDY IN THE TELECOMMUNICATIONS INDUSTRY...93
6.1. INTRODUCTION... 93
6.2. RELATED WORK IN COMMUNICATION IN GLOBAL PRODUCT DEVELOPMENT...94
6.3. FORMULATING THE HYPOTHESES... 95
6.3.1. Communication Drivers... ... 96
6.3.2. Communication Barriers ... 98
6.3.3. M edia Choice: ... 99
6.4. THE EMPIRICAL STUDY ... 102
6.5. STATISTICAL ANALYSIS ... 106
6.5.1. Communication Frequency... 108
6.5.2. M edia Choice... 110
6.6. DISCUSSION OF RESULTS... 112
6.7. LIMITATIONS AND FUTURE RESEARCH ... 115
7. CONTRIBUTIONS AND FUTURE W ORK... 117
7.1. ABOUT THE RESEARCH M ETHOD ... 117
7.2. ABOUT THE ANALYSIS ... 118
7.2.1. Categorical data analysis ... 118
7.2.2. The log-linear model... 119
7.3. DESIGNING MODULAR VERSUS INTEGRATIVE SYSTEMS... 120
7.4. MANAGERIAL IMPLICATIONS ... 120
7.5. FUTURE RESEARCH DIRECTIONS ... 122
A. CHI-SQUARE TESTS RESULTS... 133
B. THE EFFECTS DUE TO INTERFACE REDESIGN... 144
B.I. REGRESSION ANALYSIS... 144
B.4. CHI-SQUARE TESTS RESULTS ... 145
B.5. SAMPLE OF SURVEY USED ... 147
C. AN ALGEBRAIC MODEL TO ADDRESS VARIOUS TASK ASSIGNMENTS ... 148
C.1. MODEL DESCRIPTION ... 148
C.2. PROOF OF THE M ODEL... 149
C.3. PROPERTIES OF THE MODEL ... 149
C.3.1. Associative property ... 150
C.3.2. About symmetry of T ... 150
If A is symmetric, then T is symmetric... 150
C.3.3. Inertia Law of Sylvester ... 150
C.3.4. Markov transition matrix... 150
List of Figures
Figure 1-1. Levels of Integration Effort in a Development Organization...20
Figure 1-2. Main Research Question...21
Figure 2-1. Systems of a Large Commercial Aircraft Engine...25
Figure 2-2. Design Interface Matrix (binary)...
29
Figure 2-3. Distribution of design interfaces of Externals and Controls system...30
Figure
2-4.
Distribution of design interfaces of Mechanical Components system...30
Figure
2-5.
Distribution of design interfaces of HPC system...
31
Figure 2-6. Team Interaction Matrix (binary)...35
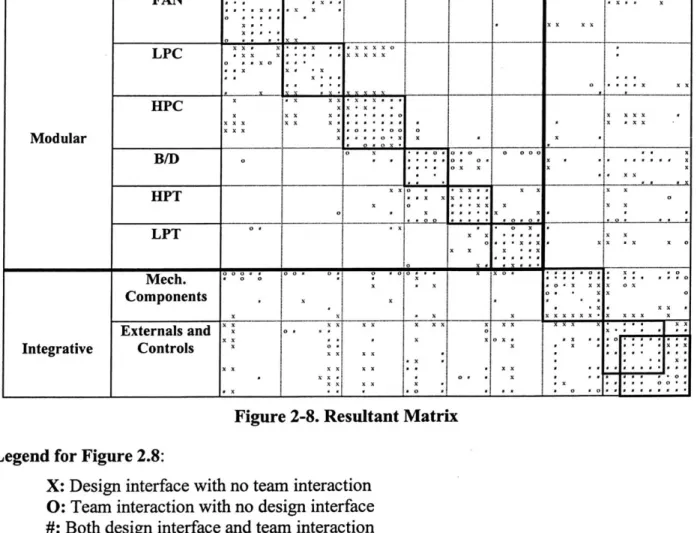
Figure 2-7. Comparing Product Architecture and Development Organization Interactions...36
Figure 2-8. Resultant M atrix ...
36
Figure 3-1. Four possible values of each cell of the resultant matrix...37
Figure 3-2. Potential Indirect Team Interaction between Teams A and B...41
Figure 3-3. Potential Secondary Design Dependency...43
Figure 4-1. O verall Results ...
52
Figure 4-2. a) Expected values under H..
b)
X2values...53
Figure 6-1. Factors that influence technical communication ...
96
Figure 6-2. Time-space domain of communication media...100
Figure 6-3. Effects of distance on media choice (H6.7)...
102
Figure 6-4. Dyad-distance profiles for each of the three project samples...
108
Figure 6-5.Distance-based linear regression results...1III
Figure 6-6. Sum m ary of results...
113
List of Tables
Table 2-1. Systems and Components of the Engine Studied ...
26
Table 2-2. Chi-square test results. Comparing externals and controls system with high-pressure
com pressor system ...
31
Table 2-3. Chi-square test results. Comparing externals and controls system with mechanical
com ponents system ...
32
Table 2-4. Team Interaction Intensity...
33
Table 4-1. Chi-square test of independence. Effects of organizational boundaries...55
Table 4-2. Chi-square test of homogeneity. Effects of organizational boundaries t...56
Table 4-3. Joint effects of design interface strength and organizational boundaries t...59
Table 4-4. Chi-square test of homogeneity. Organizational boundaries controlling for design
interface strength...
60
Table 4-5. Chi-square test of homogeneity. Design interface strength controlling for
organizational boundaries. ...
61
Table 4-6. Summary of results ...
72
Table 5-1. Dyadic Contingency Table ...
77
Table 5-2. Results of fitting base model to data...
87
Table 5-3. Models extended to capture effects due to organizational/system boundaries...89
Table 5-4. Models extended to capture moderating effects due to systems modularity...91
Table 6-1. Description of variables used in the analysis...
104
Table 6-2. D escriptive statistics ...
106
Table 6-3. Correlation between the independent variables ...
106
Table 6-4. Correlations between the dependent variables...
106
Table 6-5. Regression results for communication frequency
t...
...109
Table 6-6. Results for the effects of distance on media choice...111
-A 0\
1. Introduction
"Hay hombres que luchan un diay son buenos.
Hay otros que luchan un aio y son mejores. Hay quienes luchan muchos anios
y son muy buenos.
Pero hay los que luchan toda la vida: esos son los imprescindibles."
-Bertolt Bresch
(en Sueflo con Serpientes (1975), de Silvio Rodriguez) "There are men that fight for a day and they are good. There are others that fight for a year and those are better. There are those that fight for many years
and those are very good. But there are those that fight all their lives: those are the indispensable."
-Bertolt Brescht
(in I Dream about Snakes (1975), by Silvio Rodriguez)
The increasing need to compete in established markets as well as to address new markets in order to sustain corporate growth is adding more pressure onto product development
organizations to improve their development performance. This thesis introduces a method to understand to what extent the architecture of a product determines the technical interactions between design teams.
This work is motivated by the crucial importance of product development in today's businesses and the need to improve our understanding of the communication process in
development organizations. Much has been written about process improvement in the product development arena and in particular about the role of effective communication in product development teams. Allen (1977) pioneered the stream of research dedicated to investigate how effective internal and external communications stimulate the performance of development organizations. Clark and Fujimoto (1991) relate successful development in the auto industry to intensive communication between upstream and downstream activities. Wheelwright and Clark (1992) emphasize the need to improve communication when and where it certainly improves
project performance. Ulrich and Eppinger (1995) also emphasize the need to facilitate the exchange of essential information in order to speed up the development process.
Under the information processing perspective introduced by Alexander (1964), a product development process transforms a set of inputs (e.g. customer needs, product strategy,
manufacturing constraints) into a set of outputs (e.g. product design). This typically requires that members of a product development team communicate with others, either within or outside the development team, in order to accomplish their development activities. Thus, communication becomes an important correlate of R&D performance (Allen (1964); Keller (1986); De Meyer (1991); Hikanson and Nobel (1993)). As De Meyer noted, "one of the most important
productivity problems in R&D is stimulating communication among researchers" (1991: p. 49). The objective of our study is to analyze the coupling of the architecture of the product to be developed and the structure of its product development organization. By predicting technical communication in this way, we aim to provide a method that improves planning of development projects where the architecture of the product is known in advance.
From a strategy viewpoint, Henderson and Clark (1990) identified how critical it is for established firms to recognize novel product architectures. Furthermore, improved development of architectural knowledge provides a competitive advantage for firms facing architectural innovation. The approach illustrated in this thesis provides important insights for managers addressing product and organizational changes.
1.1. Complex Product Development Leads to Decomposition and Integration This thesis addresses the problem of understanding technical communication in complex product development. We focus on the development of complex but relatively mature products, such as an automobile, a computer, or an aircraft engine. The general approach when developing complex products is to decompose the product into systems, and if the systems are still too complex, decompose these into smaller sets of components (Alexander (1964), Simon (1981), Smith and Browne (1993), McCord and Eppinger (1993), Pimmler and Eppinger (1994), Eppinger (1997)). Consequently, product architecture is defined as the scheme by which decomposed elements of a product are arranged into sets of components in order to meet its functional requirements (Ulrich and Eppinger, 1995).
Ulrich (1995) defines several types of architectures according to how the product's functions are mapped onto its physical components. A key feature of product architecture is the degree to which it is modular or integral. Modular architectures exhibit direct mapping between functions and physical elements, and have well-defined interfaces between physical components. On the other hand, integral architectures spread functions across physical components, resulting in more complex interfaces between them (Ulrich and Eppinger, 1995). In very complex
products, we apply these definitions at the level of the many systems (and subsystems) which comprise the product. We will refer to modular systems as those exhibiting modular architecture characteristics while integrative systems are those revealing integral architecture features.
From an organizational standpoint, teams are commonly organized around the architecture of the product. In most technical products we can observe a clear mapping between the product architecture and the development organization which designs it (McCord and Eppinger (1993), Pimmler and Eppinger (1994)). Complex development projects usually involve the efforts of hundreds or even thousands of team members. A single team does not design the entire product at once (too complex). Rather, many teams develop the components, or systems, and work to integrate all of these components to create the final product (von Hippel (1990)).
Design teams face two important levels of integration during the development of complex products. Function-level integration takes place within each cross-functional design team when they have to coordinate efforts in order to design their respective components. System-level integration takes place across design teams in order to integrate the components (designed by each team) to assure the product works as an integrated whole. Furthermore, we distinguish two types of system-level integration efforts. Within-group system-level integration effort, which takes place between teams that design components of the same system. Across-group system-level integration effort, which takes place between teams that design components that belong to different systems.
Figure 1.1 illustrates the various levels of integration faced by the development organization. This thesis focuses on system-level integration efforts. We aim to better understand how the coupling of product architecture and organizational structure drives system-level coordination efforts across design teams.
Development
Organization
System-level teams
System-level
integration
(across groups) Sse-ee
.1isntegration Cross-functional (withingoups) design teams Team members Functional-level integration
Figure 1-1. Levels of Integration Effort in a Development Organization
1.2. Technical Communication in Development Organizations
Previous research (Allen (1997), Morelli et al (1995)) has identified three types of technical communication in development organizations.
* Coordination-type. Team members communicate to coordinate their tasks. Technical information transfer about task related issues. This type of communication is critical in project-based organizations as the one we are studying on this paper. In this type of organization better project performance is achieved by accomplishing effective communication across disciplines (Allen and Hauptman (1990)).
* Knowledge-type. Team members communicate with their peers to keep up to date with the latest developments in their disciplines. Consultation, instruction and skill development. This type of communication is particularly important to maintain technology currency within specific disciplines, which is the underline goal of functional organizations (Allen and Hauptman (1990)).
For the purpose of this thesis, we are concerned with coordination-type communications,
which are directly related to the system-level integration effort across design teams we want to
understand. Several researchers have focused their efforts on predicting and understanding
communication patterns in development organizations. Allen (1977, 1997) has proposed models
based on distance separation between team members in R&D organizations to estimate the
probability they engage in technical communication. Griffin and Hauser (1992) showed that
using Quality Function Deployment (QFD) practices enhances technical communication within
the boundaries of the development teams, but reduces the communication levels across teams'
boundaries. Morelli et al. (1995) showed that coordination-type communications could be
predicted by analyzing the task structure of development projects. Van den Bulte and Moenaert
(1998) studied the effects of R&D collocation on cross-functional communication. Finally, we
present in chapter seven an empirical study in the telecommunications industry about how
distributed development organizations use various communication media (Sosa et al. (2000)).
1.3.
Research Questions
Complex products are decomposed into systems, and these systems are further decomposed
into components. The arrangement of these physical sets of components defines the architecture
of the product. Similarly, development organizations are usually split into design teams that
develop each of the components that comprise the product. Figure 1.2 illustrates the main
research question we want to investigate: How does the architecture of a product drive the
technical communications between the teams which design it?
Product Decomposition Development Organization
into Physical Systems into Design Teams
ow does product architecture drive design team interactions ?
Within this context, we are particularly interested in answering the following questions:
* How accurately can we predict coordination-type communication by analyzing the coupling
of product architecture and the structure of the development organization?
* Why do some design interfaces between components not correspond to technical interactions
between the teams that design them?
* Why do design teams that develop independent components still engage in technical
interaction?
* Is there any difference in the communication patterns of design teams that develop modular
systems versus design teams that develop integrative systems?
* How can managers mitigate the negative effects of geographically distributed development
teams?
1.4.
Thesis Outline
Chapter 2 describes our research method in the context of the development of a large
commercial aircraft engine. In chapter 3, we formulate the hypotheses that explain the mismatch
between the product architecture and the design team interactions. Chapter 4 contains the results
of the analysis of categorical data completed to test the hypotheses posed in chapter 3. A
log-linear model that addresses the limitations of the categorical data analysis is presented in chapter
5.
An empirical study conducted in the telecommunications industry to address the effects of
media use on geographically distributed development organizations is presented in chapter 6.
Finally, the conclusions of the thesis and future research directions are outlined in chapter 7.
2. The Development of a Large
Commercial Aircraft Engine
"Y cuando salto de cubierta
y me abandono a la corriente
Nuevasformas crecen son tan atractivas quiero descansar de todo ayer
Y voyflotando por el rio
voy envuelto en la corriente. Hombre al agua"
(Gustavo Cerati/Zeta Bosio, 1990)
In this chapter we describe the research method we used to study the coupling of the architecture of a product and the development organization that designs it. We illustrate our approach in the context of the development of a large commercial engine. After describing how to capture the architecture of the engine, we define the concepts of modular systems and
integrative systems. We also describe how we capture the structure of the development
organization, and its team interactions. Finally, we illustrate how to map the product architecture and the development organization into a single matrix.
2.1. Research Method
This section describes our method of comparing the architecture of a product with the structure of its development organization. Our approach involves three steps:
1) Capture the product architecture. By interviewing design experts', we document how the product is decomposed into systems, and these systems into components. Then, we ask them to identify the interfaces required for functionality between the components that comprise the product. We represent such design interfaces in a design interface matrix.
These people have a deep understanding of the product architecture. They are not necessarily the people who design the product.
2) Capture the development organization. We first identify the design teams responsible to develop the product's components. Then, by surveying key members of the design teams we capture the intensity (i.e. criticality and communication frequency) of the interactions between them. We represent such team interactions in a team interaction matrix. 3) Compare the product architecture and the development organization. Finally, we
compare the design interface matrix with the team interaction matrix to answer the research questions posed in chapter one.
2.2. Research Site
We apply this approach to the design of a large commercial aircraft engine. The engine studied was a derivative engine. That is, it was the third generation in a family of engines, the
112-inch-fan engine, which is an ultra-high-thrust model. It covers the 74,000 to 98,000-pound-thrust class to meet the current requirements for the Boeing 777 twinjet. It was the launch engine for the 777, entering service in 1995. The model studied is the most powerful commercial engine in the world, and its diameter is nearly as wide as the fuselage of a Boeing 737. Figure 2.1 exhibits a cross-section diagram of the engine studied.
Several factors justified the selection of the project to study. First, the project chosen was a complex design that exhibited explicit decomposition of the engine into systems, and these into components. Furthermore, the engine was comprised of both modular and integrative systems.
Second, the way the development team was organized around the architecture of the product facilitated the implementation of our approach. Third, the model studied was the most recent engine program to complete design and development, and almost all team members involved in
the initial development phase were still accessible. Finally, the engine studied was part of a family of large commercial engines with two new derivatives planned whose development programs had the potential to gain directly from this analysis. For more details about the general organizational structure of the firm and the data collection process refer to Rowles (1999).
As stated before, the engine studied was the third generation in a family of engines. Indeed, its components were (in average) 60% redesigned with respect to the second generation. On the organizational side, about 80% of the organization that developed the engine studied was also involved with the development of the second generation of this engine.
2.3.
Capturing the Product Architecture
The engine analyzed was decomposed into eight systems (see Figure 2.1). Each of these
systems was further decomposed into five to seven components each (see Table 2.1). Six out of
the eight systems (the fan, the low-pressure compressor, the high-pressure compressor, the
burner/diffuser, the high-pressure turbine, and the low-pressure turbine) exhibited a modular
architecture in which the interfaces between their components were clearly defined among
adjacent components (modular systems). On the other hand, the components of the other two
systems (the mechanical components, and the externals and controls) were physically distributed
throughout the engine exhibiting an integrative architecture. Components, such as the main shaft
and the external tubes are examples of these types of distributed components within the
integrative systems. In total, the engine was decomposed into 54 components grouped into eight
systems, of which six were modular systems and three were integrative systems. (In the next
section we discuss in detail the basis of this categorization.)
Mechanical
Components
Externals and Controls
Table 2-1. Systems and Components of the Engine Studied
System
Number of
Components
Fan
7
Low-Pressure Compressor (LPC)
7
High-Pressure Compressor (HPC)
7
Burner and Diffuser (B/D)
5
High-Pressure Turbine (HPT)
5
Low-Pressure Turbine (LPT)
6
Mechanical Components (MC)
7
Externals and Controls (EC)
10
2.3.1. Types of Design Interfaces
After documenting the general decomposition of the product, we proceeded to identify the
interfaces between the
54
components of the engine. Researchers in Engineering Design (Suh
(1990), Pahl and Beitz (1991)) have modeled functional requirements of product design in terms
of exchanges of energy, materials, and signals between elements. Based on a method proposed
by Pinmler and Eppinger (1994) we distinguished five types of design dependencies to capture
the design interfaces between the physical components:
* Spatial dependency indicates a requirement related to physical adjacency for alignment,
orientation, servicability, assembly, or weight.
* Structural dependency indicates a requirement related to transferring loads, or containment.
* Energy dependency indicates a requirement related to transferring heat energy, vibration
energy, electric energy, or noise.
* Material dependency indicates a requirement related to transferring airflow, oil, fuel, or
water.
2.3.2. Criticality of the Design Interface
After design interfaces were identified, we captured the level of criticality for each dependency in the overall functionality of the component in question2. Using the five-point scale
used by Pimmler and Eppinger (1994) we capture the level of criticality as: Required (+2): Interface is necessary for functionality.
Desired (+1): Interface is beneficial, but not absolutely necessary for functionality. Indifferent (0): Interface does not affect functionality.
Undesired (-I): Interface causes negative effects, but does not prevent functionality. Detrimental (-2): Interface must be prevented to achieve functionality.
2.3.3. Design Interface Matrix
We mapped the design-interface data into a square (54x54) design interface matrix3. The identically labeled rows and columns name the 54 components of the engine, and their
sequencing follows the physical arrangement of the systems within the engine. Indeed, the systems were sequenced following the airflow through the engine. Each off-diagonal cell of the matrix contains a vector of five values representing the degree of criticality of the five types of design dependency for a single design interface. Hence,
2 This does not force design interfaces between components to be reciprocal.
3 The design interface matrix can be described as a special form of design structure matrix (DSM). For a formal
A5454= Design Interface Matrix mad
a=
<7'
c,"unhal
where,
(2.1)
C=
criticality of the interface of type" d" between components"i" and "j" ,for funcionaity of component" i"C =[-2,-1,0,+1,+2J
C?. is undefined for i = j
A5, =Design Interface Matrix(binary)
aq= Iif aI>0
a,-.j= 0 if la I= 0
For graphical simplicity, Figure 2.2 shows a binary version of the design interface matrix.
The off-diagonal elements of the matrix are marked with an "X" for each pair of components that
shares at least one design interface (any non-zero level of criticality). Reading across a row
corresponding to a particular component indicates the other components it depends on for
functionality. The diagonal elements are meaningless and are shown to separate the upper and
lower triangular portions of the matrix. The boxes around the diagonal indicate the eight system
boundaries. Marks inside the boxes represent design interfaces between components of the same
system, whereas marks outside the boxes indicate interfaces between components of different
systems. The first six systems in the matrix correspond to the six modular systems, while the last
two systems correspond to the two integrative systems. Note that the integrative systems have
design interfaces with components in every system of the engine.
Modular Systems FAN system
I
I ix (7 components) Ix X N X X . xxx I LPC system 1 X -T_ (7 components) x . lxxx X X X X X X X X X X X .X X X X X B/D ystm X. X XX X X XX X X X X XXX HPC system X (5 components) x xi BFF system X . X X X X X X X (6 components) x~X
XT X X XX X X X X XX
(7MT poens co X X XX XX X XXX XX X X X X X X X X X X X Mech. Components xX
X
x
XX
XX
(7 components) I j x x X x~
x X1 IxxxxxX
XX
XX XXX XX X X X X X X X X X X X X! X X X X X X X X X X Integrative Externalsand jx Ix x xx I~~
XX Controls X x xX
XX
X X X XX
XX
X
X
(a components) ! ) I t h xx xxx x lx X XFigure 2-2. Design Interface Matrix (binary)
2.4.
Identifying Modular and Integrative Systems
The first six systems of the design interface matrix are those in which design interfaces
are primarily among adjacent components (modular systems). In contrast,, the mechanical
components system, and the externals and controls system exhibit design interfaces distributed
throughout the engine (integrative systems).
To determine the degree of modularity (and integrality) of each system we analyzed the
distribution of design interfaces across system boundaries. System boundaries are highlighted by
the boxes along the diagonal of the design interface matrix. Marks inside the boxes represent
design interfaces between components of the same system, whereas marks outside the boxes
indicate interfaces between components of different systems. Light boxes throughout the matrix
enclose the cross-boundary design interfaces between two systems.
Figure 2.3 shows the number of design interfaces between the externals and controls
system and the six modular systems. Similarly, Figure 2.4 shows the number of design interfaces
between the mechanical components system and the first six modular systems. To visually
compare the difference in distribution between modular and potential integrative systems, Figure
2.5
shows the distribution of the design interfaces between the high-pressure compressor (HPC),
which is the least modular of the six systems, and the other modular systems.
Table 2.2 shows the results of the Chi-square test performed to test the alternative
hypothesis that "the distribution of design interfaces of the externals and controls system is
statistically significantly different from the distribution of the high-pressure compressor system".
The test resulted in a
X
2equal to 29.880 which is greater than the critical value of 9.488 (for
c=0.05 and four degrees of freedom). The expected values shown in Table 2.2 are based on the
distribution of the design interfaces of the externals and controls system. The actual values are
the number of design interfaces of the high-pressure compressor system. Similar results were
found when comparing the distribution of cross-system design interfaces of the externals and
controls system and the other five modular systems.
Externals and Controls
40 30 U) 20 FA 10 C 0 FAN LPC HPC B/D HPT LPT Systems
Figure 2-3. Distribution of design interfaces of Externals and Controls system
Mechanical Components 14 13 10 2 0 FAN LPC HPC BID HPT LPT Systems
Figure 2-4. Distribution of design interfaces of Mechanical Components system
Figure 2-5. Distribution of design interfaces of HPC system
We found that the distribution of design interfaces of the externals and controls system,
and the mechanical components system are similarly distributed among the first six modular
systems. Table 2.3 shows the results of the Chi-square test performed to test the null hypothesis
that "the distribution of design interfaces of the mechanical components system, and the
distribution of design interfaces of the externals and controls system are statistically equivalent".
The test resulted in X2 equal to 6.237 which is smaller than the critical value of 11.070 (for
a=0.05 and five degrees of freedom). We cannot, therefore, reject the null hypothesis of no
difference in the distribution of design interfaces for the two systems.
Table 2-2. Chi-square test results. Comparing externals and controls system with
high-pressure compressor system
System Expected fraction of Expected number of Actual number of X2 design interfaces design interfaces of design interfaces
based on Ext/Controls HPCt of HPC
FAN
15.38%
7.692
8
0.012
LPC
27.35%
13.675
30
19.488
B/D
29.06%
14.530
5
6.251
HPT
14.53%
7.265
5
0.706
LPT
13.68%
6.838
2
3.423
Total
100.00%
50.000
50
29.880
* The fraction of design interfaces between the external and controls system and the fan system is 18 out of a total of 117 design interfaces, that is, 15.38%. Hence, the expected number of design interfaces between the HPC system and the fan system, under the null hypothesis, is the 15.38% of a total of 50 design interfaces, that is, 7.692. The rest of the expected values are determined in similar way.
High-Pressure Compressor 40 S 30 A 20 C, 10 0 FAN LPC HPC B/D HPT LPT Systems
Table 2-3. Chi-square test results. Comparing externals and controls system with
mechanical components system
System Expected fraction of Expected number of Actual number of X2 design Interfaces design interfaces of design Interfaces
based on Ext/Controls Mech. Comps.t of Mech. Comps.
FAN
13.24%
6.088
9
1.393
LPC
23.53%
10.824
7
1.351
HPC
13.97%
6.426
8
0.385
B/D
25.00%
11.500
13
0.196
HPT
12.50%
5.750
2
2.446
LPT
11.76%
5.412
7
0.466
Total 100.00% 46.000 466.237
t IThe fraction of design interfaces between the external and controls system and the fan system is
18
out of a total of 136 design interfaces, that is, 13.24%. Hence, the expected number of design interfaces between the mechanical components system and the fan system, under the null hypothesis, is the 13.24% of a total of 46 design interfaces, that is, 6.088. The rest of the expected values are determined in similar way.2.5.
Capturing the Development Organization
The organization responsible for the development of the aircraft engine was divided into
sixty design teams. Fifty-four of these teams were grouped into eight system-design groups
mirroring the architecture of the engine described above. Each of those teams was responsible
for developing one of the 54 components of the engine. The remaining six design teams were
system integration teams, which had no specific hardware associated with them and whose
responsibility was to assure that the engine worked as a whole. Examples of the system
integration teams are the rotordynamics team and the secondary flow team.
We capture the system-level integration efforts (both within groups and across groups) of
the organization by measuring the intensity of the technical interaction between the design teams
involved in the development process. This method is similar to the approach used by McCord
and Eppinger (1993). We focused our efforts on capturing coordination-type interactions
between design teams. Additionally, the development organization was co-located in a
single-floor building, and every team member had access to each other via face-to-face, telephone, and
email. Also, the use of a centralized database to save and/or retrieve information was very
limited. We explicitly asked respondents not to report knowledge-type or inspiration-type
communications.
2.5.1. Team Interaction Intensity
To measure the intensity of each team interaction, we asked at least two key members from each design team to rate the criticality and frequency of their interactions with each of the other teams during the detailed design phase of the engine development project. We used a five-point scale that combines the frequency and criticality of each interaction into a single metric, as shown in Table 2.4. The criticality metric allows asymmetry in the interaction intensity of each pair of design teams. That is, interaction intensity is reported from the respondent's point of
view, and we surveyed both parties of each pair to obtain a bilateral view of each interaction. Table 2-4. Team Interaction Intensity
Criticality\Frequency Very Frequently Frequently Infrequently Never
(perhaps daily) (weekly or biweekly) (monthly or less)
Critical: Information cannot be generated by team alone, and its delay
or absence causes rework or increases 5 4 3 0
iterations.
Important: Information might be generated by team alone with some
risk and effort. Its delay or absence 3.5 2 1 0
negatively affects team performance. Routine: Information is important but can be generated by team alone with
minimal risk. Its delay or absence has 2 0.5 0 0
not significant impact in team performance.
2.5.2. Team Interaction Matrix
We organize the team-interaction data in a square (60x60) team interaction matrix. The identically ordered labels of the rows and columns of this matrix contain the names of each of the design teams. Each cell in the matrix contains the interaction intensity reported by each team. Hence,
T,0= Team Interaction Matrix
ti i= team interaction intensity [0,51 reported by team" i" about its interaction with team j
t,is undefined for i =
j
(2.2) T b6. 6= Team Interaction Matrix (binary)
t5=I if t, > 0 t.=o if t.=0
Figure 2.6 shows a binary team interaction matrix with off-diagonal cells marked "0"
to
indicate each non-zero team interaction revealed. Reading across a particular row indicates with
which other teams the surveyed team interacted.
The 60 design teams are organized into groups that mirror the product architecture
structure. As shown in Figure 2.6, associated with the six modular systems are corresponding
groups of design teams. Similarly, the two integrative systems have their two corresponding
groups of design teams. Finally, there are six system integration teams that are not responsible
for designing any specific engine's component but they are in charge of integrating all the
components into a whole. The boxes around the diagonal indicate the organizational boundaries
between the eight design groups. Marks inside the boxes indicate within-boundaries team
interactions, which we associate to within-group system-level integration effort. On the other
hand, marks outside the boxes indicate cross-boundaries team interactions, which we associate to
across-group system-level integration effort.
Modular Design Teams FAN Group (7 teams) _____________________ 3 0 LPC Group * *
1
(7teams) *00* * *0I'
0 0 0 00 -HPC Group 0*~
(7 teams) 00 0 00 0 0 0 00 00 B/ Gru 0 0 0 0 0 0 00 00 00 00 0 0 ______ ____ HPT GroupI
0O
(S teams) _ _* * *o* (6 teams) 00:0* . o 0 o 0 o OOOO OO oO B/DTGroup *0 , " .0 ,, 0 1 (56teams) 0* * " *0 *10 0 0 0~
0 0 0 0 0Mech.components Meh pnnso o 0.000 0 00 000 001 0 0 000 0000000 0 00
0 .0 0 0 0 a 0 : 0 0 a0 a0
Group 0 **'. 0 0
(7 teams) 0 * 00 0 0
Integrative Design External/Controls . 0 * *0
Teams Groups 0 0 O 0 , (10teams) * * * * 0* * -~ 0 OOO OeOo 00 0 0 0 0
0
01
0000 * * * * System Integrators (6 teams) 0 0 0 * 0 0 0 0 0 0 0Figure 2-6. Team Interaction Matrix (binary)
2.6.
Comparing Product Architecture and Development Organization
The one-to-one assignment of the
54
components to the
54
design teams allows the direct
comparison of the design interface matrix with the team interaction matrix. In Appendix C, we
present an algebraic model that allows us to perform this comparison for the general case when
the assignment is not one-to-one. Figure 2.7 shows how, by overlapping the design interface
matrix over the team interaction matrix, we obtain the resultant matrix. The resultant matrix is
exhibited in Figure 2.8.
NO 0 . 0 0 0 O 0 0 0.
* 0 0 0 0 0 ** 0 * 0 S0 0 0 * *0 0 0 0 0 0 0 0,,0 0 0 0 0 0 0 0 0 8 1 . 00 0 0 0 0 o ; o -D S0 0 0 0 0 0 0 0 0 0 0 0 0 0 0 0 0Figure 2-7. Comparing Product Architecture and Development Organization Interactions Modular FAN LPC X : Ii 0 IN X X x x x1 X_ 'X HPC XX- -X X X ... XOX _
*
xx___x HPj
XX XXX x_ xxx 0I0 0
L0
Xko
*s* O 0
x 0 0 00 _T X B/D 0 -o - --- -0 00 0 - 0 . -- -... x x0
#
: , X :1X
X.
j t-j LPT Mech. a 0 - - X Components , __ I - 0 x jX X X X X x X XX X x xxj
xxXx
X X X
" . : .X
X
Externals and x x- -- 1. Xx-- - - --XXI.':X
Integrative Controls x * x , . . - . . 0 x X xx0 *Figure 2-8. Resultant Matrix
Legend for Figure 2.8:
X: Design interface with no team interaction
0: Team interaction with no design interface
#: Both design interface and team interaction
(Blanks): No design interface and no team interaction
*:
Diagonal elements (meaningless)
(54x54)
Design Inter ace Matrix (54x54) Resultantc Matrix (54x54) Team Interaction Matrix