O
pen
A
rchive
T
OULOUSE
A
rchive
O
uverte (
OATAO
)
OATAO is an open access repository that collects the work of Toulouse researchers and
makes it freely available over the web where possible.
This is an author-deposited version published in :
http://oatao.univ-toulouse.fr/
Eprints ID : 14045
To link to this article :
DOI: 10.1021/jp4077504
URL :
http://dx.doi.org/10.1021/jp4077504
To cite this version :
Sarou-Kanian, Vincent and Gleizes, Alain and Florian, Pierre and
Diane, Samélor and Dominique, Massiot and Constantin, Vahlas
Temperature-Dependent 4-, 5- and 6-Fold Coordination of
Aluminum in MOCVD-Grown Amorphous Alumina Films: A Very
High Field 27Al-NMR study. (2013) Journal of Physical Chemistry
C, vol. 117 (n° 42). pp. 21965-21971. ISSN 1932-7447
Any correspondence concerning this service should be sent to the repository
administrator:
[email protected]
Temperature-Dependent 4
‑, 5- and 6‑Fold Coordination of
Aluminum in MOCVD-Grown Amorphous Alumina Films: A Very High
Field
27
Al-NMR study
Vincent Sarou-Kanian,
†,‡Alain N. Gleizes,*
,§Pierre Florian,
†,‡Diane Samélor,
§Dominique Massiot,
†,‡and Constantin Vahlas
§†CNRS, UPR3079 CEMHTI, 1D avenue de la Recherche Scientifique, 45071 Orléans Cedex 2, France ‡Faculté des Sciences, Université d’Orléans, avenue du Parc Floral, BP-6749, 45067 Orléans Cedex 2, France §CIRIMAT, Université de Toulouse, 4 allée Emile Monso, BP-44362, 31030 Toulouse Cedex 4, France
ABSTRACT: The only easy way to prepare amorphous alumina is via thin film deposition. For this reason, the disorder in amorphous alumina has not yet been fully investigated. We have used very high-field (20 T) solid state27Al NMR spectroscopy
to analyze the structural modifications of amorphous alumina thin films with deposition temperature (Td). The films were deposited by metalorganic chemical vapor deposition in the Tdrange of 360−720 °C. Depending on Td,film composition
is either AlO1+x(OH)1−2x(0≤ x ≤ 0.5) or Al2O3. From27Al 1D magic angle spinning
(MAS) and 2D multiple-quantum magic angle spinning (MQMAS) NMR analyses, thefilms grown between 360 and 600 °C contain between 38 and 43 atom % of 5-fold coordinated aluminum sites ([5]Al). The percentages of [6]Al and [4]Al sites vary spectacularly, reaching their respective minimum (5 atom %) and maximum (54 atom %) around 515 °C. The analysis of a very thin film (85 nm) of Al2O3reveals the
presence of metallic aluminum at the interface with the substrate and suggests that the respective percentages of [n]Al sites slightly differ from those in thicker films. The
observed Tddependence of amorphous alumina structure can be correlated with that of film properties previously reported, namely, Young’s modulus, hardness, and corrosion protection.
INTRODUCTION
Because of the well-known technological interest of alumina thin films in various domains, including catalysis, corrosion protection, and electrical insulation, insight into the influence of a given process on the atomic structure of the ceramic is a valuable key to process and properties optimization. This study was undertaken after observing that physical properties of amorphous aluminum oxide films grown by metalorganic chemical vapor deposition (MOCVD) depend on the deposition temperature (Td). The films were prepared from
aluminum tri-isopropoxide (ATI) at 0.67 kPa (5 Torr) over the temperature range 350−750 °C. Previous studies1 had shown that films grown in the temperature range 350−415 °C are partially hydroxylated amorphous alumina, a-AlO1+x(OH)1−2x with x varying from 0 (AlOOH) at 350°C to 0.5 (Al2O3) for a
deposition temperature above ca. 415 °C. Those grown between 480 and 650 °C are amorphous alumina (a-Al2O3),
while around 700°C, a-Al2O3is embedded with nanocrystals of
γ−Al2O3. Table 1 displays hardness and Young’s modulus for
threefilms grown on Ti6Al4V titanium alloy at 350, 480, and 700°C and for two films grown on silicon at 415 and 600 °C.2 Although referring tofilms grown on two different substrates, these values suggest that the intrinsic mechanical properties of thefilms reach a maximum for a deposition temperature in the
range 480−600 °C. The resistance to salt environment corrosion was comparatively studied for the three coated Ti6Al4V samples.3 From polarization curves in a 0.1 M NaCl solution and electrical impedance measurements after 1 h in the NaCl solution, the film deposited at 480 °C improved Table 1. Composition, Hardness (H), and Young’s Modulus (E) of Alumina Films Deposited at Different Temperatures (Td) on Metallic Substratesa
Td(°C) 350 415 480 600 700
substrate Ti6Al4V silicon Ti6Al4V silicon Ti6Al4V
composition a-AlOOH a-Al2O3 a-Al2O3 a-Al2O3 a-Al2O3+
nano γ-Al2O3
H (GPa) 5.8 7.8 10.8 11.2 ∼ 1
E (GPa) 92 133 155 175 ∼ 10
aThe values for T
d= 700°C were low but not quantifiable because
loading and unloading curves from the nano indentation tests proved to be not reproducible.
corrosion resistance by 2 orders of magnitude with respect to the bare alloy. The other twofilms were by far less efficient.3
Such property variations are indicative of modifications of the amorphous structure upon changing Td. For thefilms of general formula a-AlO1+x(OH)1−2x, structural modifications are
ex-pected to accompany dehydroxylation from AlOOH to a-Al2O3. The question arises as to possible further structural modifications in a-Al2O3 for the films grown above 415 °C.
Using 27Al magic angle spinning nuclear magnetic resonance (MAS NMR) experiments, Lee et al. recently showed that two a-Al2O3films grown by physical vapor deposition (PVD) and
atomic layer deposition (ALD) mainly consist of tetra-coordinated and penta-tetra-coordinated aluminum sites with a low content of hexa-coordinated aluminum sites ([4]Al, 56 for PVD,
54 for ALD;[5]Al, 36 for PVD, 41 for ALD;[6]Al, 7 for PVD, 5 for ALD; all in atom %).4,5 It is well-known that crystalline transition aluminas consist of[4]Al and[6]Al. However, a small
amount (ca. 5%) of[5]Al was reported as surface species in γ-Al2O3 formed upon thermal decomposition of boehmite ( γ-AlOOH).6−8
To our knowledge no study has so far addressed the influence of deposition temperature on the structure of amorphous aluminafilms grown from the vapor phase. Besides the interest in gaining information about process−structure relationship, the structure of an amorphous material is itself worth studying.
We present the results of very high-field (20 T) 27Al NMR
structural investigations of MOCVD-processed alumina films between 350 °C (amorphous AlOOH) and 720 °C (a-Al2O3
with embedded nanocrystals ofγ-Al2O3).
■
EXPERIMENTAL SECTIONSample Preparation. Deposition experiments were performed in a custom-made, horizontal, hot-wall reactor described in a previous paper.9 Thefilms were grown on 100 μm thick, (100) oriented silicon wafers. Six samples with targeted thickness of 0.5± 0.1 μm were prepared at 360, 420, 480, 550, 600, and 720°C. Supercooled ATI (Acros Organics) was heated at 90 °C and carried to the deposition zone by bubbling with 99.9992% pure N2as a carrier gas (Air Products). Fixed experimental parameters were as follows: total pressure, 0.67 kPa; N2flow rate over ATI, 20 standard cubic centimeters per minute (sccm); and dilution N2flow rate, 631 sccm. Three more samples with targeted thickness 0.1, 0.2, and 1μm were also prepared at 480°C in order to gain insight into possible structural evolution along the thickness of the alumina film. Film thickness, reported in Table 2, was determined from weight gain of the samples and by reflectometry using a UV− VIS reflectometer (Ocean Optics) and NanoCalc software. The samples, comprising the oxide film and the wafer, were then ground into a coarse powder for packing in the NMR sample container.
Solid-State NMR. All solid-state NMR experiments were carried out on a Bruker AVANCE III spectrometer operating at a magnetic field of 20.0 T (corresponding to 27Al and 1H
Larmor frequencies of 221.5 and 850.1 MHz, respectively). Single resonance27Al experiments were performed with a 2.5
mm MAS probe head. Double-resonance1H−27Al experiments
were performed with a 3.2 mm MAS probe head which increases the available volume of the powdered samples (42μL for 3.2 mm versus 14μL for 2.5 mm) at the cost of a lower spinning frequency.
The27Al one-dimensional (1D) MAS spectra were recorded
with a spinning frequency of 35 kHz. The excitation pulse length was 0.4μs, i.e., a flip angle less than π/18 to ensure a quantitative 1D spectrum10 (radio-frequency field νRF = 35
kHz). The recycle delay was 20 ms (spin−lattice relaxation time T1 of ∼200 ms, estimated with a saturation−recovery
experiment on the most sensitive sample) and the number of transients was between 260K and 3 000K depending on the film thickness. The27Al signal from the probe background was
acquired using the same experimental conditions with the empty rotor (800K transients). After normalization according to the number of transients, it was subtracted from the baseline-corrected spectra.
The two-dimensional (2D) z-filtered27Al multiple-quantum magic angle spinning (MQMAS) experiments11,12 were performed with a spinning frequency of 30 kHz, with triple-quantum (3Q) excitation and reconversion pulse lengths of 2.0 and 0.9μs, respectively (νRF= 128 kHz). The z-filter duration
was 3.3 ms, and the selective pulse length of the central transition was 7.5μs (νRF= 10 kHz). Acquisition in the indirect
dimension was synchronized with the spinning frequency13and 12−14 t1increments of 33.3μs were collected with a recycle
delay of 200 ms. The 3QMAS experiments lasted for about 3−4 days per sample. Among the four samples prepared at 480°C, only the thickest one was submitted to 3QMAS NMR because the amount of aluminum for the thinnestfilms (i.e., the smallest ratio alumina/wafer) would necessitate unpractical experimen-tal times.
The {1H}2 7Al rotational echo double resonance
(REDOR14,15) experiments were performed for the films grown at 360, 420, and 480 °C with a spinning frequency of 24 kHz. The27Al and 1H radio-frequencyfield strengths were νRF= 13 kHz (selective excitation of the central transition) and
νRF = 52 kHz, respectively. The normalized difference signal
due to dipolar dephasing (ΔS/S0) was obtained by acquiring separately reference (S0) and dipolar dephased (S) signals. The
recycle delay was set to 0.5 s, and between 8K and 32K transients were collected for each dipolar dephasing and Table 2. Thickness,[n]Al Percentages (atom %), and Averaged Aluminum Coordination Number (CN) for Films Obtained at Different Deposition Temperatures (Td)a
%[n]Al (atom %) Td (°C) thickness (nm) [4]Al [5]Al [6]Al CN 360 563± 73 32.9± 0.8 40.9± 0.7 26.2± 0.7 4.93 420 399± 78 45.6± 0.7 42.9± 0.5 11.5± 0.6 4.66 480 936± 84 53.6± 0.6 41.8± 0.4 4.6± 0.4 4.51 480* 600± 200 53.0± 0.6 41.6± 0.4 5.4± 0.4 4.52 480* 180± 10 53.7± 0.8 41.0± 0.6 5.3± 0.7 4.52 480* 85± 7 50.7± 1.0 43.7± 0.7 5.6± 0.9 4.55 550 582± 78 53.3± 0.6 39.2± 0.5 7.5± 0.3 4.54 600 420± 81 46.5± 0.3 37.6± 0.3 15.9± 0.2 4.69 720 578± 67 28.6± 0.6 12.2± 0.6 59.2± 0.5 5.31
aAsterisks (*) refer to the three extra samples prepared at 480 °C to
study thickness structural effect. The errors in the simulations were determined using a Monte Carlo approach where for each spectrum 1000 data sets were generated from the model with added experimental noise andfitted using the same procedure. The standard deviations, σ, or the full width at half maximum, Δ, of the related Gaussian distribution (Δ = 2(2 ln(2))1/2σ), were used to estimate the
reference experiment to ensure a good signal-to-noise ratio. Each REDOR experiment lasted between 2.5 and 4.5 days.
All spectra were referenced with respect to a 1 M solution of Al(NO3)3. 1D and 2D spectra were simulated using the Dmfit
software.16
■
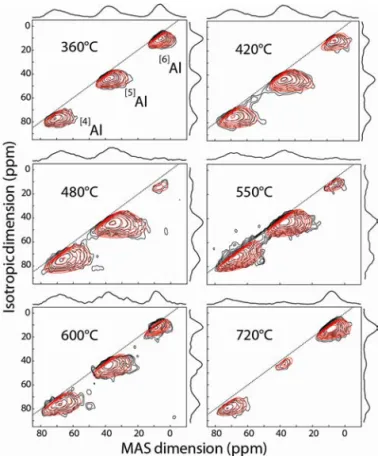
RESULTS AND DISCUSSIONInfluence of Deposition Temperature. Figure 1 and Figure 2 illustrate the 1D quantitative 27Al spectra and their
respective 2D 3QMAS27Al spectra for the six investigated T d
values, respectively. Using the very high magneticfield (20.0 T) allows the improvement of the spectral resolution and a clear identification of the tetra-, penta-, and hexa-coordinated aluminum sites ([n]Al with n = 4, 5, or 6). Their line shapes
are characteristic of a typical amorphous structure as seen in alumina-containing glasses.16 The simulation of such NMR spectra is based on the“Czjzek” model (or Gaussian isotropic model) which considers that the local structure of the[n]Al sites
may be described as a purely statistical disorder of environ-ments, with a joint probability distribution of the principal value Vzz of the EFG tensor and of the quadrupolar asymmetry
parameter ηQ.17−19 The NMR parameters deduced from this model are the averaged isotropic chemical shift (δiso), the
chemical shift distribution (ΔCS), and the averaged quad-rupolar constant (CQ). As shown recently20 for 27Al, δiso is
mainly governed by chemical modifications of the second coordination sphere, whileΔCS and CQmeasure the distortion (bond lengths and/or angles) of the AlO4tetrahedra; CQis, for
example, correlated with the mean tangent of the absolute deviation of the tetrahedral∠O−Al−O bond angles from the ideal value of 109.47°.
As the 3QMAS spectra have fully separated the three [n]Al sites (Figure 2), they were first simulated in order to obtain primary sets of optimized values ofδiso,ΔCS and CQ(Tables
S1 and S2 in the Supporting Information). Nevertheless, the 3QMAS experiment efficiency is known to strongly depend on the strength of the quadruplolar couplings and particularlyfilter out the strongest ones. The optimized CQ values are usually
underestimated, even at high magnetic fields. Hence, the 1D
27Al MAS spectra were reconstructed by optimizing nine
parameters (δiso, CQ, amplitude) while keeping theΔCS values
as issued from the 3QMAS experiment. The percentage of each
[n]Al site was calculated from line shape integration of the
central transition. All the optimized values are summarized in Table 2.
Figure 3 shows the evolution with Tdof the percentages of [n]Al sites (Figure 3a) and ofΔCS (Figure 3b). The respective
percentages of tetra- and hexa-coordinated sites vary with opposite trends. The[4]Al content increases from 33% for Td=
360°C up to 53% for Td= 480°C; at the same time, the[6]Al
content decreases from 26% to 5%. For Td = 550 °C, the
respective percentages have values that are nearly the same as those for 480 °C, suggesting that the maximum of [4]Al sites and the minimum of[6]Al sites occur at∼515 °C. From 360 to
515°C, the[5]Al content is at its highest with values between 40% and 43%. It can be noticed that the [n]Al percentages
measured for Td = 480 °C (and 550 °C) compare well with
Figure 1.One-dimensional27Al MAS spectra of the central transitions
of the three[n]Al sites for films deposited at different temperatures.
Black circles and red lines represent the experimental and reconstructed spectra, respectively. The gray lines refer to the different contributions of the reconstructed spectrum; asterisks (*) show the spinning sidebands of the external transitions. The center bands were simulated with Gaussian line shapes accounting for the line widths and intensities of their neighboring spinning sidebands.
Figure 2.Two-dimensional27Al 3QMAS spectra of thefilms deposited
at different temperatures. Black and red lines refer to experimental and simulated spectra, respectively.
those measured by Lee et al. for two aluminum oxide films prepared by PVD and ALD.4,5In the 550−720 °C range, the
[6]Al content increases to 59% and the[4]Al and[5]Al contents
decrease to 29% and 12%, respectively.
The average isotropic chemical shiftδisodoes not present any
significant evolution with Td, consistent with the fact that there are no chemical variations in the aluminum second coordination sphere (i.e., only Al atoms). The average values of CQ and ΔCS between the three[n]Al sites show the same
hierarchy whatever the temperature of deposition: CQ([4]Al) >
CQ([5]Al) > CQ([6]Al);ΔCS([4]Al) >ΔCS([5]Al) >ΔCS([6]Al).
The same trend was observed for rare-earth aluminosili-cates22,23 and may therefore be related to polyhedra-specific distortions. Figure 3b shows thatΔCS is maximal for a Tdmore or less half-way between 480 and 550°C for each coordination number. This suggests that the utmost structural disorder corresponds to the highest rates of[4]Al and[5]Al sites.
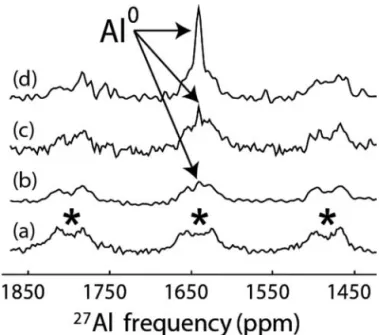
Influence of Film Thickness. Figure 4 presents the 1D quantitative27Al spectrum in the frequency range 1450−1850 ppm for fourfilms of different thickness processed at Td= 480 °C. The spectrum of the thinnest (∼85 nm) film clearly reveals a peak corresponding to metallic aluminum Al0at 1650 ppm.24
Increasingfilm thickness results in the decrease of the relative
intensity of this peak. It was verified that this peak does not show up on a 1D27Al spectrum recorded with the bare silicon
substrate as a reference, thus confirming that metallic aluminum formed during alumina growth.
The NMR parameters (δisoand CQ) do not vary significantly
withfilm thickness. The respective[n]Al contents do not vary
either for the three thickerfilms (180, 600, and 984 nm). The
[4]Al and[5]Al contents in the thinnestfilm (85 nm), are slightly
but significantly different from those in the thicker films. This film is probably not thin enough to discriminate between surface and bulk[n]Al environments. Consequently one cannot
exclude that the distribution of [n]Al sites does slightly differ from that in the thickerfilms prepared at the same temperature. The intensity of the line corresponding to metallic aluminum increases in proportion as thickness decreases, suggesting that Al0forms at the silicon/alumina interface; calculated Al0relative populations Al0/(Al0+∑
nnAl) (CT for central transition only;
Al0lines reconstructed with a Gaussian shape) are 1.8%, 1.0%, and 0.3% for oxide thicknesses of 85, 180, and 600 nm, respectively. If metallic aluminum were dispersed in the bulk, this ratio should be constant.
Interpreting Coordination Variation. As was mentioned in the Introduction, previous studies concluded that films grown between 350 and 415°C are amorphous hydroxylated alumina a-AlO1+x(OH)1−2x, with x varying from 0 (a-AlOOH) for Td= 350°C to 0.5 (a-Al2O3) for Tdabove ca. 415°C. This
result was obtained from a series of different films by (i) measuring the O/Al ratio comparatively to a standard sample of α-Al2O3 through three different techniques, namely, energy
dispersion and Rutherford backscattering spectroscopies and electron probe microanalysis (EDS, RBS, and EPMA, respectively) and (ii) measuring surface and volume hydrogen contents through elastic recoil detection analysis (ERDA). Moreover, Fourier transform infrared transmission spectrosco-py showed a wide OH absorption band in the 3500 cm−1 region forfilms deposited at 350, 380, and 415 °C; this band did not show up for a film prepared at 480 °C.1 In the same way, thermogravimetric analyses (TGA, DTG) showed mass
Figure 3. Percentages of the [n]Al environments (a) and their
corresponding chemical shift distributions (b) as a function of the temperature of deposition. Black squares, red circles, and green triangles refer to [4]Al, [5]Al, and [6]Al sites, respectively. Open
diamonds in (a) correspond to the averaged coordination number calculated from the formula CN = [4 ([4]Al atom %) + 5 ([5]Al atom
%) + 6 ([6]Al atom %)]/100. All lines are a guide to the eye.
Figure 4. Detailed region of the 1D quantitative spectra for the coatings grown at 480 °C. (a), (b), (c), and (d) refer to the film thicknesses 936, 600, 180, and 85 nm, respectively (Table 2). Asterisks show spinning sidebands of the[n]Al sites.
loss attributable to dehydroxylation forfilms deposited at 350 and 380°C and no significant mass loss for Td= 480°C.1
The {1H}27Al REDOR experiment enables the probing of the
spatial proximities (not specifically chemical bonds) between aluminum and hydrogen in the sample. The REDOR curves, i.e.,ΔS/S0as a function of the dephasing time, can be separated
into two main domains:ΔS/S0first increases and then reaches
a plateau which, assuming that the experiment is perfect, corresponds to the amount of [n]Al sites having protons nearby.25 Early dephasing times notably exhibit the nearest hydrogen neighbors for aluminum. The REDOR curves (Figure
5) confirm the presence of hydrogen in the proximity of the
[n]Al sites for the films deposited at 360 and 420 °C.
Considering first the effect of Td, ΔS/S0 is always higher for
360°C than for 420 and 480 °C, regardless of the[n]Al site and
the dephasing time. This is consistent with the formation of fewer OH groups per [n]Al site as T
dincreases. Then the
variation ofΔS/S0as a function of the aluminum coordination
shows the hierarchy ΔS/S0([6]Al) > ΔS/S
0([5]Al) > ΔS/
S0([4]Al) for eachfilm. This suggests that the H atoms are more
numerous and/or closer to hexa-coordinated aluminum ions than to any other. This is illustrated with bayerite Al(OH)3for
which the REDOR curve grows faster than any of the amorphous aluminas (Figure 5) because of the presence of six [6]Al−(OH)−[6]Al linkages on all aluminum atoms.
Therefore the majority, if not all, of the OH groups are bonded to [6]Al ions. These OH groups can possibly create
hydrogen bonds [6]Al−OH...O-[n]Al (n = 4, 5, or 6) with neighboring polyhedra; but the resulting H-to-[n]Al distances
are larger than the intraoctahedron H-to-[6]Al distances. The presence of hydrogen in thefilms prepared at 480 °C is questionable because ΔS/S0 becomes significant after a long
dephasing time (1.5 ms). This suggests that hydrogen is either present in a small amount in the bulk or may come from surface-adsorbed water. In the sample submitted to ERDA analysis,1the hydrogen content was 0.9 atom % in the bulk and 5.1 atom % on the surface. The drop in octahedral sites from ∼27% for Td= 360°C to ∼5% for Td = 480°C most likely
ensues from dehydroxylation. From Figure 3a, it is difficult to decide whether the percentage of [6]Al sites presents a true minimum at about 510°C or reaches a plateau at 480 °C (same comment for the maximum of the percentage of[4]Al sites). In any case, one can consider that there are virtually no OH groups in the structure for Td= 480 °C.
For Td in the range of 500−550 °C, the populations of coordination numbers do not vary much. The concentration of
[4]Al sites is nearly constant, while that of [6]Al sites starts to
increase slightly at the expense of[5]Al sites: 1[5]Al→ 1[6]Al. In
the 550−600 °C range, the rate of[6]Al sites increases, mainly at the expense of[4]Al, approximately according to the scheme
3[4]Al + 1[5]Al→ 4[6]Al. In the 600−720 °C range,[5]Al sites disappear faster than[4]Al sites approximately according to the
scheme 2[4]Al + 3[5]Al → 5[6]Al. The decrease in 4- and 5-coordinated sites parallel to increasing 6-5-coordinated sites might be at least partly due to the nano crystallization of alumina. In our previous work, transmission electron microscopy evidenced the presence of nanocrystals ofγ-Al2O3
embedded in an amorphous alumina matrix in a sample prepared at 700°C.1
Coordination and Physical Properties. Hardness and Young’s modulus for films prepared at 350, 420, and 480 °C (Table 1) increase with Tdand therefore with the decreasing content in hydroxyl groups. The averaged Al coordination number CN decreases from 4.93 for Td= 360°C to 4.52 for Td = 480 °C (Figure 3a). The ensuing increasing covalent character may account for the observed increase in film hardness and Young’s modulus (Table 1). The collapse of these two properties for Tdbetween 600 and 700°C (Table 1) might well indicate the progressive formation of crystals, thus leading to a bi-phasic amorphous/crystalline structure. It is recalled that embedded nanocrystals ofγ-alumina were observed in the TEM for Td = 700°C while no such crystals formed for Td = 550 °C.1
The structure ofγ-alumina is made of tetrahedral (T) and octahedral (O) Al ions, with the ratio O/T ≥ 2. Therefore crystals can form only in zones where (i) tetrahedral and octahedral ions are segregated from penta-coordinated ions and (ii) there are enough octahedral ions with respect to tetrahedral ions: from the data in Table 2, for Td= 550, 600, and 720°C, O/T = 0.14, 0.36, and 2.20, respectively. Formation of such segregated zones as a prelude to nanocrystals may account for hardness and Young’s modulus starting to decrease for Td as
low as 600°C. Further experiments are needed to specify the onset.
As reported in the Introduction,films deposited at 480 °C on Ti6Al4V proved to be 2 orders of magnitude more protective against salt corrosion than those deposited at 350 and 700°C. This observation is consistent with the fact that the most disordered structure occurs for Tdaround 500 °C. The most disordered structure, hence the most amorphous one, is less propitious to grain boundary formation; hence, it is the most efficient as a diffusion barrier.
■
CONCLUSIONThis very high-field (20 T) NMR study was conducted on thin films that were no more than a few hundred nanometers thick.
Figure 5. REDOR curves for thefilms at three different deposition temperatures, 360°C (filled symbols), 420 °C (open symbols), and 480°C (black down triangles). Black squares, red circles, and green up triangles refer to[4]Al,[5]Al, and[6]Al sites, respectively. Black down triangles refer to the[n]Al site;ΔS/S0was also calculated for each of
them, but this is not displayed for clarity because of the overlap). A REDOR curve is also shown for Bayerite (Al(OH)3, green asterisks),
the structure of which is composed only of[6]Al sites. All lines are a guide to the eye.
It provides new insights into the structural variation with deposition temperature of MOCVD amorphous aluminafilms. The presence of as much as 40% of penta-coordinated aluminum in amorphous aluminum oxide thin films was first established by Lee et al. for two films prepared by PVD and ALD.4,5With the experimental conditions used in the present study, such a high[5]Al content has proven to be sustainable
over 350−600 °C; i.e, a wide range of Td. It concerns not only
the Al2O3oxide deposited between 480°C (42%) and 600 °C (38%) but also diversely hydroxylated aluminum oxyhydroxides AlO1+x(OH)1−2xfrom x = 0 (AlOOH for Td= 350°C) to x = 0.5 (Al2O3 for Td ∼ 480 °C). [4]Al and [6]Al contents vary
spectacularly with Td. For 350 < Td< 480°C, the[4]Al content
increases from 30% up to 53% and the[6]Al content decreases from 30% down to 5%. Between 480 and 550 °C, they are almost constant. Then, for 550 < Td < 720 °C, they vary
reversely up to 59% for[6]Al and down to 29% for[4]Al. The [5]Al content is 38% for T
d= 600°C and 11% for Td= 720°C.
The “most amorphous” structure is that of Al2O3 grown
between 480 and 550°C and corresponds to the maximum of
[4]Al and[5]Al and the minimum of[6]Al contents. This is an
important structural feature for the properties of alumina as a diffusion barrier and is confirmed by preliminary results concerning the high corrosion protection potential of a film grown at 480°C in comparison with that of two films grown at 350 and 700°C.
Several other issues remain to be explored. In particular, the preparation of films with different thicknesses at 480 °C revealed the formation of metallic aluminum at the interface between the silicon substrate and the deposit. Correlatively, the thinnestfilm had a distribution of [n]Al sites slightly different
from that of thickerfilms.
Variations of Young’s modulus and hardness of a few films prepared at different temperatures between 350 and 700 °C seem tofit with the distribution of[n]Al sites. This encouraging
observation needs to be reinforced by further mechanical studies of a greater number of various samples. Detailed investigation is in progress to better specify these structure− property correlations.
Regarding applications in catalysis, MOCVD-deposited amorphous alumina appears a promising material because the temperature of deposition allows tuning of the content both in OH groups and in 4-, 5, and 6-coordinate aluminum, i.e., in Brønsted and Lewis sites. Particularly, the role of 5-coordinate Al3+as binding sites for preparing active metal catalytist phases
on alumina has been recently proposed.26
■
ASSOCIATED CONTENT*
S Supporting InformationTable 1S: deposition temperatures (Td), thickness, optimized values of isotropic chemical shifts (δiso), chemical shift
distributions (ΔCS), and quadrupolar constants (CQobtained from the simulations of the 1D27Al NMR spectra) . Table 2S: the same parameters extracted from the 2D27Al 3QMAS NMR
experiments. This material is available free of charge via the Internet at http://pubs.acs.org.
■
AUTHOR INFORMATIONCorresponding Author
* E-mail: [email protected].
Notes
The authors declare no competingfinancial interest.
■
ACKNOWLEDGMENTSFinancial support from the TGIR-RMN-THC Fr3050 CNRS for conducting the research is gratefully acknowledged.
■
REFERENCES(1) Gleizes, A. N.; Vahlas, C.; Sovar, M.; Samélor, D.; Lafont, M.-C. CVD-Fabricated Aluminum Oxide Coatings from Aluminum Tri-iso-propoxide: Correlation Between Processing Conditions and Composition. Chem. Vap. Deposition 2007, 13, 23−29.
(2) Balcaen, Y.; Radutoiu, N.; Alexis, J.; Beguin, J. D.; Lacroix, L.; Samélor, D.; Vahlas, C. Mechanical and Barrier Properties of MOCVD Processed Alumina Coatings on Ti6Al4V Titanium Alloy. Surf. Coat. Technol. 2011, 206, 1684−1690.
(3) Boisier, G.; Raciulete, M.; Pébère, D.; Gleizes, A. N.; Vahlas, C. Electrochemical Behavior of Chemical Vapor Deposited Protective Aluminum Oxide Coatings on Ti6242 Titanium Alloy. Electrochem. Solid-St. Lett. 2008, 11 (10), C55−C57.
(4) Lee, S. K.; Lee, S. B.; Park, S. Y.; Yi, Y. S.; Ahn, C. W. Structure of Amorphous Aluminum Oxide. Phys. Rev. Lett. 2009, 103, 095501.
(5) Lee, S. K.; Park, S. Y.; Yi, Y. S.; Moon, J. Structure and Disorder in Amorphous Alumina Thin Films: Insights from High-Resolution Solid-State NMR. J. Phys. Chem. C 2010, 114 (32), 13890−13894.
(6) Kwak, J. H.; Hu, J.; Lukaski, A.; Kim, D. H.; Szanyi, J.; Peden, C. H. F. Role of Pentacoordinated Al3+Ions in the High Temperature
Phase Transformation ofγ-Al2O3. J. Phys. Chem. C 2008, 112, 9486−
9492.
(7) Kwak, J. H.; Hu, J. Z.; Kim, D. H.; Szanyi, J.; Peden, C. H. F. Penta-Coordinated Al3+Ions as Preferential Nucleation Sites for BaO
onγ-Al2O3: An Ultra-High-Magnetic Field27Al MAS NMR Study. J.
Catal. 2007, 251, 189−194.
(8) Pecharroman, C.; Sobrados, I.; Iglesias, J. E.; Gonzalez-Carreno, T.; Sanz, J. Thermal Evolution of Transitional Aluminas by NMR and IR Spectroscopies. J. Phys. Chem. B 1999, 103, 6160−6170.
(9) Samélor, D.; Sovar, M. M.; Stefanescu, A.; Gleizes, A. N.; Alphonse, P.; Vahlas, C. Low Temperature CVD Route for the Preparation of Alumina Coatings with a High Specific Surface AreaIn EUROCVD-15: Fifteenth European Conference on Chemical Vapor Deposition; Proceedings of the International Symposium; Bochum, Germany Devi, A., Fischer, R. A., Parala, H., Allendorf, M. D., Hitchman, M. L., Eds.; Electrochemical Society: Pennington, NJ, 2005; pp 1051−1058.
(10) Lippmaa, E.; Samosen, A.; Magi, M. High Resolution27Al NMR
of Aluminosilicates. J. Am. Chem. Soc. 1986, 108, 1730−1735. (11) Medek, A.; Harwood, J. S.; Frydman, L. Multiple-Quantum Magic-Angle Spinning NMR: A New Method for the Study of Quadrupolar Nuclei in Solids. J. Am. Chem. Soc. 1995, 117, 12779− 12787.
(12) Amoureux, J. P.; Fernandez, C.; Steuernagel, S. Z-Filtering in MQ MAS NMR. J. Magn. Reson. A 1996, 123, 116−118.
(13) Massiot, D. Sensitivity and Lineshape Improvements of MQ-MAS by Rotor Synchronized Data Acquisition. J. Magn. Reson., Ser. A 1996, 122, 240−244.
(14) Gullion, T.; Schaefer, J. Rotational-Echo, Double-Resonance NMR. J. Magn. Reson. 1989, 81, 196−200.
(15) Gullion, T.; Schaefer, J. Elimination of Resonance Offset Effects in Rotational-Echo, Double Resonance NMR. J. Magn. Reson. 1991, 92, 439−442.
(16) Massiot, D.; Fayon, F.; Capron, M.; King, I.; Calvé, S. L.; Alonso, B.; Durand, J. O.; Bujoli, B.; Gan, Z.; Hoatson, G. Modeling One- and Two-Dimensional Solid-State NMR Spectra. Magn. Reson. Chem. 2002, 40, 70−76.
(17) Czjzek, G.; Fink, J.; Schlmidt, H.; Coey, J. M. D.; Rebouillat, J. P.; Lienard, A. Atomic Coordination and the Distribution of Electric Field Gradients in Amorphous Solids. Phys. Rev. B 1981, 23, 2513− 2530.
(18) Caër, G. L.; Brand, R. A. General Models for the Distributions of Electric Field Gradients in Disordered Solids. J. Phys.: Cond. Matter 1998, 10, 10715−10774.
(19) d‘Espinose de Lacaillerie, J.-B.; Frétigny, C.; Massiot, D. MAS NMR Spectra of Quadrupolar Nuclei in Disordered Solids: The Czjzek Model. J. Magn. Reson. 2008, 192 (2), 244−251.
(20) Florian, P.; Véron, E.; Green, T.; Yates, J. R.; Massiot, D. Elucidation of the Al/Si Ordering in Gehlenite Ca2Al2SiO7 by
Combined 29Si and 27Al NMR Spectroscopy/Quantum Chemical
Calculations. Chem. Mater. 2012, 24, 4068−4079.
(21) Pham, T. N.; Griffin, J. M.; Masiero, S.; Lena, S.; Gottarelli, G.; Hodgkinson, P.; Filip, C.; Brown, S. P. Quantifying Hydrogen-Bonding Strength: The Measurement of 2hJNN Coupling in Self-Assembled Guanosines by Solid-State 15N Spin-Echo MAS NMR.
Phys. Chem. Chem. Phys. 2007, 9, 3416−3423.
(22) Florian, P.; Sadiki, N.; Massiot, D.; Coutures, J. P.27Al NMR
Study of the Structure of Lanthanum- and Yttrium-Based Alumi-nosilicate Glasses and Melts. J. Phys. Chem. B 2007, 111, 9747−9757. (23) Iftekhar, S.; Pahari, B.; Okhotnikov, K.; Jaworski, A.; Stevensson, B.; Grins, J.; Edén, M. Properties and Structures of RE2O3-Al2O3-SiO2
(RE = Y, Lu) Glasses Probed by Molecular Dynamics Simulations and Solid-State NMR: The Roles of Aluminum and Rare-Earth Ions for Dictating the Microhardness. J. Phys. Chem. C 2012, 116, 18394− 18406.
(24) Coutures, J. P.; Rifflet, J. C.; Florian, P.; Massiot, D. Etude par Analyse Thermique et par RMN Très Haute Température de27Al de
la Solidification de Al2O3 en l’Absence de Nucléation Hétérogène:
Effets de la Température du Liquide et de la Pression Partielle d’Oxygène. Rev. Int. Hautes Temp. Refract. 1994, 29, 123−142.
(25) Fyfe, C. A.; Lewis, A. R. Investigation of the Viability of Solid-State NMR Distance Determinations in Multiple Spin Systems of Unknown Structure. J. Phys. Chem. B 2000, 104, 48−55.
(26) Kwak, J. H.; Hu, J.; Mei, D.; Yi, C.-W.; Kim, D. H.; Peden, C. H. F.; Allard, L. F.; Szanyi, J. Coordinatively Unsaturated Al3+Centers as
Binding Sites for Active Catalyst Phases of Platinum on γ-Al2O3.