_____________________________________________________________________________________________________ *Corresponding author: E-mail: zinou.agro@gmail.com;
Response to F3 Selection for Grain Yield in Durum
Wheat [Triticum turgidum (L.) Thell. ssp. turgidum
conv. durum (Desf.) Mac Key] under South
Mediterranean Conditions
Zahira Laala
1, Amar Benmahammed
2, Abdelmalek Oulmi
2,
Zine El Abidine Fellahi
3*and Hamenna Bouzerzour
21
Valorization of Natural Biological Resources Laboratory (VNBR Lab), Department of Agronomy, Faculty of Natural and Life Sciences, University of Ferhat Abbas Setif-1, Setif, 19000, Algeria. 2
Valorization of Natural Biological Resources Laboratory (VNBR Lab), Department of Ecology and Plant Biology, Faculty of Natural and Life Sciences, University of Ferhat Abbas Setif-1, Setif, 19000, Algeria. 3
Department of Agronomy, Faculty of Natural, Life and Earth Sciences and the Universe, University of Mohamed El Bachir El Ibrahimi, Bordj Bou Arreridj, 34030, Algeria. Authors’ contributions This work was carried out in collaboration between all authors. These authors contributed equally to this paper. All authors read and approved the final manuscript. Article Information
DOI: 10.9734/ARRB/2017/37923 Editor(s): (1)Paola Angelini, Department of Applied Biology, University of Perugia, Perugia, Italy. (2)George Perry, Dean and Professor of Biology, University of Texas at San Antonio, USA. Reviewers: (1)Nebi Bilir, Suleyman Demirel University, Turkey. (2)Manasi Dash, Orissa University of Agriculture and Technology, India.
(3)Lwanga Charles Kasozi, University of KwaZulu-Natal, South Africa. (4)Bojan Stipešević, University of J. J. Strossmayer in Osijek, Croatia. Complete Peer review History:http://www.sciencedomain.org/review-history/22357
Received 1st November 2017 Accepted 4th December 2017 Published 19th December 2017
ABSTRACT
An experiment was carried out at the Field Crop Institute, Agricultural Research Station of Setif (ITGC-ARS, Setif, Algeria), to assess the response to early generation selection in durum wheat (Triticum durum Desf.). Results indicated the presence of sufficient variability to warrant selection. Correlation coefficients of biological yield, plant height, spike number, kernels per spike, harvest index and days to heading with grain yield were significant. Path analysis emphasized the direct
and indirect effects of biomass yield, spike number and harvest index on grain yield, suggesting that F3-selection based on one or simultaneously on all these traits would result in significant direct and correlated responses. However, intergeneration correlation and parent-offspring regression coefficients predicted that F3-selection based on biomass yield, spike number, harvest index, 1000-kernel weight and grain yield will be ineffective while plant height and days to heading selection will be efficient. Direct and correlated responses to F3-selection for biomass yield, spike number, harvest index, 1000-kernel weight, plant height, days to heading and grain yield confirmed predictions drawn from intergeneration correlation and parent-offspring regression coefficients. Inefficiency of F3-selection was attributed to genotype x environment interaction. The overall results suggested that early generation selection should be restricted to plant height and days to heading while selection to improve grain yield directly or via related traits should be delayed to later advanced generation.
Keywords: Triticum durum; F3 selection; path analysis; intergeneration correlation; parent-offspring regression; response; realized heritability.
1. INTRODUCTION
Durum wheat breeders are interested in developing high yielding and stable varieties. Selection of such desirable genotypes starts in early generation or is delayed when progenies are nearly homozygous in advanced generations. In early stages of breeding programs, direct estimates of yield are quite difficult and according to [1], selection practiced is mostly unsuccessful owing to heterozygosity, confounding effects of dominance and epistatic gene action, large environmental variation, and inability to evaluate genotypes x environment interaction. Selection for yield components appeared to be more effective, if selected traits are highly heritable across environments and highly correlated with grain yield [2]. Knott and Talukdar [3] suggested that wheat yield could be increased by selecting for kernel weight. Rasmusson and Cannell [4] reported that barley selection for number of heads resulted in changes in yield similar to those brought by selection for yield itself. Indirect selection has been shown to be more efficient, less efficient, or equally efficient compared to direct selection when selection was practiced to improve a trait in one environment by selecting the trait in another environment [5]. Efficiency of indirect selection compared to direct selection depends on the heritability of the trait used as selection criterion and on correlation between this trait and the indirectly targeted trait [6,7]. Investigation of association between yield and secondary traits and correlation coefficient partitioning into direct and indirect effects through path analysis are useful to provide a realistic picture of the relationships between dependent and independent variables [8,9,10]. The objectives of this study were to analyze variability, to compute correlations coefficients, to
partition these coefficients into direct and indirect effects, to estimate heritability and to investigate direct and indirect responses in F4 generation to F3 divergent selection for yield and yield components in durum wheat [Triticum turgidum (L.) Thell. ssp. turgidum conv. durum (Desf.) Mac Key], under south Mediterranean conditions.
2. MATERIALS AND METHODS
2.1 Site, Plant Material and Experimental Design
The experiment was conducted at the Field Crop Institute Agricultural Research Station of Setif (ITGC-ARS, Setif, 36°12’ N, 5°24’ E, 1023 masl) during the 2008/09 and 2009/10 cropping seasons. The experimental material included the four parental varieties (Ofanto, Mohammed Ben Bachir, Waha and Mrb5) and their 330 F3 and F4 segregating lines, developed by pedigree method. Ofanto is an Italian cultivar [11], Waha and Mrb5 are cultivars selected from Icarda-Cimmyt durum wheat breeding program. Mohammed Ben Bachir (MBB) is a variety selected from a land race widely grown in the Algerian eastern high plateaus [12]. F3 and F4 lines were grown in 2-row plots 5.00 m long with 0.20 m inter rows space, between the parents which were repeated four times. Seeding was done in November, adopting a seeding rate of 200 kernels/m2. Rainfall accumulated during 2008/09 and 2009/10 cropping cycles was 369.8 and 502.4 mm, respectively.
2.2 Measurements
The following traits were measured on per plot basis. Heading date (DHE, days) was estimated as number of calendar days from January first to
the date when 50% the spikes were half ways out from flag leaf. Plant height (PHT, cm) was measured from the soil surface to the top of the spike, awns excluded. Above ground biomass (BIO, g/m²) was estimated from a harvested area of 1 m long x 0.20 cm inter-row spacing, which served also to obtain the number of spikes (SN, /m²). Grain yield (GY, g/m²) was estimated from a harvested area of one row 5 m long x 0.20 cm inter-row spacing. 1000-kernel weight (TKW, g) was derived from the count and weight of 250-kernel. Harvest index (HI, %) was estimated by the ratio between grain yield and above ground biomass. Number of kernels per spike (KS) was derived from estimated values of grain yield, number of spikes and 1000-kernel weight.
2.3 Data Analysis
Descriptive statistics were used to obtain mean, range and variances for the measured traits. Means separation was based on least significant difference (LSD5%) determined from the analysis of variance of the replicated parents. Phenotypic (CVp), and genotypic coefficients of variation (CVg) were calculated to assess trait variability. Relationships between traits within generation and among generations for a given trait were investigated using Sperman’s rang correlation coefficients and regression of F4 on F3 generation. Path analysis was used to identify traits having strong direct effect on grain yield. Broad sense heritability was determined from the variance components, while narrow sense heritability was derived from the regression coefficient of the F4 progenies on their F3 parents, corrected for the degree of inbreeding, as reported by Smith and Kinman [13]. Realized heritability (h²real) was calculated as ratio of selection response (Rs) to selection differential (S) according to Acquaah [14]. Selection
differential was calculated as difference between the means of 5% of high and 5% low selected F3 lines. Selection response was estimated as difference between the means of the 5% high and 5% low progenies (F4) of the F3-selected lines, according to Prasad et al. [15]. Direct response to selection (Rs) is the genetic improvement of a trait in response to selection upon that trait itself, whereas correlated response (CRs) is the genetic improvement of a trait in response to selection of an inherently associated trait [6]. Statistical analyses were carried out using subroutines implemented in Cropstat 7.2.3 [16], Past [17], and Lazstats [18] softwares.
3. RESULTS
3.1 Traits Variability and Heritability in the F3 Generation
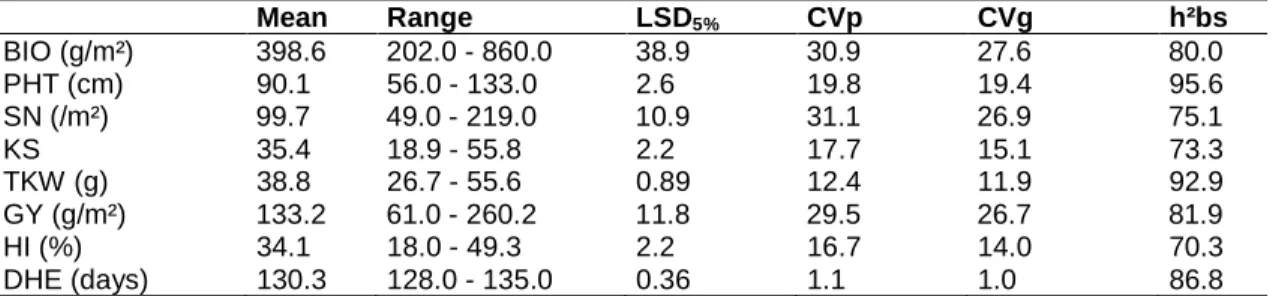
Mean and range values, least significant difference, phenotypic and genotypic coefficients of variation and broad sense heritability of the studied traits in the F3 generation are reported in Table 1. Compared with the least significant difference, significant differences existed between maximal and minimal values for the measured traits, suggesting the possibilities to make significant changes through selection.
Traits that showed higher phenotypic and genotypic variation (CVp and CVg > 20.0%) were above ground biomass, spike number, and grain yield. Plant height, kernels per spike, 1000-kernel weight and harvest index showed intermediate level of variability (10.0% < CVp and CVg < 20.0%). Heading date expressed the lowest variability level with CVp and CVg of 1.1 and 1.0%, respectively (Table 1). Based on broad Table 1. Mean and range values, least significant difference, phenotypic and genotypic coefficients of variation and broad sense heritability of the studied traits of the F3 generation
(n = 330) Mean Range LSD5% CVp CVg h²bs BIO (g/m²) 398.6 202.0 - 860.0 38.9 30.9 27.6 80.0 PHT (cm) 90.1 56.0 - 133.0 2.6 19.8 19.4 95.6 SN (/m²) 99.7 49.0 - 219.0 10.9 31.1 26.9 75.1 KS 35.4 18.9 - 55.8 2.2 17.7 15.1 73.3 TKW (g) 38.8 26.7 - 55.6 0.89 12.4 11.9 92.9 GY (g/m²) 133.2 61.0 - 260.2 11.8 29.5 26.7 81.9 HI (%) 34.1 18.0 - 49.3 2.2 16.7 14.0 70.3 DHE (days) 130.3 128.0 - 135.0 0.36 1.1 1.0 86.8
BIO = above ground biomass, PHT = plant height, SN = spikes number, KS = kernels per spike, TKW = 1000-kernel weight, GY = grain yield, HI = harvest index, DHE = number of calendar days to heading
sense heritability (h²bs) estimates, plant height and 1000-kernel weight were classified as highly heritable (h²bs > 90.0%). Heritability values of the remaining traits were intermediate, varying from 70.3% for harvest index to 86.8% for days to heading (Table 1).
3.2 Traits Relationship
Traits relationship analysis indicated that the highest and significant values of Sperman’s rank correlations were observed between above ground biomass and spike number (0.829**) and between above ground biomass and grain yield (0.843**). Moderate and significant correlation coefficients were found between plant height and 1000-kernel weight (0.532**), between grain yield and spikes number (0.777**) and between kernels per spike and harvest index (0.618**). The remaining correlation coefficients were weak even though significant or weak statistical significance (Table 2).
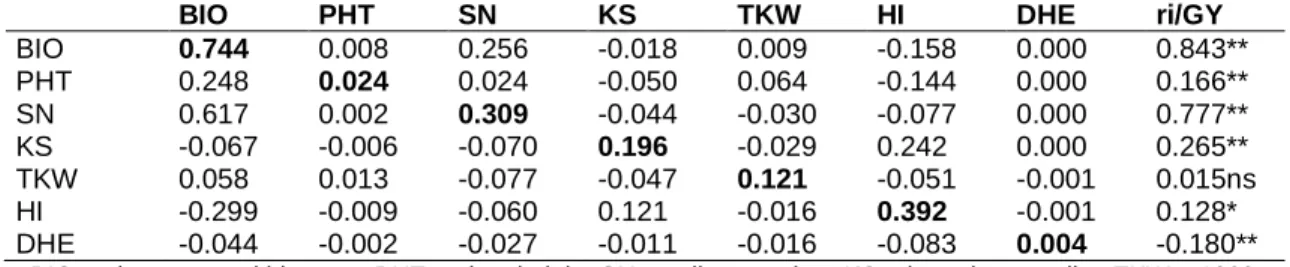
Days to heading showed weak and significant negative correlation coefficient with 1000-kernel weight (-0.134*), grain yield (-0.180*) and harvest index (-0.213**), and non-significant correlations coefficients with the other measured traits. These results suggested that earliness is somewhat advantageous for expression of these three characters; while high above ground biomass and spike number were advantageous for expression of high grain yield and high kernels per spike favored harvest index expression (Table 2). So to improve indirectly grain yield, above ground biomass and spike number are possible paths, while indirect improvement of harvest index should be targeted through improvement of spike fertility. Path analysis results indicated that the positive and highly significant correlation coefficient, relating above ground biomass to grain yield (0.843**), was made of sizeable direct effect of above ground biomass (0.744), plus a positive and strong indirect effect via spike number and a negative and weak indirect effect (-0.128) via harvest index. Plant height showed no direct effect but moderate indirect effects, positive via above ground biomass (0.248) and negative via harvest index (-0.144, Table 3).
The high and significant correlation coefficient relating grain yield to spike number (0.777**) was made of a moderate direct effect (0.309) and a high indirect effect via above ground biomass (0.617). Number of kernels per spike presented a
low direct effect (0.196) associated with a moderate and positive indirect effect via harvest index (0.242). The non-significant correlation coefficient relating 1000-kernel weight to grain yield was made of a low direct effect (0.121) and no sizeable indirect effects via the other traits (Table 3). Correlation coefficient relating grain yield to harvest index was made of sizeable positive direct (0.392), a positive indirect effect via number of kernels per spike (0.121) and a negative indirect effect via above ground biomass (-0.299). Direct or indirect effects of days to heading on grain yield were too weak and appear to be of little interest in selection within the studied plant material (Table 3). Path analysis results suggested that above ground biomass, spike number, harvest index and plant height are of interest due to their direct and indirect effects on grain yield. These traits should be considered in the selection scheme to improve grain yield.
3.3 Inter-Generation Correlation and Parents-Offspring Regression
Effectiveness of early generation selection depends on the breeder’s ability to distinguish differences between genotypes in early generation and the persistence of these differences in later generations. According to Bhatt [19], a high inter-generation correlation is a basic requirement for early generation selection efficiency. In the resent study above ground biomass, number of kernels per spike, and grain yield showed non-significant inter-generation correlation coefficients. Plant height, spike number, 1000-kernel weight, harvest index and days to heading showed significant inter-generation correlation coefficients (Table 4). A significant inter-generation correlation coefficient is suggestive of little or no change in the rank order of line performances from one generation to the next. On the contrary a non-significant correlation coefficient suggests that line performances ranking change from one generation to another. Such trait, measured in two generations, behaves as two completely different traits, mainly if the generations are confounded with environments. The lack of persistence of the ranking order of the lines, between generations, for above biomass, number of kernels per spike and grain yield was also suggested by the non-significant regression coefficients and low narrow sense heritability values (Table 4). Only plant height and days to
heading had moderate narrow sense heritability, which suggested that early generation selection on the basic of these traits could be effective.
3.4 Selection Response
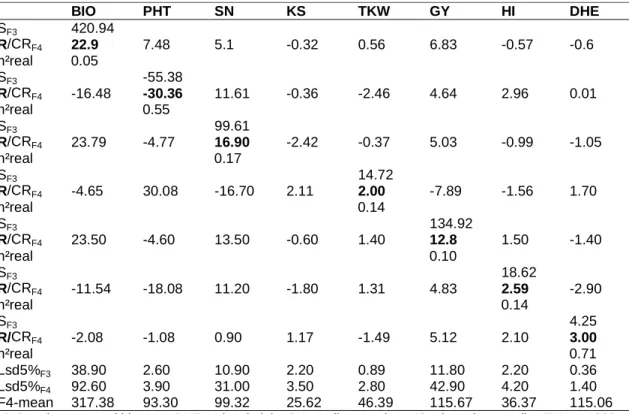
Compared to the least significant difference (Lsd5%), selection differential values were large enough to warrant effective selection response. In fact, differences between the 05% high and 05% low F3 selected lines were 420.94 g/m² for above ground biomass, -55.538 cm for plant height, 99.61 spikes/m² for spike number, 14.72 g for 1000-kernel weight, 134.92 g/m² for grain yield, 18.62% for harvest index and 4.25 days for days to heading (Table 5).
F3 selection based on above ground biomass, spike number, 1000-kernel weight, grain yield and harvest index was not effective, since the direct response (difference between the 05% high and 05% low F3 selected lines in the F4 generation was not significant. F3 selection based on above ground biomass caused significant correlated responses of plant height
(7.48 cm) and days to heading (-0.6 days). F3 selection based on spike number reduced significantly plant height (-4.77 cm), while 1000-kernel weight selection increased significantly plant height (30.08 cm) and days to heading (1.70 days). Grain yield selection reduced significant both plant height (-4.60 cm) and days to heading (-1.40 days). Similarly harvest index based selection induced significant decrease in plant height 18.08 cm) and days to heading (-2.90 days). Direct response to F3 selection based on plant height and on days to heading was significant, since plant height expressed 30.36 cm decrease and days to heading showed 3.00 days increase. Correlated responses to selection based on these two characters were non-significant (Table 5). Realized heritability was low for above ground biomass (0.05), spike number (0.17), 1000-kernel weight (0.14), grain yield (0.10) and harvest index (0.14) but high for plant height (0.55) and days to heading (0.71). These results confirmed the expectations suggested from the intergeneration correlation coefficients and the parent-offspring regressions analysis.
Table 2. Sperman’s correlation coefficients between the measured traits in the F3 generation (n = 330, probabilities above diagonal, and correlation coefficients below diagonal)
BIO PHT SN KS TKW GY HI DHE BIO 0.000 0.000 0.102 0.157 0.000 0.000 0.281 PHT 0.333 0.155 0.000 0.000 0.002 0.000 0.113 SN 0.829 0.078 0.000 0.000 0.000 0.000 0.108 KS -0.090 -0.254 -0.227 0.000 0.000 0.000 0.310 TKW 0.078 0.532 -0.251 -0.242 0.788 0.017 0.015 GY 0.843 0.166 0.777 0.265 0.015 0.021 0.001 HI -0.402 -0.367 -0.195 0.618 -0.131 0.128 0.000 DHE -0.060 -0.087 -0.089 -0.056 -0.134 -0.180 -0.213
BIO = above ground biomass, PHT = plant height, SN = spikes number, KS = kernels per spike, TKW = 1000-kernel weight, GY = grain yield, HI = harvest index, DHE = number of calendar days to heading Table 3. Direct (bold figures) and indirect effects of the measured traits on F3 generation grain
yield (n = 330)
BIO PHT SN KS TKW HI DHE ri/GY
BIO 0.744 0.008 0.256 -0.018 0.009 -0.158 0.000 0.843** PHT 0.248 0.024 0.024 -0.050 0.064 -0.144 0.000 0.166** SN 0.617 0.002 0.309 -0.044 -0.030 -0.077 0.000 0.777** KS -0.067 -0.006 -0.070 0.196 -0.029 0.242 0.000 0.265** TKW 0.058 0.013 -0.077 -0.047 0.121 -0.051 -0.001 0.015ns HI -0.299 -0.009 -0.060 0.121 -0.016 0.392 -0.001 0.128* DHE -0.044 -0.002 -0.027 -0.011 -0.016 -0.083 0.004 -0.180**
BIO = above ground biomass, PHT = plant height, SN = spikes number, KS = kernels per spike, TKW = 1000-kernel weight, GY = grain yield, HI = harvest index, DHE = number of calendar days to heading
Table 4. Inter-generation Sperman’s correlation coefficient (rs), coefficient of regression (b) of F4 on F3, and narrow sense heritability (h²ns) of the measured traits
Trait BIO PHT SN KS TKW GY HI DHE
rs 0.042 0.769 0.194 0.024 0.211 0.092 0.193 0.432 Prob 0.598 0.000 0.015 0.765 0.008 0.248 0.015 0.000 b 0.039 0.613 0.156 0.040 0.174 0.067 0.142 1.000 SEb 0.048 0.040 0.069 0.064 0.057 0.063 0.044 0.001 tobs 0.818 15.227 2.252 0.621 3.058 1.077 3.227 9438.859 Prob.>t 0.415 0.000 0.026 0.536 0.003 0.283 0.037 0.000 h²ns 0.022 0.350 0.089 0.023 0.099 0.038 0.081 0.571
BIO = above ground biomass, PHT = plant height, SN = spikes number, KS = kernels per spike, TKW = 1000-kernel weight, GY = grain yield, HI = harvest index, DHE = number of calendar days to heading Table 5. Selection differential (S) in F3, responses direct (R) and correlative (CR) and realized
heritability in F4 for traits used as selection criteria in F3-generation BIO PHT SN KS TKW GY HI DHE SF3 420.94 R/CRF4 22.9 7.48 5.1 -0.32 0.56 6.83 -0.57 -0.6 h²real 0.05 SF3 -55.38 R/CRF4 -16.48 -30.36 11.61 -0.36 -2.46 4.64 2.96 0.01 h²real 0.55 SF3 99.61 R/CRF4 23.79 -4.77 16.90 -2.42 -0.37 5.03 -0.99 -1.05 h²real 0.17 SF3 14.72 R/CRF4 -4.65 30.08 -16.70 2.11 2.00 -7.89 -1.56 1.70 h²real 0.14 SF3 134.92 R/CRF4 23.50 -4.60 13.50 -0.60 1.40 12.8 1.50 -1.40 h²real 0.10 SF3 18.62 R/CRF4 -11.54 -18.08 11.20 -1.80 1.31 4.83 2.59 -2.90 h²real 0.14 SF3 4.25 R/CRF4 -2.08 -1.08 0.90 1.17 -1.49 5.12 2.10 3.00 h²real 0.71 Lsd5%F3 38.90 2.60 10.90 2.20 0.89 11.80 2.20 0.36 Lsd5%F4 92.60 3.90 31.00 3.50 2.80 42.90 4.20 1.40 F4-mean 317.38 93.30 99.32 25.62 46.39 115.67 36.37 115.06
BIO = above ground biomass, PHT = plant height, SN = spikes number, KS = kernels per spike, TKW = 1000-kernel weight, GY = grain yield, HI = harvest index, DHE = number of calendar days to heading
4. DISCUSSION
High variability (CVp > 20.0%) was observed in F3 generation for above ground biomass, spike number, and grain yield. Intermediate variability (10.0% < CVp < 20.0%) was noted for plant height, kernels per spike, 1000-kernel weight and harvest index. Days to heading exhibited low variability. Broad sense heritability estimates were higher than 70.3% for the studied traits. The presence of high variability coupled to high broad sense heritability estimates suggested that F3-selection should be effective. These results
compared fairly well with those reported under similar conditions by Fellahi et al. [20]. These authors reported phenotypic coefficient of variation values of 1.55% for days to heading, 11.40% for harvest index, 12.66% for 1000-kernel weight, 12.82% for plant height, 17.5% for number of kernels per spike, 29.21% for spike number and 28.45% for grain yield.
Results of trait relationships analysis indicated that above ground biomass was highly correlated with spike number and with grain yield. Moderate correlation coefficients existed between plant
height and 1000-kernel weight, between grain yield and spike number and between kernels per spike and harvest index. Days to heading had weak negative correlations with 1000-kernel weight, grain yield and harvest index. Earliness appeared to be advantageous. High above ground biomass and spike number were needed for best expression of grain yield while high kernels per spike contributed positively to harvest index expression. These results suggested that grain yield could be improved indirectly via above ground biomass and spike number. Improvement of harvest index should be targeted through spike fertility selection. In this context Singh et al. [21] found that grain yield was significantly and positively correlated with 1000-kernel weight and negatively with plant height. Similar association was observed by Tambe et al. [22] for 1000-kernel weight and grain yield while Hannachi et al. [23] as well as Ali and Shakor [8] reported that grain yield showed positive and significant correlation with above ground biomass and number of spikes. Hannachi et al. [23] noted also that harvest index showed negative and significant correlation with plant height and with 1000-kernel weight, and positive and significant correlation with number of kernels per spike. Mollasadeghi and Shahryari [24] reported a negative correlation between harvest index and plant height. Singh [25] reported significant and positive correlation coefficients of grains per spike, tiller number and biological yield with grain yield in F2 generation, suggesting that selection based on one or simultaneously on all three yield components would result into high grain yield. Mansouri et al. [26] investigated the relationships among agronomic traits and grain yield in 56 genotypes of durum wheat (Triticum durum Desf.). Their results indicated that above ground biomass, harvest index and spike number were the most grain yield influencing traits, suggesting that selection should be carried out preferentially for these traits to accumulate favorable alleles in the selected entries for future uses.
Path analysis results indicated that above ground biomass affected grain yield directly and via spike number. Plant height acted indirectly on grain yield, positively via above ground biomass and negative via harvest index. Spike number acted directly and indirectly via above ground biomass. 1000-kernel weight had weak direct effect on grain and non-significant indirect effects via the other yield components. Harvest index affected positively grain yield via kernel number per spike and negatively via above ground biomass. Path analysis results emphasized the
role of above ground biomass, spike number, harvest index and plant height which should be considered in selection to improve grain yield. Hannachi et al. [23] reported similar results, they found that above ground biomass and harvest index exerted positive direct effect on grain yield, and that the highest indirect effects on grain yield were engendered by spike number, plant height, and 1000-kernel weight through above ground biomass. Baranwal et al. [27] found that 1000-kernel weight exhibited high positive direct effect on grain yield. Singh et al. [21] reported high positive direct effect of 1000-kernel weight, harvest index and above ground biomass on grain yield, but plant height had negative direct effect. This suggested that these characters should be given more weightage in breeding program.
Results of inter-generation correlations and parent-offspring regression coefficients analysis indicated that above ground biomass, number of kernels per spike and grain yield lack ranking persistence between generations. They had non-significant regression coefficients and low narrow sense heritability values, while plant height and days to heading had moderate narrow sense heritability, significant intergeneration correlations and regression coefficients which make them useful and efficient early generation selection criteria. Similar results were reported by Barman and Borah [28] who found no relation between yield of F2 selection and mean yield of their corresponding F3 families, whose intergeneration correlation coefficient and parent-offspring regression were non-significant, suggesting that early generation yield based selection will be ineffective. Conversely, plant height and days to flowering showed strong correlation and regression coefficients between F2-F3 and between F3-F4 generations, suggesting the effectiveness of early generation selection for these characters [28]. Singh [25] mentioned that the identification of traits for early generation selection following correlation and regression approach was inefficient, and found that correlation coefficients of grain yield of F4 progenies with grain yield of parent F2 plants were not significant, making prediction in early generation difficult.
Results of the present study indicated that F3-selection differential values for above ground biomass, plant height, spike number, 1000-kernel weight, grain yield, harvest index and days to heading were large enough to warrant effective selection response. However, F4-response to F3-selection based on above ground biomass,
spike number, 1000-kernel weight, grain yield and harvest index was not significant (Fig Above ground biomass F3-selection increased indirectly plant height and decreased the number of days to heading of the progenies (Fig Spike number F3-selection reduced significantly plant height, while 1000-kernel weight F3 selection increased significantly plant height and days to head. Grain yield F3-selection reduced significant both plant height and days to heading. Similarly harvest index based F3
induced significant decrease in plant height and
Fig. 1. Above ground biomass selection differential and response to F3
Fig. 2. Above ground biomass direct and correlated responses to F3
group of lines expressed as % of the values of L group of lines)
0 100 200 300 400 500 600 700 800 900 H H H H H H H H H H H B io m a ss y ie ld ( g /m ²) KS HI DHE
kernel weight, grain yield and harvest index was not significant (Fig. 1). tion increased indirectly plant height and decreased the number of days to heading of the progenies (Fig. 2). selection reduced significantly kernel weight F3-selection increased significantly plant height and
selection reduced significant both plant height and days to heading. Similarly harvest index based F3-selection induced significant decrease in plant height and
days to head. Direct response to plant height and to days to heading F3-selection was significant, with non-significant correlated responses (Figs. 3, 4).
Realized heritability was low for above ground biomass, spike number, 1000-kernel weight, grain yield and harvest index but high for plant height and days to heading. These results confirmed the expectations suggested from the intergeneration correlation coefficients and the parent-offspring regressions analyses. These
Above ground biomass selection differential and response to F3-selection
2. Above ground biomass direct and correlated responses to F3-selection for (values of H group of lines expressed as % of the values of L group of lines)
H H H H H H H H H L L L L L L L L L L L L L L L L
Selected H and L groups of lines
BIOF4 BIOF3 96 98 100 102 104 106 108 110 PHT BIO GY SN TKW
days to head. Direct response to plant height selection was significant correlated
Realized heritability was low for above ground kernel weight, grain yield and harvest index but high for plant d days to heading. These results confirmed the expectations suggested from the intergeneration correlation coefficients and the offspring regressions analyses. These
selection
selection for (values of H
Fig. 3. Plant height selection differential and response to F3
Fig. 4. Plant height direct and correlated responses to F3
expressed as % of the values of H group of lines) results corroborated findings of Singh and Balyan
[29] who reported that plant height showed effective selection in the early generation while harvest index, grain yield and above ground biomass were ineffective. Alexander et al. [30] reported that selection of plant height was effective in F3 and F4 generations.
The objective of most wheat breeding programs aimed to enhance grain yield genetic potential.
0 20 40 60 80 100 120 140 L L L L L L L L L L L P H T ( cm ) PHTF3 DHE GY SN
Plant height selection differential and response to F3-selection
4. Plant height direct and correlated responses to F3-selection (values of L group of lines expressed as % of the values of H group of lines)
results corroborated findings of Singh and Balyan [29] who reported that plant height showed effective selection in the early generation while harvest index, grain yield and above ground biomass were ineffective. Alexander et al. [30] on of plant height was
The objective of most wheat breeding programs aimed to enhance grain yield genetic potential.
Careful choice of parents to generate useful genetic variability and effective early generation selection are important steps leading to the development of superior yielding genotypes. Effective early generation selection depends on the presence of sufficient genetic variability, selection intensity, traits association and heritability. Early generation se
grain yield as criterion, has been reported to be ineffective, because of the relationships between
L L L L L L L L H H H H H H H H H H H H H H H H H
Low and High F3- selected lines (cm)
PHTF3 PHTF4 65 70 75 80 85 90 95 100 105 110 115 PHT BIO TKW KS HI selection
selection (values of L group of lines
Careful choice of parents to generate useful genetic variability and effective early generation ion are important steps leading to the development of superior yielding genotypes. Effective early generation selection depends on the presence of sufficient genetic variability, selection intensity, traits association and heritability. Early generation selection, using grain yield as criterion, has been reported to be ineffective, because of the relationships between
yield and yield components are often affected by the environment. Rahman and Bahl [31] mentioned that harvest index based selection to improve indirectly grain yield was no more effective than direct selection for yield. This ineffectiveness is due to the presence of genotype x environment interaction that decreased the reliability of the selection criterion. The presence of genotype x environment (G x E) explained the ineffectiveness of early generation selection practiced in the present study (based on biomass yield, spike number, 1000-kernel weight, harvest index and grain yield), since selected F3-plant materials were compared with their F4-progenies in different years. The presence of G x E is suggested by the lack of persistence of the observed differences between F3-selected high and low group of lines in the F4-generation. Plant height and days to heading were less sensitive to G x E, since F4 progenies of the F3-selected high and low group of lines retained their parental characteristics as predicted by the F3-F4 intergeneration correlation and parent-offspring regression coefficient.
5. CONCLUSION
The results of this study indicated that grain yield biomass yield, spike number, 1000-kernel weight and harvest index exhibited significant genotype x environment interaction, which makes them less reliable as early generation selection criteria to improve direct grain yield. However, plant height and days to heading were less prone to genotype x environment interaction which makes them good early generation selection criteria. Under these growth conditions segregating material should be early generation selected for plant height and days to heading, while selection for other traits highly correlated with grain yield and for grain yield itself should be delayed to advanced generations, and practiced on multi-sites and multi-years basis.
ACKNOWLEDGEMENT
This study was undertaken as a part of the project CNEPRU N° F01220140023 titled ‘Variability, genetic determinism and selection of cereals under semi-arid conditions of the Algerian eastern high plains’, financed by the Algerian Ministry of Higher Education and Scientific Research. Special thanks are extended to the personnel of the ITGC-ARS for providing seeds, helping in trials management and data collection, particularly to Mr Fayçal Djekhaba, Hocine Zerargui and Abdelkrim Hadj Sahraoui.
COMPETING INTERESTS
Authors have declared that no competing interests exist.
REFERENCES
1. Knott DR. Effects for selection for F2-plant yield on subsequent generations in wheat. Can. J. Plant Sci. 1972;52:721-726. 2. Fischer KS, Fukai S, Kumar A, Leung H,
Jongdee B. Field phenotyping strategies and breeding for adaptation of rice to drought. Front. Physiol. 2012;3:282-291. 3. Knott DR, Talukder B. Increasing seed
weight in wheat and its effect on yield, yield components, and quality. Crop Sci. 1971;11:280-283.
4. Rasmusson DC, Cannell RO. Selection for grain yield and components of yield in Barley. Crop Sci. 1970;10:51-54.
5. Sinebo W, Gretzmacher R, Edelbauer A. Environment of selection for grain yield in low fertilizer input in barley. Field Crops Res. 2002;74:151-162.
6. Falconer DS, Mackey FC. Introduction to quantitative genetics. Fourth Edition. Longman. New York; 1996.
7. Hannachi A, Fellahi Z, Rabti B, Guendouz A, Bouzerzour H. Combining ability and gene action estimates for some yield attributes in durum wheat (Triticum
turgidum L. var. durum). J. Fund. Applied
Sci. 2017;9(3):1519-1534.
8. Ali IH, Shakor EF. Heritability, variability, genetic correlation and path analysis for quantitative traits in durum and bread wheat under dry farming conditions. Mesopotamia J. Agri. 2012;40:27-39. 9. Oulmi A, Salmi M, Laala Z, Fellahi Z,
Adjabi A, Rabti A, Benmahammed A. Morpho-physiological variability studies in F6 populations of durum wheat (Triticum durum Desf.) evaluated under semi-arid
Mediterranean conditions. Adv. Environ. Biol. 2016;10(3):161-170.
10. Fellahi Z, Hannachi A, Ferras K, Oulmi A, Boutalbi W, Bouzerzour H, Benmahammed A. Analysis of the phenotypic variability of twenty F3 biparental populations of bread wheat (Triticum aestivum L.) evaluated under
semi-arid. J. Fund. Applied Sci. 2017;9(1):102-118.
11. Annicchiarico P, Bellah F, Chiari T. Defining sub regions and estimating benefits for a specific adaptation strategy
by breeding programs: A case study. Crop Sci. 2005;45:1741-1749.
12. Belkharchouche H, Benbelkacem A, Bouzerzour H, Benmahammed A. Flag leaf and awns ablation and spike shading effects on spike yield and kernel weight of durum wheat (Triticum turgidum L. var. durum) under rainfed conditions. Adv.
Environ. Biol. 2015;9:184-191.
13. Smith JD, Kinman ML. The use of parent-offspring regression as an estimator of heritability. Crop Sci. 1965;5:595-596. 14. Acquaah G. Principles of plant genetics
and breeding. Blackwell Publishing, Oxford, UK. 2007;584.
15. Prasad B, Carver BF, Stone ML, Babar MA, Raun WR, Klatt AR. Genetic analysis of indirect selection for winter wheat grain yield using spectral reflectance indices. Crop Sci. 2007;47:1416-1425.
16. Cropstat 7.3.2. Software package for windows. International Rice Research Institute, IRRI, Manila; 2007.
17. Hammer O, Harper DAT, Ryan PD. Past: Paleontological statistics software package for education and data analysis. Paleontologia Electronica. 2001;4:1-9. 18. LazStats, Free Statistics Programs and
Materials by W.G. Miller; 2013.
19. Bhatt GM. Early generation selection criteria for yield in wheat. J. Aust. Inst. Agric. Sci. 1980;46:14-22.
20. Fellahi Z, Hannachi A, Guendouz A, Bouzerzour H, Boutekrabt A. Genetic variability, heritability and association studies in bread wheat (Triticum aestivum
L.) genotypes. Elect. J. Plant Breed. 2013;4:1161-1166.
21. Singh K, Punia MS, Singh V. Inter-relationship between grain yield and its component characters in F2 generation of bread wheat (Triticum aestivum L.). Int. J.
Curr. Advan. Res. 2016;5:749-751.
22. Tambe A, Mehta DR, Chovatia VP, Bhatiya VJ. Genetic variability, character association and path coefficient analysis in durum wheat (Triticum durum Desf.).
Electr. J. Plant Breed. 2013;4:1303-1308.
23. Hannachi A, Fellahi Z, Bouzerzour H, Boutekrabt A. Correlation, path analysis and stepwise regression in durum wheat (Triticum durum Desf.) under rainfed
conditions. J. Agric. Sustain. 2013;3:122-131.
24. Mollasadeghi V, Shahryari R. Important morphological markers for improvement of yield in bread wheat. Adv. Environ. Biol. 2011;5:538-542.
25. Singh T. Evaluation of empirical and predictive approach of selection for yield improvement in wheat. J. Plant Sci. Res. 2015;2:135-141.
26. Mansouri A, Bouzerzour H, Oudjehih B, Benbelkacem A. Variation and relationships among agronomic traits in durum wheat [Triticum turgidum (L.) Thell. ssp. turgidum conv. durum (Desf.) MacKey] under south Mediterranean growth conditions: Stepwise and path analyses. Submitted to J. Fund. Applied Sci; 2017.
Available:http://www.jfas.info
27. Baranwal DK, Mishra VK, Vishwakarma MK, Yadav PS, Arun B. Studies on genetic variability, correlation and path analysis for yield and yield contributing traits in wheat (T. aestivum L. em Thell.). Plant Arch.
2012;12:99-104.
28. Barman D, Borah SP. Effect of selection response on F3 and F4 generation for yield and yield component characters in mutant rice strain (Oryza sativa L.). APCBEE Procedia. 2012;4:183-187. 29. Singh T, Balyan HS. Relative efficiency of
various single plant selection crirteria and F3-generation yield testing in wheat (Triticum aestivum L.). Indian J. Genet.
2003;63:24-29.
30. Alexander WL, Smith EL, Dhanasobhan C. A comparison of yield and yield component selection in wheat. Euphytica. 1984;33: 953-961.
31. Rahman MA, Bahl PN. Evaluation of early generation testing in chickpea. Plant Breed. 1986;82-85.
_________________________________________________________________________________ © 2017 Laala et al.; This is an Open Access article distributed under the terms of the Creative Commons Attribution License (http://creativecommons.org/licenses/by/4.0), which permits unrestricted use, distribution, and reproduction in any medium, provided the original work is properly cited.
Peer-review history:
The peer review history for this paper can be accessed here: http://sciencedomain.org/review-history/22357