Synthesis, Characterization and Electrochemical Studies of Active Materials for Sodium Ion Batteries
N. D. Trinha,b, O. Crosniera, S. B. Schougaardb,* and T. Broussea,*
a Laboratoire de Génie des Matériaux et Procédés Associés, Polytech Nantes, BP 50609,
44306 Nantes Cedex 3, France
b Departement of Chemistry, Université du Québec à Montréal, 2101 rue Jeanne-Mance,
Montréal, H2X 2J6, Canada
Sodium ion batteries represent an interesting alternative to lithium ion batteries for large scale energy storage, due to the inexpensive and massive sources of sodium. Moreover, the incertitude related to lithium resources and their suppliers could become a major problem in the coming years. In this study, synthesis and electrochemical analyses were performed to examine TiO2 (B) and
Na2Ti6O13’s potential as negative electrode materials in sodium ion
batteries. These materials were selected due to their well-known small cation insertion redox reactions.
Introduction
With the increase of the worldwide energy consummation, "green energy" such as wind energy, solar, etc. becomes more attractive in comparison with fossil fuels. Different systems are being developed to store these predominantly transient energy sources, incl. lithium batteries (1). The high energy density of lithium batteries makes them interesting for applications like electrification of vehicles (2), but concerns about safety, long term stability (>20 years) and cost makes these materials less ideal for larger batteries. Moreover, the incertitude related to lithium resources and their suppliers could become a major problem in the coming years (3). An interesting alternative to the lithium technology is the sodium ion battery, specifically for large scale batteries used for load leveling and other transient energy demands. The basic electrochemical mechanism based on insertion reactions employed here remains unaltered from the lithium ion batteries. However, there are some subtle differences when replacing lithium by sodium: the standard potential for sodium is -2.7 V vs. SHE compared to lithium -3.0 V vs. SHE. While this is an apparent disadvantage for the sodium ion battery due to the lower operating voltage, it also represents a long term advantage since the reactivity of the anode with the electrode is greatly diminished. Further, the ionic radii of Na+ (1.009 Å) is larger than that of Li+ (0.793 Å) (4), which represents a challenge for the synthesis of new insertion materials that can accommodate this increased volume change.
Due to the advantages mentioned above, research into materials for sodium ion batteries has seen an increase over the past years (5). However, as of yet, no consensus have emerged with regard to active materials that can meet the stringent design criteria of large scale batteries. One interesting candidate for the anode is the hard carbon examined by Dahn et al. (6,7) which exhibits high sodium insertion capacity (300 mAh.g-1).
which are known to insert lithium ions and which have crystal structures that could accommodate the increased ionic size of the sodium ion.
Titanium-based insertion compounds are known to show great stability during extensive cycling when lithium ions are used as the insertion species (8-11). The Ti4+/Ti3+ redox couple is located around 1.5 V vs. Li/Li+, equivalent to ~1.2 V vs. Na/Na+, and represents a good candidate for a system that would be thermodynamically stable in the organic electrolyte. Materials such as TiO2 (B) and Na2Ti6O13 have been studied in
lithium ion batteries and showed reversible capacity of 85-115 mAh.g-1 (0.25-0.35 Li+ per
TiO2 (B) unit) (8) and 150 mAh.g-1 (3 Li+ per Na2Ti6O13 unit) (10), respectively. In this
present work, both materials were synthesized by solid state reaction and characterized by XRD (X-ray diffraction), SEM (scanning electrochemical microscopy), adsorption isotherms (BET-type) and EDX (energy dispersive x-ray spectroscopy). These well-characterized phases were subsequently tested as active materials in batteries using slow scan voltammetry and galvanostatic cycling to evaluate their performance and stability in real sodium systems.
Experimental
TiO2 (B) and Na2Ti6O13 were synthesized by solid state reaction. Briefly, TiO2 (B) (12)
was made by mixing KNO3 (Prolabo 99%) and TiO2anatase (Aldrich ≥ 99%), in a molar
ratio of Ti / K = 1.9, i.e. 5% potassium excess. The powder was calcined at 800°C for 16h and at 1000°C for 8h to form K2Ti4O9. An ion exchange at room temperature was carried
out in 0.4M HNO3 for 3 days to form H2Ti4O9·nH2O. The final step was dehydration at
400°C during 8h to obtain TiO2 (B). Na2Ti6O13 was synthesized using stoichiometric
amounts of TiO2 anatase and Na2CO3 (Aldrich 99.5+%). The mixture was calcined at
800°C during 1 day, followed by grinding, mixing, pelletizing, and a second calcination at
930°C for 3 days. The final calcination was terminated by quenching with dry air.
XRD patterns were obtained with a PanAnalytical PW 3040/60 X’Pert Pro (source Cu Kα1 = 1.540598). Scanning electron microscopy was performed using Stereoscan 440, Leica Cambridge. EDX spectra were obtained from an Oxford Instrument X-Max 80 mm2 detector. BET surface area measurements were carried out by a Nova 4200e Surface Area & Pore Size Analyzer from Quantachrome Instruments. Electrochemical tests were performed using a working electrode consisting of a mixture of active material: carbon: polyvinylidene fluoride (PVdF) in a mass-ratio of 8:1:1. The composite electrode was prepared by dispensing these materials in NMP before dispersal on a copper foil by a Doctor blade. The wet thickness of the coating was fixed at 150 μm. The coating was dried in an oven at 60°C during 2h. For cyclic voltammetry analysis (-1.2 to -2.5 V vs. Ag/AgNO3, sweep rate of 0.1 mV.s-1), counter and reference electrodes were respectively
a platinum wire and Ag/AgNO3 with an intern solution of 0.1 M TBAP / 0.01 M AgNO3 /
acetonitrile (Basi). Galvanostatic cycling was carried out using a VMP3 galvanostat/potentiostat (Biologic) in a two-electrodes battery cell with metallic sodium as the counter electrode and glass fiber paper as the separator. Both types of analysis were performed in a 1M NaClO4 propylene carbonate electrolyte solution at 25°C. To
ensure stringent anaerobic and dry conditions, all analysis were completed in an argon filled glove box (H2O, O2 < 1 ppm).
Results and Discussion
TiO2 (B)
Figure 1 shows the XRD pattern of TiO2 (B) powder. The crystalline structure was
obtained without any detectable secondary phase, such as the TiO2 anatase starting
material.
Figure 1. Comparison between XRD patterns of TiO2 anatase and TiO2 (B) powders.
Figure 2. SEM images of TiO2 (B) powder synthesized at (a) 5000X and (b) 10 000X.
SEM micrographs of the TiO2 (B) powder are shown in Figure 2. The powder consists
of needle shaped grains, of sub-micrometer width and several micrometers of length. The measured BET surface area of 12 ± 1 m2.g-1 showed limited porosity, in good agreement with the literature (8,9). EDX for 2 different samples of TiO2 (B) revealed less than 3 %
K per TiO2 unit formula, indicating an almost complete replacement of potassium by
hydrogen during the ion-exchange synthesis step.
Figure 3 shows the initial charge and subsequent curves of sodium cells equipped with a positive TiO2 (B) and a negative Na electrode. Analyses were carried out between 2.2
and 1.0 V vs. Na/Na+. The potential range is equivalent to 2.5 to 1.3 V vs. Li/Li+, and thus
covers the standard potential of Ti4+/Ti3+ located at ~1.6 V vs. Li/Li+. The initial charge reached the cut off potential for a capacity of 4.5 mAh.g-1, equivalent to an insertion of 0.013 mole Na+ per TiO2 (B) unit. This value does not compare favourably with lithium
ion insertion, which has been show to reach reversible capacities of 85-115 mAh.g-1 i.e. 025-0.35 mole Li+ per TiO
2 (B) unit (8). The capacity value observed in our sodium
system is within the range that could be attributed exclusively to double-layer capacitance.
Figure 3. (a) Galvanostatic charge curves and (b) variation of charge and discharge of TiO2 (B) in Na cells at C/5 for x = 0.25. (2.2 to 1.0 V vs. Na/Na+)
Figure 4. Voltammograms of TiO2 (B). (0.1 mV.s-1 in 1M NaClO4/PC).
Figure 4 shows the cyclic voltammetry of TiO2 (B) in the sodium perchlorate
electrolyte. A reduction peak is observed around -1.9 V vs. Ag/AgNO3 which is attributed
to the reduction of Ti4+/Ti3+. However, upon reversal of the scan direction the accompanying oxidation peak is not present. This is presumably due to partial destruction of the structure, caused by a massive volume change required to accommodate the intercalated sodium ions in the structure. In turn, the observation that the subsequent cycles exhibits diminished cathodic currents support this assessment, and gives an indication of why galvanostatic cycling performance is remarkably low.
Na2Ti61O13
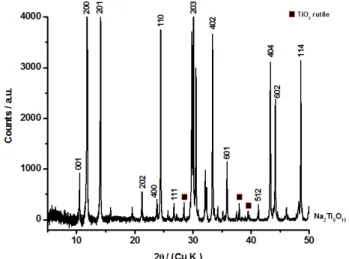
Figure 5 shows the XRD pattern of the product obtained after calcination. The predominant peaks were indexed as Na2Ti6O13. A small fraction of rutile as secondary
product is always present, independently of the synthetic route (13).
Figure 5. XRD pattern of Na2Ti6O13 powder.
Figure 6. SEM images of Na2Ti6O13 at (a) 10 000X and (b) 20 000X.
The as synthesized Na2Ti6O13 powder (Figure 6) consists of aggregated materials with
the largest aggregates being several micrometers large. EDX results revealed a ratio of around 1:3 for Na/Ti, confirming the desired stoichioemetry. The Na2Ti6O13 structure is
built of sheets of TiO6 octahedral sharing edge and corner with small tunnels along the c
axis which could accommodate the insertion of the larger alkali metal ions. Previous works by in situ x-ray diffraction demonstrated a reversible process of lithium insertion by three steps: two solid-solution and one biphasique transition (10). Previous work has also shown that the insertion of lithium ions in Na2Ti6O13 using cyclic voltammetry leads
to two redox peaks present at 1.35 V and 1.15 V vs. Li/Li+ (10).
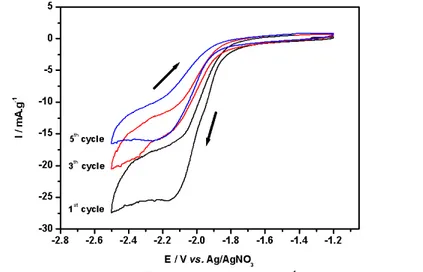
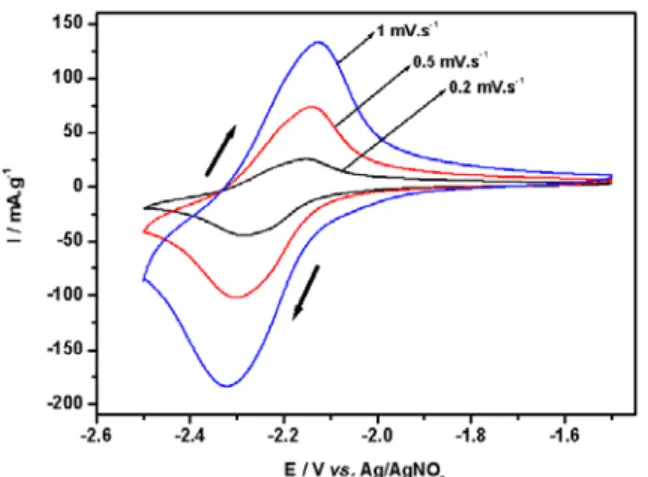
Our experiment using sodium ion containing electrolyte (Figure 7) shows a single redox peak at -2.2 V vs. Ag/AgNO3, corresponding to the second peak of lithium
insertion at 1.15 V vs. Li/Li+. There is therefore a clear difference between the electrochemical behaviour in sodium vs. lithium electrolytes. The unambiguous assignment of the peak at 1.15 V vs. Li/Li+ is not yet available, while the peak at 1.35 V
vs. Li/Li+, absent in the sodium system, has been attributed to the Ti4+/Ti+3 redox couple (10).
Figure 7. Voltammograms of Na2Ti6O13 at different scan rates in 1M NaClO4/PC.
Figure 8. (a) Galvanostatic charge and discharge curves and (b) variation in discharge and charge capacity of Na2Ti6O13 in Na cells at C/50. (3.0 to 0.1 V vs. Na/Na+)
Figure 8 shows the charge and discharge curves for a typical Na2Ti6O13/Na(s)
electrochemical cell. The potential range of the galvanostatic cycling was 3.0 and 0.1 V vs. Na/Na+ with a cycling rate at C/50 based on a theoretical capacity based on insertion of three sodium ions per Na2Ti6O13 formula unit. For the initial charge, the electrode
potential gradually decreased to obtain a plateau at ~0.8 V vs. Na/Na+, corresponding to the redox peak observed by cyclic voltammetry. This plateau occurred at a level of insertion of about 0.9 Na+ per Na2Ti6O13 unit. This is followed by a second plateau from
0.7 V to 0.5 V vs. Na/Na+, before a gradual decrease of the potential until a capacity equivalent to insertion of 1.6 mole Na+ per formula unit, at the 0.1 V cut-off potential.
The presence of two plateaus, indicating a phase change during cycling, in good agreement with literature (10,11). The total insertion of ~1.6 Na+ per formula units, is equivalent to 80 mAh.g-1, which it is less than the 150 mAh.g-1 obtained by lithium ions insertion (3.0 Li+ per unit formula). Current reversal the first cycle yields a discharge capacity of 22 mAh.g-1 equivalent to a columbic efficiency of 27 %.
While the nature of the associated irreversible side reaction(s) is currently unknown, the formation of a solid-electrolyte surface (SEI) layer, similar to that found on the graphite anode, could in part explain this drastic decrease of capacity (14,15). Subsequent cycles show improved columbic efficiency consistent with the formation of a quasi-stable surface layer, while the discharge capacity exhibits slow decay, to about 20 mAh.g-1 after 15 cycles.
Figure 9. (a) Galvanostatic charge and discharge curves and (b) variation in discharge and charge capacity of Na2Ti6O13 in Na cells at C/12. (3.0 to 0.1 V vs. Na/Na+)
Based on the assumption that the cause of the comparably poor performance is due to formation of a surface layer at strongly reducing potential, a second series of electrochemical test were performed at the C/12 rate. Thus the period for which the electrode is held a very low potential before current reversal is shorter than for the C/50 experiment (Figure 8). This in turn translates into a shorter period for SEI surface layer formation. The initial charge curve (Figure 9) still presents two plateaus, but now with a charge capacity of 50 mAh.g-1. The second and subsequent charge curves decrease to
below 20 mAh.g-1. The initial discharge capacity value is 23 mAh.g-1 which slowly decreases to 18 mAh.g-1 during 50 cycles. We attribute the ~24 mAh.g-1 irreversible capacity between first charge and the first discharge, to mechanism discussed previously. Importantly, this capacity loss is lower than the value obtained for the lower charge rates, in accordance with our assumption, furthermore after 10 cycles, a columbic efficiency of 100% is reached.
In here we have showed that TiO2 (B) structure is strongly affected by the insertion of
Na+, with detrimental effect on the storage capacity. Irreversible capacity observed for Na2Ti6O13 electrodes could in part be explained by a SEI layer formation. Future works
will concentrate on in situ XRD to observe modification of the structure of TiO2 (B) and
Na2Ti6O13 during galvanostatic cycling. Furthermore, SEM will be used to examine if the
electrode remains homogeneous or presents cracking due to the large change in volume. Moreover, the experimental capacity depends not only on the active material it-self but also on electrode parameters such as the composition (ratio of carbon added/active materials), mixing, thickness, packing density, electrolyte concentration etc. These parameters will in a further study be optimized to find the most favourable electrochemical performance.
Acknowledgments
The authors would like to acknowledge financial support from le Centre Québécois sur les Matériaux Fonctionnels (CQMF) and le Fonds Québéçois de Recherche sur la Nature et les Technologies (FQRNT), Canada.
References
1. M. Winter, R.J. Brodd, Chem. Rev., 104, 4245-4269 (2004). 2. J.M. Tarascon, M. Armand, Nature, 414, 359 (2001).
3. B.L. Ellis, W.R. M. Makahnouk, Y. Makimura, K. Toghill, L.F. Nazar, Nat. Mater., 6, 749, (2007).
4. P.F. Lang, B.C. Smith, Dalton Trans., 39, 7786-7791 (2010).
5. Y. Cao, L. Xiao, W. Wang, D. Choi, Z. Nie, J. Yu, L.V. Saraf, Z. Yang, J. Liu, Adv. Mater., (2011) (Available online: DOI:10.1002/adma.201100904)
6. D.A. Stevens, J.R. Dahn, J. Electrochem. Soc., 147, 1271–1273 (2000). 7. D.A. Stevens, J.R. Dahn, J. Electrochem. Soc., 148, A803–A811 (2001).
8. T. Brousse, R. Marchand, P-L Taberna, P. Simon, J. Power Sources, 158, 571-577 (2006).
9. M. Zukalava, M. Kalbac, L. Kavan, I. Exnar, M. Graetzel, Chem. Mater., 17, 1248-1255 (2005).
10. R. Domonko, E. Baudrin, P. Umek, D. Arcon, M. Gaberscek, J. Jamnik, Electrochem. Comm., 8, 673-677 (2006).
11. J.C. Pérez-Flores, A. Kuhn, F. Garcia-Alvarado, J. Power Sources, 196, 1378-1385 (2011).
12. R. Marchand, L. Brohan, M. Tournoux, Mater. Res. Bull., 15, 1129-1133 (1980). 13. S. Andersson, A.D. Wadsley, Acta Crystallogr., 15, 194 (1962).
14. E. Peled, J. Electrochem. Soc., 126, 2047 (1979).
15. S. Mori, H. Asahina, H. Suzuki, A. Yonei, K. Yokoto, J. Power Sources, 68, 59-64 (1997).