SUMMARY
Splenic germinal center reactions were measured during primary response to a plasmidic DNA intra-muscular injection. Cardiotoxin-pretreated Balb/c mice were immunized with DNA plasmids encod-ing or not the SAG1 protein, a membrane antigen of Toxoplasma gondii. Specific SAG1 anti-bodies were detected on days 16 and 36 after injec-tion of coding plasmids. The results of ELISAs showed that the SAG1-specific antibodies are of the IgG2a class.
Morphometric analyses were done on serial immunostained cryosections of spleen and drain-ing or non-draindrain-ing lymph nodes. This new approach made it possible to evaluate the chrono-logical changes induced by DNA immunisation in the germinal centres (in number and in size). Sig-nificant increases in the number of germinal cen-tres were measured in the spleen and only in drain-ing lymph nodes after plasmid injection. the mea-sured changes of the germinal centers appeared to result from the adjuvant stimulatory effect of the plasmidic DNA since both the coding and the non-coding plasmid DNA induced them.
No measurable changes were recorded in the T-dependent zone of lymph organs.
INTRODUCTION
One of the most prominent alterations induced by antigenic stimulation is the reaction of germi-nal centers (GC) which are lymphoid structures implicated in the humoral immune responses. GC located in the peripheral lymph organs within the lymph follicles are essentially composed of B and T lymphocytes, follicular dendritic cells and tingi-ble body macrophages. GC participate to the immunopoiesis of B cells but do also influence that of T cells (Heinen, 1999).
GC are the site of clonal expansion of Ag-specif-ic B lymphocytes, somatAg-specif-ic hypermutation, cell selection and Ig isotype switching. These events occur during the so-called germinal center reaction and give rise to the production of memory B cells and to precursor cells able to settle in the bone-marrow and to transform in long-lived Ig-secreting plasma cells (McHeyzer-Williams et al., 2001)
The GC reaction represents a complex series of cellular events that are regulated by factors includ-ing antigen-antibody complexes, complement, cytokines and cognate T-B and follicular dendritic cell (FDC)-B cell interactions (MacLennan, 1994). After a primary antigen challenge, GC appear after a latency period of about 3 days during which
DNA immunisation. New histochemical and morphometric data
D. Ehirchiou
1, W. Zorzi
1, R. Biemans
2, A. Vanderbeeke
2, M. Haumont
2, B. Coumans
1, S. Collin
1,
O. Jolois
1, A. Bollen
2, E. Heinen
1, and N. Antoine
11Laboratory of Human Histology, University of Liège, Belgium and 2Department of Applied Genetics, Free Univer-sity of Brussels, Belgium
Accepted: 21/03/02 Key words: plasmid DNA immunisation, SAG1 antigen, germinal center, morphometry
ORIGINAL PAPER
Eur. J. Histochem. 46: 215-222, 2002 © Luigi Ponzio e figlio - Editori in Pavia
events occur in the T-dependent zone. During two weeks post immunisation, the GC reach their maxi-mum size and develop their characteristic dark and light zones. The dark zone contains centroblasts which are large dividing B blasts located at the base of the GC in close contact to the T-dependent area. It is covered by the light zone mainly contains cen-trocytes which are medium-sized B blasts. Centrob-lasts and centrocytes react with the peanut agglu-tinin, a lectin used to mark GC (Butcher, 1982).
The end of the GC reaction occurs three weeks after antigen stimulus (Kelsoe, 1996; Heinen, 1999).
New vaccine development has been revolu-tionised by the observation that administration of plasmid DNA vectors encoding antigens can lead to protective antibody and cell-mediated immunes responses against virus, parasites and bacteries in animals (Donnelly, 1997).
Although DNA immunisation appears to be effi-cient, the particular mechanisms underlying the immune response after DNA administration are not completely elucidated. Questions not yet addressed include, for example: does a DNA immunization induce a germinal centre reaction of draining lymph organs and what happens in the T-dependent zones?
The present study was designed to examine the kinetics of GC morphological changes in mouse draining lymph organs following a single DNA immunisation. The efficiency of DNA intramuscular injection was assessed by measuring specific anti-bodies (ELISAs) in mouse sera at various intervals.
Immunohistochemical studies and morphometric analyses were done on cryosections of spleen and of draining and non-draining lymph nodes of DNA-immunised mice to determine the chronolo-gy of changes in the germinal-centre size and num-ber. Draining and non-draining were identified by intramuscular injection of Indian ink.
This work represents the first plasmidic DNA stimulation study where GC have been examined temporally.
MATERIALS AND METHODS Plasmids
The sequence encoding amino acids 18 to 336 was a Hind III-blunted EcoRI fragment of pNIV3418. It was and inserted into the JW4304rf plasmid (a kind
gift from Mullins, Dept of Microbiology and Immunology, Stanford University; California) pre-viously opened with Bg/II, blunt-ended with T4 DNA polymerase, and then digested with HindIII endonuclease. The resulting plasmid pNI contains the SAG1 gene under the control of the human cytomegalovirus (CMV) intermediate early pro-moter and intron A enhancer, and uses the bovine growth hormone (BGH) terminator for transcrip-tion terminatranscrip-tion and polyadenylatranscrip-tion. For large-scale preparations of plasmid DNA, transformed Escherichia coli DH5aF’IQ bacteria (Life Tech-nologies, S.A. Merelbeke, Belgium) were grown in terrific broth in the presence of ampicillin. Plas-mids were extracted by the alkaline phosphatase lysis method followed by two rounds of purifica-tion on caesium chloride density gradients. DNA concentrations were determined by measuring the optical density at 260 nm. The amount of endotox-in present was determendotox-ined the by chromogenic limulus amoebocyte assay (QCL-1000 kit, BioWit-taker, Verviers, Belgium).
Immunisation
Six-week-old female Balb/c mice received intra-muscular injections into each anterior tibialis mus-cle. Five days after pre-treatment of the muscle with cardiotoxin purified from Naja nigricolis venom (10mM, 100ml/injection), they were inject-ed with 100mg pNIV3452 in PBS or 100 mg JW4307f in PBS (control group) or PBS alone. The day of this injection has been defined as day 0. Four mice per group were sacrificed on days 1, 6, 9, 13, 16 and 36 post-injection.
Animals
Female Balb/c mice were killed by cervical dis-location. Spleen, aortic, and inguinal lymph nodes were excised. Each spleen was immediately cut in two parts. One part was embedded in OCT com-pound and snap frozen. Another was used for flow cytometry. Draining aortic and non-draining inguinal lymph nodes were entirely embedded in OCT compound and snap-frozen.
Blood for ELISA assays was collected in the retro-orbital vein.
Indian ink test
Four mice received in the anterior tibialis muscle 100µl Indian ink (diluted 2x in PBS). After 24
hours, the mice were sacrificed. Their lymph organs and the Indian-ink-treated muscle were dis-sected and processed for histological observations or for immunohistochemical labelling.
Immuno and histochemistry
Biotinylated monoclonal anti-mouse antibody against T cells (anti-CD3, Pharmingen, 1/100) or a biotinylated lectin (Peanut agglutinin) recognising germinal centre cells (PNA, Vector, 1/1000) were used for immunohistochemistry.
Serial cryosections 10mm thick were cut and mount-ed on poly-L-lysine-coatmount-ed slides, air-drimount-ed for 15 minutes, and fixed in acetone at 4°C for 10 minutes.
The cryosections were rehydrated in phosphate-buffered saline (PBS, pH 7.3) and transferred to a humid chamber. They were incubated for 60 min-utes at room temperature with the primary antibody. Endogenous peroxidase activity was inhibited with 0.3% H2O2 in methanol for 10 minutes. After sever-al washes in PBS, the slides were incubated for 30 minutes at room temperature with avidin-biotin-per-oxidase complex (Zymed kit, diluted 2000x) and washed in PBS. Peroxidase activity was revealed with a solution of aminoethylcarbazole (AEC, Zymed). The sections were stained for 10 minutes in the dark, counterstained with haematoxylin, and mounted in gelatine. As a control, the procedure was carried out with omission of the primary antibody.
Morphometric analysis
Four mice per group were analysed at each point of the experimental schedule. Morphometric analysis was performed on cryosections of the cen-tral part of each lymph organ. Three different sec-tions, 100 mm apart, were analysed for each spleen and lymph node. Both the area of the sections and the respective areas occupied by CD3-positive T cells (T-dependent zone) and germinal centres were evaluated by the Leica Qwin image process-ing and analysis system.
The areas occupied by the germinal centres and the T-dependent zone are expressed here as per-centages of the entire section area. This provides a measure of the surface density of germinal centres and T-dependent zones under each set of experi-mental conditions. The statistical significance of differences between control and vaccinated mice was tested with Student’s t test.
ELISA
After collection of blood from the retro-orbital vein and preparation of serum, SAG-1 anti-bodies were detected in an enzyme-linked immunoabsorbent assay (ELISA).
Ninety-six-well plates were coated overnight at 4°C with 100 ng purified recombinant SAG-1 per well. The plates were washed five times with Tris-buffered saline, 0.1% Tween 80 and saturated in the same buffer supplemented with 1% bovine serum albumin (BSA) for 1 hour at 37°C. The plates were then incubated with serial dilutions of sera (1 hour at 37°C). Next, they were washed as described above and enzyme-conjugated isotype-specific detection antibodies were added. To detect total IgG, an alkaline-phosphatase-labelled goat anti-mouse IgG antibody diluted 1/7500 was used as the secondary antibody (1h at 37°C). IgG1 and IgG2a were detected respectively with biotin-conjugated rat anti-mouse IgG1 and IgG2a. After washing, alkaline-phosphatase-conjugated strep-tavidin was added (30 minutes at room tempera-ture). After washing again, immune complexes were revealed with p-nitrophenyl phosphate as chromogenic substrate. The absorbance at 415 nm was read in a microplate reader (Biorad).
Flow cytometry
Splenic cells were isolated by mechanical dis-ruption and filtered on nylon wool. The cell sus-pensions (106 cells) were first incubated for 25 min at 4°C with biotinylated anti-CD4, -CD8a, and -B220 antibodies (Pharmingen). Biotin-conju-gated antibodies were detected with streptavidin-PE (Pharmingen). The cells were then washed twice in 1 ml cold PBS, resuspended in 750 µl cold PBS, and analysed with the FACScan (Bec-ton Dickinson).
RESULTS
Intramuscular injection of Indian ink
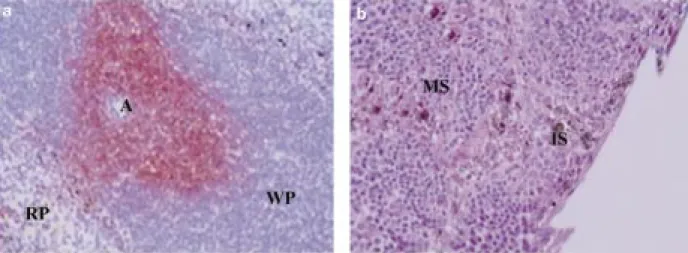
Sixteen hours after intramuscular injection of Indian ink, ink was seen at the site of injection in the connective tissue between muscle fibres and in some myocytes (data not shown). It appeared that the spleen and the aortic lymph nodes drain the injected area, as shown by the presence of Indian ink in the marginal zone of the spleen (Fig. 1a) and in the sub-capsular and intermediate sinuses of the aortic lymph nodes (Fig. 1b). Typical macrophages
showing active phagocytosis of the Indian ink were recognised in the marginal zone surrounding the white pulp. Inguinal lymph nodes are non-draining lymph nodes. No Indian ink was detected in these lymph nodes 16 hours after injection.
Priming antibody response to SAG-1 by injec-tion of the antigen-encoding plasmid
To see whether intramuscular injection of SAG-1-encoding plasmid can induce a specific immune humoral response, sera obtained after DNA injec-tion were tested in an ELISA. As shown in Table I, we detected a specific anti- SAG-1 immunoglobulin response on days 16 (three mice) and 36 (four mice) post-injection. The immunoglobulins detected were
preferentially of class IgG2a. An earlier IgG2a response was observed (for only one mouse) on day 13 post-injection.
Morphometric analysis
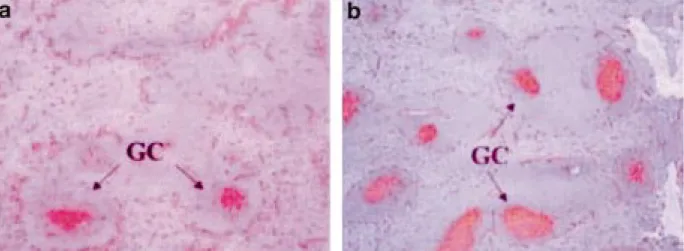
Cryosections were treated with PNA to reveal germinal centres or immunolabelled with anti-CD3 antibodies to reveal the T-dependent zones. As illustrated on Figs. 2a-b, mice injected with coding (b) or non-coding plasmids displayed, 16 days after injection, larger germinal centres than control mice injected with PBS (a). Interestingly, this effect was observed only in the spleen and the aortic lymph nodes and not in the non-draining inguinal lymph nodes.
Fig. 1 - a: Immunostaining of CD3-positive T lymphocytes in splenic cryosections: T cells appear distributed around a central
arteriole (A) in the white pulp (WP). Indian ink (black staining) was present in macrophages (M) distributed through the mar-ginal zone separating the white from the red pulp (RP). (G: 200x). b: Classical hematoxylin/eosin staining of draining lymph node: Indian ink (black staining) appears in cells of the subcapsular marginal sinus (MS) and peritrabecular intermediate sinus-es (IS). (G: 200x).
Table I
Antibody profiles induced by a single intramuscular DNA vaccination. The primary IgG2a and IgG1 responses of mice to intramuscular injection of 100mg of pNIV3452 in PBS. Mice were treated as described in the experimental schedule. Titres are expressed as the reciprocal of the dilution giving a signal 50% of the maximal OD value. The mean ± SE titres of groups of n mice are shown. NS: not significant
Days post-injection
IgG1
IgG2a
6
NS
NS
9
NS
NS
13
NS
34 (n=1)
16
15,6±4,1 (n=3)
19,6±9,29 (n=4)
By morphometric analysis we examined the sig-nificance of these differences observed between mice injected with the coding or non-coding plas-mid and control mice injected with PBS. We studied the chronology of the germinal-centre size increase in the spleen and found the difference to be signifi-cant on day 16 post-injection (P<0.05, Student’s t test). For example, in mice injected with the coding or non-coding plasmid, the germinal centres occu-pied respectively 2.6% and 2.5% of the total section area, as opposed to 0.7%. in control mice (Fig. 3). A few days earlier, (day 13 post-injection), we observed a significant increase in germinal-centre size in the aortic lymph nodes (data not shown). In
the non-draining inguinal lymph nodes, in the oth-er hand, we obsoth-erved no significant increase in size of the germinal centres and no difference between PBS- and plasmid-treated animals.
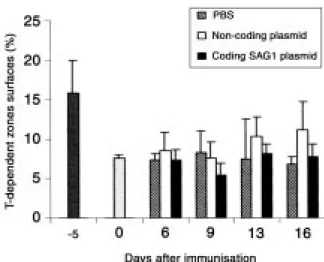
On cryosections immunostained with anti-CD3 antibodies, no significant difference was observed between experimental conditions or between the lymph organs examined (Fig. 4).
Flow cytometry
B- and T-cell populations
After dissection of the spleens, lymphoid cells were isolated and prepared for flow cytometry.
Fig. 2 - Immunostaining of PNA-positive cells in splenic cryosections: 16 days after injection, mice injected with PBS (a)
dis-play fewer and smaller germinal centres (GC) than mice injected with coding or non-coding plasmid (b). (G: 50x).
Fig. 3 - Chronology of the size
increase of spleen germinal cen-tres. Each result is expressed as a percentage representing the proportion of the total section area that is occupied by germi-nal centres.
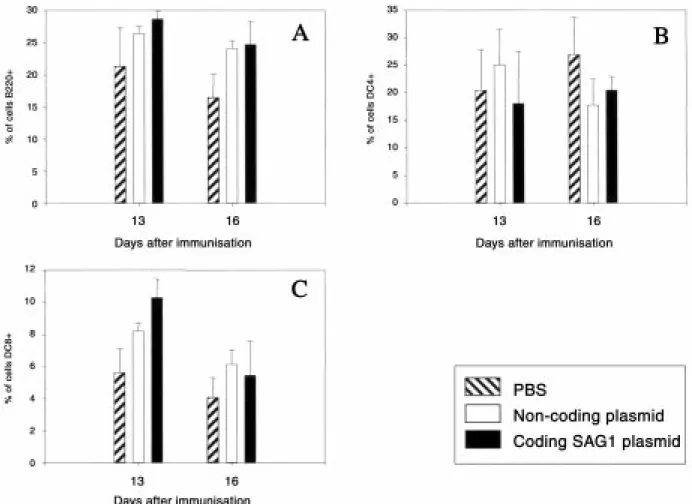
Fig. 6 shows the evolution of various cell popula-tions following injection of the coding or non-cod-ing plasmid or PBS alone. Percentages of these cell populations evolved similarly in all three groups up to day 9 (data not shown).
On day 16, a significant difference appeared in the B220+ cells (Fig. 5A) between mice injected with either plasmid or PBS.
For CD4+ cells, there was no significant differ-ence between mice injected with the SAG-encod-ing plasmid and mice havSAG-encod-ing received the non-coding plasmid (Fig. 5B).
On day 13, the percentage of CD8+ cells was sig-nificantly higher in mice vaccinated with either plasmid than in PBS-injected mice (Fig. 5C).
Again no difference was observed between the two groups of plasmid-injected mice.
By day 36, this difference had disappeared and the cell population percentages were again similar in all three groups (data not shown).
DISCUSSION
We have focused here on the germinal center reaction induced by single intramuscular injection of plasmid DNA encoding the antigen SAG1.
In our experiments, the efficacy of the injection was proved by the presence of SAG1-specific anti-bodies in the sera of mice injected with the plas-mid coding SAG1. A humoral response inducing
secretion of specific antibodies of the IgG2a sub-class was observed 16 and 36 days post-injection.
Intramuscular injection of Indian ink enabled us to recognise the draining organs concerned by this type of injection. Sixteen and 24 hours post-injec-tion, Indian ink was present at the site of injecpost-injec-tion, in the cytoplasm of some myocytes, and in the connective tissue between muscle fibres. More interestingly, it was also present in the sinuses of the draining aortic lymph nodes and in the mar-ginal zone of the spleen. We never observed any staining of the inguinal lymph nodes. Mena and collaborators (2001) have reported that plasmid DNA is very rapidly and widely disseminated throughout the body and allow for the possibility that immune responses could be generated at sites distant from the inoculation. However, in our study only spleen and draining lymph nodes showed a germinal center reaction.
Immunohistochemical observations validated by morphologic analyses offered a new approach for studying the biological mechanisms that underlie the immune response induced by DNA immunisa-tion. The germinal centers are histologically defined structures that support maturation and dif-ferentiation of Ag-activated B cells, principally in T-dependent humoral responses.
We observed on days 13 and 16 after DNA injec-tion, and only in the draining lymph organs (spleen and aortic lymph nodes), a significant increase in germinal-centre size. Our results are in accordance with previous studies using classic antigenic stim-ulation (Pabst and Fritz 1986; Zhang et al., 1988; Hollowood et al., 1992).
Since this effect was present whether a coding or non-coding plasmid was injected, it probably points that this germinal center reaction resulted from an adjuvant effect of the plasmids. Unmethylated CpG basepairs in plasmid DNA have indeed been recog-nised as immunostimulants (Arthur et al., 1998; Dennis et al., 1997). This adjuvant effect may also result from cardiotoxin treatment. Indeed, car-diotoxin used to induce cell alterations in the anteri-or tibial muscles leads to the release of inflammato-ry cytokines and the attraction and/or activation of antigen presenting cells providing optimal condi-tions for effective T cell activation (Sallusto and Lanzavecchia, 1994; Gallucci et al., 2001). The slight increase of the germinal center observed in the controls treated with PBS might result from this
Fig. 4 - Evolution of the T-dependent zone of the spleen. Each
result is expressed as a percentage representing the proportion of the total section area that is occupied by T-dependent zones.
action; it thus also might contribute to the germinal center reaction observed on days 13 and 16 after plasmid injection.
The failure to detect effect of antigen on GC development may imply factors limiting the effi-cacy of DNA immunisation.
The factors limiting DNA immunisation are not fully identified. Dupuis et al. (2000) found that distribution and cellular uptake present significant limitations of DNA stimulation potency. Others groups have shown that factors such as needle type, orientation and speed of injection, volume and type of injection fluid, and preinjection of hypertonic solutions can influence gene expression after intramuscular injection (Manthorpe et al., 1993; Levy et al., 1996). These limitations must be understood before DNA immunisation can be developed to their full potentiel.
The CG changes in the lymph nodes and spleens differed in their time course. These quantitative morphologic findings suggest a difference in the functionel roles of lymph nodes and spleen in the systemic immune response to DNA immunisation. We also measured the T-dependent zone, but did not detected any variation in the size of this area over the span of our experiments. Normally, T cell are critical for GC formation and subsequent B cell selection. It is worth mentioning, however, that area measurements are less accurate in the case of the T-dependent zone than for the germinal centres. The fact that specific IgG2a antibodies were detected after plasmid administration suggests that a T-dependent antigenic response was initiated, and thus that cells were activated inside the T-dependent zone.
Fig. 5 - Evolution, as monitored by flow cytometry on days 13 and 16, of splenic lymphoid cells expressing the CD4, CD8, or
B220 marker after injection with PBS or with a plasmid. A: B220+ cells; B: CD4+ cells; C: CD8 cells. Means and standard devi-ations are indicated (n=4 for each experimental protocol).
REFERENCES
Arthur M.K., Ae-Kyung Y., Joachim S., and Davis L.H.: The role of CpG dinucleotides in DNA vaccines. Trends in micro-biology 6, 23-26, 1998.
Butcher E.C., Reichert R.A., Coffman R.L., Nottenburg C., and Weissman I.L.: Surface phenotype and migratory capabil-ity of Peyer’s patch germinal center cells. Adv. Exp. Med. Biol. 149, 765-772, 1982.
Dennis M.K., Galina Y., and Yoshiaki, I.: Contribution of CpG motifs to the immunogenicity of DNA vaccines. J. Immunol. 158, 3635-3639, 1997.
Donnelly J.J., Ulmer J.B., Shiver J.W., and Liu M.A.: DNA vaccines. Annu. Rev. Immuno. 115, 617-648, 1997.
Dupuis M., Denis-Mize K., Woo C., Goldbeck C., Selby M.J., Chen M., Otten G.R., Ulmer J.B., Donnelly J.J., Ott G., and McDonald D.M.: Distribution of DNA vaccines determines their immunogenicity after intramuscular injection in mice. J. Immunol. 165(5), 2850-2858, 2000.
Heinen, E.: Germinal center In encyclopedia of life sciences. Nature, Scientific American, London, http:www.els.net, 1999. Hollowood K., and Macartney J.: Cell kinetics of the germi-nal center reaction—a stathmokinetic study. Eur. J. Immunol.
22, 261-266, 1992.
Gallucci S., and Matzinger P.: Danger: Signals: SOS to the immune system. Curr.opin. Immunol. 13, 114-119, 2001. Kelsoe, G: Life and death in germinal centers (redux). Immu-nity 4, 107-111, 1996.
Levy M.Y., Barron L.G., Meyer K.B., and Szoka F.C.: Char-acterization of plasmid DNA transfer into mouse skeletal muscle: evaluation of uptake mechanism, expression and secretion of gene products into blood. Gene Ther. 3(3), 201-211, 1996.
MacLennan I.C: Germinal centers. Annu. Rev. Immunol. 12, 117-139, 1994.
Manthorpe M., Cornefert-Jensen F., Hartikka J., Felgner J., Rundell A., Margalith M., and Dwarki V.: Gene therapy by intramuscular injection of plasmid DNA: studies on firefly luciferase gene expression in mice. Hum. Gene. Ther. 4(4), 419-431, 1993.
McHeyzer-Williams L.J., Driver D.J., and McHeyzer-Williams M.G.: Germinal center reaction. Curr. Opin. Hematol. 8, 52-59, 2001.
Mena A., Andrew M.E., and Coupar E.H.: Rapid dissemina-tion of intramuscularly inoculated DNA vaccines. Immunol. Cell Biol. 79, 87-89, 2001.
Pabst R., and Fritz F.J.: Comparison of lymphocyte produc-tion in lymphoid organs and their compartments using the metaphase-arrest technique. Cell. Tissue Res. 245(2), 423-430, 1986.
Sallusto F., and Lanzavecchia A.: Efficient presentation of soluble antigen by cultured human dendritic cells is
main-tained by granulocyte/ macrophage colony-stimulating factor plus interleukine-4 and downregulated by tumor necrosis fac-tor-a. J. Exp. Med. 179, 1109-1118, 1994.
Zhang J., MacLennan I.C., Liu Y.J., and Lane P.J.: Is rapid proliferation in B centroblasts linked to somatic mutation in memory B cell clones? Immunol. Lett. 18(4), 297-299, 1988.