14th European Conference on Mixing Warszawa, 10-13 September 2012
DEVELOPMENT OF OPTICAL TRAJECTOGRAPHY DEVICE FOR
THE LAGRANGIAN STUDY OF THE TURBULENT FLOW INSIDE A
STIRRED TANK USED IN PHARMACEUTICAL INDUSTRY
Collignon M.-L.,a,c, Delafosse A.,a,c, Delvigne F., b,c, Crine M., a,c, Thonart P., b, Toye D., aa
Chemical Engineering Laboratory, Liege University, Allée de la chimie 3, 4000 Liège, Belgium.
b
Walloon Center of Industrial Biology, Liege University, Passage des déportés 2, 5030 Gembloux, Belgium
c
F.R.S-FNRS, rue d’Egmont 5, 1000 Bruxelles, Belgium
mlcollignon@ulg.ac.be
Abstract. Stirred tanks are devices that are widely used in various process steps of the pharmaceutical industry. The performance of these processes (animal cell culture, crystallization, flocculation …) strongly depend on the physico-chemical and hydrodynamic environment present locally in these tanks. To fully describe this local environment, an Eulerian - Lagrangian approach must be adopted in order to establish history of conditions met by a particle as a cell, a crystal or a floc. This approach implies to determine the trajectory followed by the particle. To this aim, the Chemical Laboratory of Liege University has developed a prototype of optical trajectography device. The objective of this paper is to present the device, developments that were necessary for its use and the results obtained. The device is composed of two cameras modeled by a pinhole model which record the position of a bead that has a size equal to 490 µm and that perfectly follows local flow structures. The measured trajectory has been validated by comparing average time velocity fields deduced from it to those measured, in the same operating conditions, by particle image velocimetry (P.I.V.).
Keywords: Optical trajectography, stirred tank, Lagrangian tracking.
1. INTRODUCTION
Stirred tanks are devices that are widely used in various process steps of the pharmaceutical industry. The performance of these processes (animal cell culture, crystallization, flocculation …) strongly depends on the physico-chemical and hydrodynamic environment present locally in these tanks [1] [2] [3]. The classical approach which consists in describing the local environment by an Eulerian approach is not sufficient to predict the impact of agitation conditions on process performances. Indeed, this kind of approach gives access to the spatial distribution of quantities such as fluid velocity, turbulent kinetic energy dissipation rate or concentration which is important information, but it does not give any information on the temporal succession of local physico-chemical and hydrodynamic conditions met by a particle (cell, crystal, floc) and on the time spent by this particle in each condition, whereas this information is also crucial. This kind of information can only be determined by an Eulerian - Lagrangian approach which consists in describing the trajectory followed by the particle and superimposing it on Eulerian fields in order to establish the history of conditions met by the particle.
Reliably determine the trajectory followed by the particle is not an easy task. It may be obtained from the numerical simulation of the flow but the structure of the simulated trajectory depends on the kind of the model used to describe the turbulence and the model’s hypotheses [4]. To avoid this problem, another approach is to experimentally measure the trajectory. Devices that allow this measurement are scarce and are all prototypes. Examples are the Position Emission Particle Tracking device (PEPT) [5] or the Computed Automated Radioactive Particle Tracking device (CARPT) [6]. To be able to measure the trajectory followed by a particle, the Chemical Laboratory of Liege University has developed, in collaboration with the Walloon Center of Industrial Biology, its own prototype of optical trajectography device. The objective of this paper is to present the device, developments that were necessary for its use and the results obtained.
2. DEVELOPMENT OF THE OPTICAL TRAJECTOGRAPHY DEVICE
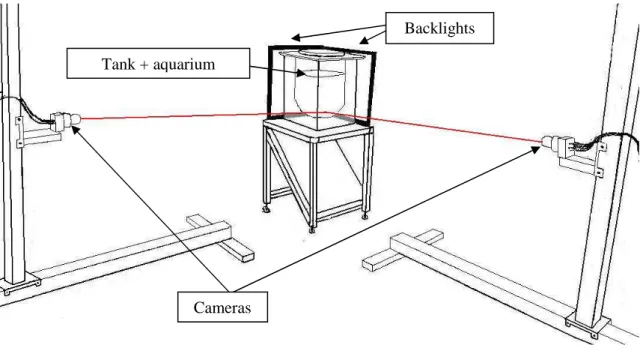
The optical trajectography device is composed of two cameras (Falcon 4M60, Dalsa, 2352×1728 pixels²) with perpendicular optical axes recording images at a 60 Hz frequency and of two backlights panels (Phlox), disposed on the opposite side of the tank relative to the cameras and which generate a white background on recorded images (Figure 1). The tracked particle is spherical. It is made of calcium alginate gel in which active carbon is encapsulated to get a black color, facilitating its detection on images. Paraffin oil is also encapsulated in the particle to adjust its density. The particle diameter equals 490 µm, which corresponds to the smallest object size detectable by cameras. Its density equals 1028 kg m-3. When it moves inside the turbulent flow generated inside a 20 liter cylindrical tank mixed by an axial impeller (TTP, Mixel), the particle Stoke number is significantly smaller than 0.1. It thus perfectly follows local flow structures provided their characteristic size is larger than 490 µm.
Figure 1 : Schematic diagram of the optical trajectography device
To determine the trajectory followed by the particle, it is necessary to establish the mathematical expression which relates the position of the particle on recorded images (in pixels) to its positions in the space (in meters). This is performed by adjusting the parameters of a pinhole model, describing the relative positions of the cameras in the space and the image distortion due to cameras lenses. The pinhole model links to each image pixel a set of points that are aligned along a straight line in the 3D space. The position (X,Y,Z) of the particle is determined by computing the intersection of the two straight lines obtained from the pinhole model of each camera and from the particle position in pixel in each image. Light rays
Backlights
Cameras Tank + aquarium
undergoing refraction at interfaces between materials that compound the tank and the rectangular aquarium surrounding it, a correction on their position and orientation must be applied before computing their intersection in order to determine the particle position in the space.
To efficiently manage the size of data files, images are analyzed on-line during their acquisition by a software program which selectively records the position of pixel groups the size and the color of which suggest they might be the particle. As several objects are detected on each image, an algorithm has been developed to identify the particle among these objects. Objects localized outside the tank are firstly eliminated. Remaining objects are then analyzed on the basis of kinematic considerations. Indeed, knowing the positions, velocities and accelerations of the particle on previous time steps, it is possible to reliably predict its position in the next time step. The selected object at this time step is the one which is the closest to this predicted position. The trajectory of the particle is therefore built step by step.
3. VALIDATION OF THE MEASURED TRAJECTORY
The measured trajectory has been validated by comparing average time velocity fields deduced from it to those measured, in the same operating conditions, by particle image velocimetry (P.I.V.). Indeed, the instantaneous velocity of the particle may be computed knowing its position during time. The average time velocity field may then be established by dividing the tank into small volume (2 mm³) with a size similar to P.I.V. spatial resolution and by computing the average velocity of the particle in each zone from its instantaneous velocities measured when it visits these zones.
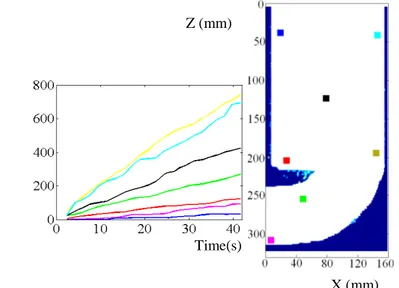
As shown on Figure 2, a very good agreement is observed provided the trajectory acquisition time is large enough. Indeed, as illustrated on figure 3, some zones of the tank are frequently visited because the number of visits rises rapidly with time. It is not the case of ome other zones. Therefore, acquisition time as long as 40 hours is required to allow the particle to perform a large number of visits (more than 30) in all zones of the tank and thus to obtain converged results in the whole tank.
Figure 2 : Axial profile of the time velocity (m s-1) generated by the propeller TTP at 50 rpm measured by P.I.V. (red) or computed from the trajectory (blue) measured during 40 hours.
Figure 3 : Number of visits of the particle in zones that are indicated by color dots on the right figure according to the time (hours).
r=0.4 D D=300 mm Z (mm) Time(s) Z (mm) X (mm)
4. CONCLUSION
The prototype of optical trajectography device elaborated by the Chemical Laboratory of Liege University is nowadays fully operational and the measured trajectories have been validated.
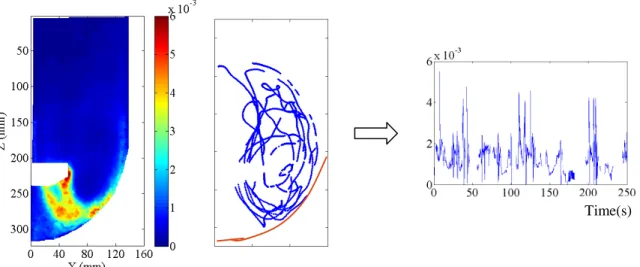
They may then be superimposed on an Eulerian field, the turbulent kinetic dissipation rate measured by P.I.V, for instance, to study the temporal succession of local hydrodynamic conditions met by the particle as a function of agitation conditions (figure 4). As shown on Figure 4, the result obtained is a signal that strongly fluctuates with time. It can be analyzed by classical tools of signal processing to determine for instance at which frequency the particle is subjected to a given level of turbulent kinetic dissipation rate and the time the particle spends at this condition at each visit.
Figure 4: The superposition of the trajectory on an Eulerian field as the turbulent kinetic dissipation rate (J/kg) (measured by P.IV. when the propeller TTP turns at 50 rpm) allows to determine the temporal succession of local hydrodynamic conditions met by the particle.
ACKNOWLEDGMENT
We acknowledge the financial support provided by the FRS-FNRS (National Fund for Scientific Research of Belgium) via the research program FRFC n°2.4.579.09.F.
REFERENCES
[1] Henzler H.J., 2000. “Particle stress in bioreactors”, Adv. Bio. Eng. Biotech., 67, 35-82. [2] Elias C.B., Desai R.B., Patole M. S., Joshi J.B., Mashelkar R.A., 1995. “Turbulent shear stress- effect on mammalian cell culture and measurement using laser doopler anemometer”.
Chem. Eng. Sc., 50, 2431-2440.
[3] Gadge R.S., Patwardhan A.W., Sawant S.B., Joshi, J.B., 2005. “Effects of the flow pattern on cellulase desactivation in stirred tank bioreactors”, Chem. Eng. Sc., 60, 1067-1083. [4] Delafosse A., 2008. Analyse et étude numérique des effets du mélange dans un
bioréacteur, Phd Thesis, INSA, Toulouse, France.
[5] Barigou M., 2004. “Particle tracking in opaque mixing systems: overview of the capabilities of PET and PEPT” , ChERD, 82, 1258-1267.
[6] Rammohan A.R., Kemoun A., Dahhan M. H., Dudukovic M.P., 2001. “A lagrangian description of flows in stirred tanks via computer-automated radioactive particle tracking (CARPT)”, Chem. Eng. Sc., 56, 2629-2636.