Analysis of atmospheric ammonia concentration from four sites in Quebec
City region over 2010-2013
A. D. Larios ad, F. Chebanaa*, S. Godboutb, S. K. Brara, F. Valerad, J. H. Palaciosb, A. Avalos Ramirezac, F. Sandoval-Salasad, J.P. Laroucheb, D. Medina-Hernándezd, Lise Potvinb
a
Institut National de la Recherche Scientifique (INRS), Centre Eau, Terre & Environnement. 490, rue de la Couronne, Québec (QC), G1K 9A9, Canada.
b
Institut de Recherche et de Développement en Agroenvironnement (IRDA). 2700 rue Einstein, Québec (QC), GIP 3W8, Canada.
c
Centre National en Électrochimie et en Technologies Environnementales (CNETE). 2263, av. du Collège, Shawinigan (QC), G9N 6V8, Canada.
d
Instituto Tecnológico Superior de Perote. Km 2.5. Carretera Perote- México. Perote (Ver), 91270, México.
* Correspondence:
Dr. Fateh Chebana, Professor,
Telephone: + 418 654-2542; Fax: + 418 654 2600,
2 Highlights
• The annual average of NH3 concentration was higher than 1μg/m3 in three of the
evaluated sites.
• The evaluation of impacts on sensible vegetation close to urban and agricultural sites is suggested.
• The atmospheric NH3 concentration from four sites in Quebec City region did not
3
Abstract
This study presents an analysis of atmospheric ammonia (NH3) concentration from four
different sites located in the Portneuf municipality and Quebec City over 2010 to 2013 years. The determination of NH3 concentration was performed using passive samplers. Seasonal
Mann-Kendall test at 5% significance level was used to analyse the trend in each of the sites. Results showed slight increases and decreases in NH3 concentration, but the trend was not
significant (α=0.05) from 2010 to 2013 in all the evaluated sites. The annual average concentration of the evaluated sites fluctuated from 0.35 to 17.51μg/m3. Thus, due to that the annual average concentration of NH3 in sites 1 to 3 was higher than 1μg/m3, which is
considered as the critical value for protecting of sensible vegetation close to emission source of NH3. It is suggested to extend the measurements for a longer period and increase the
number of sites in order to follow the trends of atmospheric NH3 concentration at local and
regional scale and have information about the NH3 concentration trend in Quebec.
Keywords: Ammonia concentration, Trend analysis, Seasonal Mann-Kendall test, critical
4
1. Introduction
The concentration of ammonia (NH3) in the atmosphere presents significant spatial
and temporal variations depending on the type of land use, anthropogenic activities, seasonal changes associated with the variation of air temperature, wind patterns, radiation, humidity, pH and roughness of the surface receptors. In rural areas, these variations are also linked with agricultural practices, such as manure spreading operation and changes in population size of animals (Bittman et al., 2015; Thöni et al., 2004).
Agriculture, including animal feedlot operations, is considered as the largest emission source of NH3 with 80.6% of the global anthropogenic emissions followed by 11%
from biomass burning and 8.3% from the energy sector, including industries and traffic (Behera et al., 2013). In Canada, NH3 emissions in 2014 were 22% higher than
in 1990 (Canada, 2017a). In 2014, agriculture was the main emission source accounting 93% of the total NH3 emissions followed by industrial activities and
transport, representing 3% and 2% respectively. Alberta, Saskatchewan, Ontario, and Quebec emitted the highest amounts of NH3 in Canada in 2014, contributing 30%,
20%, 18% and 14% of emissions respectively. For all provinces, the increase of NH3
emissions was mainly attributed to agricultural fertilizer use and larger livestock populations (Canada, 2017a). In urban areas, NH3 concentration is associated with the
local traffic, urban industries, waste containers, sewerage systems or air mass arriving from agricultural sources (Krupa, 2003). It is known that the chemical reaction of NH3
with nitrogen oxides (NO𝑥) and sulfur dioxide (SO2) in the atmosphere results in
ammonium nitrate and ammonium sulphate formation which causes visibility degradation. Due to these problems, the inventory of NH3 emissions and concentration
5 In the case of forest areas, they can play the role of emission sources or sinks of atmospheric NH3. This role depends on the gradient of NH3 concentration between the
canopy and the atmosphere (Hansen et al., 2013; Massad et al., 2010). NH3 emissions
are issued from forest areas during forest clearing; organic matter decomposition from soil or when the atmospheric concentration of NH3 is lower than the canopy
compensation point. Conversely, forest areas assimilate NH3 when the atmospheric
concentration is higher than the canopy compensation point. Canopy compensation point is the concentration which the plants neither gain nor lose NH3 (Behera et al.,
2013).
Although, advanced satellite instruments in orbit are used to measure NH3 concentration.
It is considered that the integration of satellite measurements with ground-based measurements will enable better assessments and understanding of local to global atmospheric NH3 and information on its spatial distribution through the long-term
trend analysis (Van Damme et al., 2014; Yao and Zhang, 2013). Seasonal Mann-Kendall trend test (SMK), as extension of the Mann-Mann-Kendall test, is widely used to analyse climatologic, hydrologic and atmospheric trends on a time series when seasonal cycles are present in the data. It is a non-parametric test to detect time-serial trends without requiring a normal data distribution. Furthermore, SMK test may even be used although there are missing or tied values(Gilbert, 1987; McLeod et al., 1991). In this context, the Research and Development Institute for the Agri-environment (IRDA, Quebec City) created a database of NH3 concentration over the years 2010 to
2013 from four different sites located in the Portneuf municipality and Quebec City. This work presents the results of the measurement and the analysis of atmospheric NH3 concentration trends in order to evaluate the temporal behavior of NH3
6
2. Materials and methods
The concentration was monitored monthly for four years using passive samplers (PS). The PS were 12 mm long with an internal diameter of 20 mm. The ensemble of samplers and the measurement method was similar to that reported by Martin and Rodhe (1997) and Dammgen (2007). Fluoropore membrane filters (PTFE) (Millipore, Fisher Scientific, Quebec, QC) of 25 mm diameter and pores of 1μm; regenerated cellulose membrane filters type 184 (Sartorius Stedim, Fisher Scientific, Quebec, QC) of 25mm diameter and pores of 0.45μm were used to construct the samplers. The cellulose filters were impregnated with 50µL of citric acid solution (2%) and placed in the desiccator with its top cover assembly for 15 minutes. In each sampler, a PTFE membrane was placed between the two stainless steel grids in front of the filter to protect the cellulose filter, to damp the effects of the swirling air and to promote molecular diffusion (Dammgen, 2007). Before and after sampling, the passive samplers were transported in polypropylene tubes (four passive samplers per tube). A filter paper soaked with the solution of citric acid was placed inside each tube as a preventive measure to a possible absorption of ammonia during the transport. Four passive samplers were inserted in a support connected to a holder at 2 m above the ground. At the end of the sampling period (1 month), the samplers were recovered and placed in the same tube used for transport. The sample size for each site comprised 48 measurements. In the laboratory, the cellulose filters were removed from the samplers and eluted with 5 ml of distilled water followed by continuous shaking for 60 min. Afterwards, the extracted solution was filtered by microfiltration (0.45μm) and the ammonium nitrogen (N-NH4+) content was analysed in a flow injection analyser
(QuikChem FIA+, ATS scientific INC, Burlington, ON., Canada). Later, the atmospheric NH3 concentration was calculated according to Dammgen (2007). Two
7 cellulose filters impregnated with25µL and 50µL of standard solution N-NH4+ (100
ppm) were used as positive controls. Also, two cellulose filters without standard solution of N-NH4+ were used as negative controls during N-NH4+ analysis. The
detection and quantification limit of the analyser was around 0.012 and 0.041 mg/L, respectively. Detection and quantification limits correspond to 0.06 and 0.22μg/m3 of NH3 that can be detected and determined with an acceptable level of repeatability
precision and trueness (α≤0.05). These values were lower than the average of NH3
concentration measured in the filters blanks which were around 0.82μg/m3. Thus, taking into account these values, the performance of the instrument and measuring method was considered as acceptable. To calculate the monthly NH3 concentration in
each one of the evaluated sites, the concentration detected in the filters blanks was subtracted to the concentration measured in each one of the samples. After subtraction of the blank value, all the negative values were not considered for data analysis. Thus,
the values presented in this study were considered as NH3 concentration
representatives of each evaluated site.
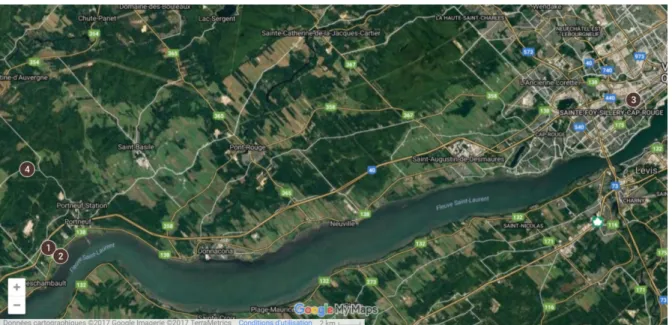
Site 1, 2 and 4 were located in the Portneuf municipality to the southwest of Quebec City (Figure 1). Site 1 was placed in a prairie of the municipality of Deschambault close to crops and grazing fields at 46.6784° of latitude north (N) and -71.9240° of longitude west (W). Site 2 was also located in Deschambault close to animal housings and grassland at 46.6713°N and -71.9104W. Site 3 was located in the urban zone of Quebec City at 46.7928°N and -71.2608W. Site 4 was placed in the middle of a private forest in St-Gilbert at 46.7388°N and -71.9483 W. For the analysis of the database of the measured monthly NH3 concentrations and of a database of fine
particles ≤ 2.5 μm in aerodynamic diameter (PM25) from the National Air Pollution Surveillance Program (NAPS) (Canada, 2017c), locally weighted scatterplot
8
smoothing (lowess) curves were made to summarize the relationship of NH3
concentration or PM25 and time. After plotting the data, seasonal Mann-Kendall
(SMK) test was applied to analyse the trend of NH3 concentrations and PM25 in order
to contrast the null hypothesis (H0) which defines that for each of the m seasons the n
observations are independent and identically distributed while the alternative hypothesis (H1) establishes that there is a monotonic trend. SMK test is an extension
of the Mann-Kendall test. In SMK, the data were organized in the order in which they were collected over time. The corresponding statistic Z was calculated according to Gilbert (1987) by using R statistical software version 3.1.3 for Windows (Pohlert, 2017). The criterion to reject H0 was “if the absolute value of Z is greater than the
critical value Z1-α/2 evaluated at the α level of significance of 5% there is no evidence that there is not trend”, whereas the alternative hypothesis (H1) established that there is
an upward or downward trend (a two-tailed test). A positive or negative value of Z indicates an upward or downward trend respectively (Gilbert, 1987; Klenova et al., 2009; Pohlert, 2016). Thedata from NAPS from 2010 to 2011 were only analyzed for an urban site localized in Quebec City (2.5 km from the urban site 3 of this study). Afterwards, a scatter plot of NH3 concentrations versus temperature was drawn for
each site to analyze the relationship between these two variables. Data of temperature were obtained from two meteorological stations located in Deschambault and Québec City for the period of 2010-2013 (Canada, 2017b).
3. Results and discussion
3.1 Behavior of NH3 concentration in four sites of Quebec City
The monthly NH3 concentration (Figure 2) showed a seasonal variation during the
sampling period with higher and lower values in summer and winter, respectively. Seasonal variations are caused by changes in the temperature along of year (Hu et al.,
9 2014). Figure 2 shows that the highest concentration was registered at site 2, which were from 2 to 56μg/m3. The highest concentration was registered during the summer of 2010 and 2011. The increase was caused by the presence of cows grazing close to the sampling point in summer 2010 and by the placement of tanks filled with hen manure close to the building where the passive samplers were placed in summer 2011. In the case of site 1, the highest concentration was registered in October 2010 and October 2011. This was attributed to manure application during the sampling period, which is in accord with NH3 emissions from agricultural lands and livestock sites as
reported by Thöni et al. (2004). Figure 2 also shows that lowest concentration was registered in site 4, which corresponded to a forest area. The NH3 concentration in this
site was in the range from 0.1 to 1.3μg/m3,while in site 3 the concentration was from 0.5 to 3.5μg/m3
. These levels are similar to NH3 concentration reported for forest and
urban sites (Dammgen, 2007). Table 1 presents the annual average of NH3
concentration and temperature for each site. It shows that the annual average concentration of NH3 was higher than 1μg/m3 in all the sites, with exception of site 4.
According to Table 1, in 2011 in all the sites the concentration decreased with respect to 2010. After 2011, NH3 concentration was nearby from 2012 to 2013 forall the sites,
with the exception of site 4 which showed a progressive increase. This behavior could be attributed to the effect of weather conditions and specific events which occurred in each site, as discussed later. According to Cape et al. (2009), an annual average value of NH3 concentration higher than 1μg/m3 was proposed as critical level (CLE) for
protecting of sensible vegetation such as lichens and mosses and a CLE value higher than 3μg/m3 for protecting other vegetation. Also, von Bobrutzki et al. (2012) identified visible impacts of NH3 to pine trees and sensitive species such as Vaccinium
10 sites 1-3, and higher than 4μg/m3 for site 2, it is recommended to analyse the effect of NH3 dispersion over these species in urban and agricultural areas located downwind of
emission sources. 3.2. Trend analysis
Seasonal Mann-Kendall (SMK) test was carried out to evaluate the trend of NH3
concentrations. Table 2 shows the statistic values from SMK for each one of the evaluated sites. Taking into account the results shown in Table 2, the Z value indicated that NH3 concentration on site 1 remains unchanged while for site 2, a slight
decrease was identified. In the case of site 3 and site 4, a slight increase can be observed. However, as absolute values of the statistic Z were low and the p-value was higher than 0.05 for each site, it can be concluded that the trend of NH3 concentration
was not significant at a level lesser than α=0.05 which is usually considered in the SMKT. Thus, for the null hypothesis, no trend was accepted for all the sites and for the alternative hypothesis, there is a significant trend which was rejected. The annual average concentration of NH3 was higher than 1μg/m3 in all the sites, with exception
of site 4. It will be advisable to continue the compilation of the database at a longer time (6-10 years) as suggested in the literature (Waldner et al., 2014) to better
elucidate the trend of NH3 concentration in Quebec City and the Portneuf
municipality.
In order to display the variations between seasons (months), the statistical values from SMK test for individual seasons are presented in Table 3. In the case of site 1 and 2, the Z values pattern through the seasons in the year can be attributed to the particular cultural operations and eventual activities presented in 2010-2011. For example, on site 2, the NH3 concentration in 2010-2011 was higher in comparison to other years
11 deposited on the grassland, it promotes the release of NH3. Further, the higher
temperature recorded in summer 2010 could be associated with the NH3 concentrations
achieved at this point. Thus, the high values obtained on 2010-2011 due to eventual activities could influence the obtained values with respect to other years and to produce negative Z values. On the other hand, in sites 3 and 4, the behavior through the seasons in the year was more systematic. For example, in site 4, the variation in all seasons except in season 6 (June) presented positive Z values showing a slight increase in NH3 concentration. However, similar to the results obtained from the
complete SMK test, the obtained absolute values of Z in each of the seasons was lower and the p-value was higher than 0.05 in all the sites.
NH3 concentration presents a temperature dependence linked to the chemical and
biological processes occurring in the emission sources. The relationship between NH3
concentration and temperature during 2010-2013 was evaluated. The corresponding results are shown in Figure 3. It can be seen that an increase in temperature produced a corresponding increase in the NH3 concentration. However, eventual activities
presented during the evaluated period and other factors could affect the emission and concentration of NH3 in the evaluated sites. Thus, a linear relationship between NH3
concentration and temperature cannot be completely established due to variations in the correlation coefficient (R2) values which were lower as shown in Table 4.
According to the national pollutant release inventory (NPRI) of Canada (2015), emissions of NH3 as well as fine particle matter < 2.5 microns (PM2.5) have increased
gradually since 1990 in the province of Quebec. However, due to the number of sampled sites and the evaluated period in this study, these results cannot be compared at regional or national scale. In the case of local scale, the database reported by the Institute of Statistics of Québec is available only until 2010 (ISQ, 2017). Thus, the
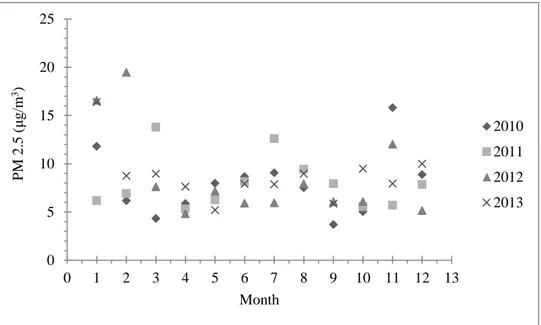
12 only local database available to compare results from the present study was the database from fine particulate matter < 2.5 microns (PM2.5) obtained from the National Air Pollution Surveillance Program (NAPS) (Canada, 2017c) which includes an urban site placed at 2.5 km of site 3 (urban site in this study). PM2.5 concentration
from 2010 to 2013 is presented in Figure 4. PM2.5 concentration in this reference site
was from 3.7 to 19.5μg/m3. The annual PM2.5 concentration was 7.9, 8.0, 8.7 and
8.7μg/m3 from 2010 to 2013, respectively. These values were in the standard concentration established by theCanadian Ambient Air Quality Standards (CAAQS). Also, the SMK test was applied and results are presented in Table 5. It can be seen that similar to this study, the trend of PM2.5 in this urban site from 2010 to 2013 was
not significant at an α level of 0.05. Thus, to understand the behavior of NH3 and
PM2.5 concentration at the local and regional scale of Quebec, a higher number of sites
need to be evaluated for a longer period mainly close to emission sources. 4. Conclusion
The trends of NH3 concentration in air from four sites in Quebec City were analysed
using experimental data obtained by passive sampling and statistical analysis. Results from seasonal Mann-Kendall test showed a not significant trend for all evaluated sites, indicating slight decreases and increases of NH3 concentration over 2010-2013 years.
For sites 1 and 3, the annual average concentration of NH3 was higher than 1μg/m3,
which is considered as the critical value for protecting of sensible vegetation close to emission source of NH3, and for site 2 it was higher than 3μg/m3, which is considered
critical for all kind of vegetation. This suggests extending the measurement of NH3
concentration to other sites and to correlate it with other variables in order to analyse carefully the trend of atmospheric concentration of NH3 in a longer period of time in
13
5. Acknowledgements
The authors are grateful to the editor and the reviewers for their valuable time in providing comments and suggestions. Our sincere thanks go to the general direction of the IRDA by the internal funding to carry out the field measurement. The main author would like to thank the Program for the Professional development of Professors (Prodep-Mexico) for the grant to perform the research stage.
6. References
Behera, S.N., Sharma, M., Aneja, V.P. and Balasubramanian, R., 2013. Ammonia in the atmosphere: a review on emission sources, atmospheric chemistry and deposition on terrestrial bodies. Environmental Science and Pollution Research, 20(11): 8092-8131.
Bittman, S. et al., 2015. Weekly agricultural emissions and ambient concentrations of ammonia: Validation of an emission inventory. Atmospheric Environment, 113: 108-117.
Canada, E.a.C.C., 2015. Summary Report: Reviewed Facility-Reported Data https://www.ec.gc.ca/inrp-npri/386BAB5A-774E-4C76-AAB1-3C219B96B4A5/2015_SummaryReport-Final%20Jan23%20-%20ENG.pdf. Canada, E.a.C.C., 2017a. Canadian Environmental Sustainability Indicators: Air pollutant emissions. Environment and
Climate Change Canada
Canada, G.o., 2017b. Historical Data, 2010-2013. Government of Canada,
http://climate.weather.gc.ca/historical_data/search_historic_data_e.html.
Canada, G.o., 2017c. National Air Pollution Surveillance Program (NAPS). Environment and climate change Canada,
http://maps-cartes.ec.gc.ca/rnspa-naps/data.aspx?lang=en.
Cape, J.N., van der Eerden, L.J., Sheppard, L.J., Leith, I.D. and Sutton, M.A., 2009. Evidence for changing the critical level for ammonia. Environmental Pollution, 157(3): 1033-1037.
Dammgen, U., 2007. Atmospheric nitrogen dynamics in Hesse, Germany: Creating the data base 3. Monitoring of atmospheric concentrations of ammonia using passive samplers. Landbauforschung Volkenrode, 57(3): 247. Gilbert, R.O., 1987. Tends and Seasonality. In: P.N. Laboratory (Editor), Statistical methods for environmental pollution
monitoring. Van Nostrand Reinhold Company Inc, pp. 238-240.
Hansen, K. et al., 2013. Ammonia emissions from deciduous forest after leaf fall. Biogeosciences, 10(7): 4577-4589. Hu, Q., Zhang, L., Evans, G.J. and Yao, X., 2014. Variability of atmospheric ammonia related to potential emission sources in
downtown Toronto, Canada. Atmospheric Environment, 99: 365-373.
ISQ, 2017. Databank of Official Statistics on Québec, Institut de la statistique du Québec (ISQ).
Jansen, R.C., Chen, J. and Hu, Y., 2014. The impact of nonlocal ammonia on submicron particulate matter and visibility degradation in urban shanghai. Advances in Meteorology, 2014.
Klenova, A.V., Volodin, I.A. and Volodina, E.V., 2009. Examination of pair-duet stability to promote long-term monitoring of the endangered red-crowned crane (Grus japonensis). Journal of Ethology, 27(3): 401-406.
Krupa, S., 2003. Effects of atmospheric ammonia (NH 3) on terrestrial vegetation: a review. Environmental pollution, 124(2): 179-221.
Martin, F. and Rodhe, H., 1997. Measurements of air concentrations of SO2, NO2 and NH3 at rural and remote sites in Asia. Journal of Atmospheric Chemistry, 27(1): 17-29.
Massad, R.-S., Nemitz, E. and Sutton, M., 2010. Review and parameterisation of bi-directional ammonia exchange between vegetation and the atmosphere. Atmospheric Chemistry and Physics, 10(21): 10359-10386.
McLeod, A.I., Hipel, K.W. and Bodo, B.A., 1991. Trend analysis methodology for water quality time series. Environmetrics, 2(2): 169-200.
Pohlert, T., 2016. Non-Parametric Trend Tests and Change-Point Detection.
Pohlert, T., 2017. Non-parametric trend tests and change-point detection. CC BY-ND, 4.
Thöni, L., Brang, P., Braun, S., Seitler, E. and Rihm, B., 2004. Ammonia monitoring in Switzerland with passive samplers: patterns, determinants and comparison with modelled concentrations. Environmental Monitoring and Assessment, 98(1-3): 93-107.
Van Damme, M. et al., 2014. Global distributions, time series and error characterization of atmospheric ammonia (NH3) from IASI satellite observations. Atmospheric chemistry and physics, 14(6): 2905-2922.
von Bobrutzki, K. et al., 2012. Ammonia emissions from a broiler farm: spatial variability of airborne concentrations in the vicinity and impact on adjacent woodland. Environmental Monitoring and Assessment, 184(6): 3775-3787. Waldner, P. et al., 2014. Detection of temporal trends in atmospheric deposition of inorganic nitrogen and sulphate to
forests in Europe. Atmospheric Environment, 95: 363-374.
Wang, S. et al., 2015. Atmospheric ammonia and its impacts on regional air quality over the megacity of Shanghai, China. Scientific reports, 5.
14
Yao, X. and Zhang, L., 2013. Analysis of passive-sampler monitored atmospheric ammonia at 74 sites across southern Ontario, Canada. Biogeosciences, 10(12): 7913-7925.
List of figures:
Figure 1 Geographical location of sampling sites (1=Site 1; 2=Site 2; 3=Site 3; 4=Site 4) Figure 2 NH3 concentration from four sites in Quebec City region over 2010-2013
Figure 3 Relationship between NH3 concentration and temperature on 2010-2013 in sites 1-4 Figure 4 Particulate matter PM2.5 concentration from an urban site in Quebec City
Figure 1 Geographical location of sampling sites (1=Site 1; 2=Site 2; 3=Site 3; 4=Site 4)
15 Figure 2 NH3 concentration from four sites in Quebec City region over 2010-2013
16 Figure 3 Relationship between NH3 concentration and temperature on 2010-2013 in sites 1-4
0 2 4 6 8 10 12 14 -20 -10 0 10 20 30 [NH 3 ] ( μg/ m 3) Temperature (°C) Site 1 2010 2011 2012 2013 0 5 10 15 20 25 30 35 40 45 -20 -10 0 10 20 30 [NH 3 ] ( μg/ m 3) Temperature (°C) Site 2 2010 2011 2012 2013 0 0,5 1 1,5 2 2,5 3 -20 -10 0 10 20 30 [NH 3 ] ( μg/ m 3) Temperature (°C) Site 3 2010 2011 2012 2013 0 0,2 0,4 0,6 0,8 1 1,2 -20 -10 0 10 20 30 [NH 3 ] ( μg/ m 3) Temperature (C) Site 4 2010 2011 2012 2013
17 Figure 4 Particulate matter PM2.5(lesser than 2.5μm in aerodynamic diameter)
concentration from an urban site in Quebec City
List of Tables:
Table 1 Annual average of NH3 concentration and weather conditions
Table 2 Seasonal Mann-Kendall tests of atmospheric NH3 concentration from four sites of
Quebec region over 2010-2013
Table 3 Statistics values from SMK test for individual seasons (NH3 concentration)
Table 4 Coefficient regression values (R2) from the relationship between NH3 concentration
and temperature for sites 1 to 4
Table 5 Seasonal Mann-Kendall tests of atmospheric PM2.5 concentration from the database
from a urban sites of Quebec City over 2010-2013 0 5 10 15 20 25 0 1 2 3 4 5 6 7 8 9 10 11 12 13 P M 2. 5 ( μg/ m 3) Month 2010 2011 2012 2013
18 Table 1 Annual average of NH3 concentration and weather conditions
Table 2 Seasonal Mann-Kendall tests of atmospheric NH3 concentration from four sites of
Quebec region over 2010-2013
*at a level lesser than α=0.05
Year NH3 concentration (μg/m3) Temperature (°C)
Site 1 Site 2 Site 3 Site 4 Site 1,2,4 Site 3
2010 2.54 17.51 1.64 0.43 6.62 6.83
2011 2.23 9.79 1.37 0.35 5.18 5.73
2012 1.97 4.52 1.68 0.46 5.73 6.42
2013 1.88 4.99 1.57 0.62 4.74 5.75
Site Seasonal Mann-Kendall
Statistic ( Z)
p-value *Significant trend
1 0.00 1.00 No
2 -1.58 0.11 No
3 0.30 0.77 No
19 Table 3 Statistics values from SMK test for individual seasons (NH3 concentration)
*at a level lesser than α=0.05
Season (month) z Pr(>|z|) Significant trend Season (month) z Pr(>|z|) *Significant trend Site 1 Site 2 1 0.00 1.00 No 1 0.00 1.00 No 2 0.34 0.73 No 2 -0.34 0.73 No 3 0.34 0.73 No 3 0.00 1.00 No 4 -0.34 0.73 No 4 -1.02 0.31 No 5 -0.34 0.73 No 5 0.34 0.73 No 6 -1.70 0.09 No 6 -1.02 0.31 No 7 1.02 0.31 No 7 -1.02 0.31 No 8 0.00 1.00 No 8 -0.34 0.73 No 9 0.00 1.00 No 9 0.00 1.00 No 10 -1.02 0.31 No 10 0.00 1.00 No 11 1.02 0.31 No 11 0.00 1.00 No 12 0.00 1.00 No 12 -0.34 0.73 No Site 3 Site 4 1 0.00 1.00 No 1 0.00 1.00 No 2 0.00 1.00 No 2 0.34 0.73 No 3 0.00 1.00 No 3 0.34 0.73 No 4 -0.34 0.73 No 4 0.00 1.00 No 5 1.70 0.09 No 5 1.02 0.31 No 6 -0.34 0.73 No 6 -0.34 0.73 No 7 -1.02 0.31 No 7 0.00 1.00 No 8 0.00 1.00 No 8 0.00 1.00 No 9 0.34 0.73 No 9 0.34 0.73 No 10 1.02 0.31 No 10 1.02 0.31 No 11 0.34 0.73 No 11 1.02 0.31 No 12 0.00 1.00 No 12 0.34 0.73 No
20 Table 4 Coefficient regression values (R2) from the relationship between NH3 concentration
and temperature for sites 1 to 4
Site R2 values Complete series 2010 2011 2012 2013 1 0.13 0.13 0.12 0.55 0.41 2 0.34 0.79 0.41 0.87 0.66 3 0.72 0.86 0.62 0.90 0.82 4 0.49 0.94 0.36 0.83 0.88
Table 5 Seasonal Mann-Kendall tests of atmospheric PM2.5 concentration from the database
from an urban sites of Quebec City over 2010-2013
*at a level lesser than α=0.05; PM≤ 2.5= particular matter lesser than 2.5μm in aerodynamic diameter
Season (month) z Pr(>|z|) *Significant trend Urban Site 1 0.34 0.73 No 2 1.02 0.31 No 3 0.34 0.73 No 4 0.00 1.00 No 5 -1.02 0.31 No 6 -1.02 0.31 No 7 -0.34 0.73 No 8 0.34 0.73 No 9 0.00 1.00 No 10 1.70 0.09 No 11 -0.34 0.73 No 12 0.00 1.00 No