HAL Id: hal-00835038
https://hal.sorbonne-universite.fr/hal-00835038
Submitted on 17 Jun 2013
HAL is a multi-disciplinary open access
archive for the deposit and dissemination of
sci-entific research documents, whether they are
pub-lished or not. The documents may come from
teaching and research institutions in France or
abroad, or from public or private research centers.
L’archive ouverte pluridisciplinaire HAL, est
destinée au dépôt et à la diffusion de documents
scientifiques de niveau recherche, publiés ou non,
émanant des établissements d’enseignement et de
recherche français ou étrangers, des laboratoires
publics ou privés.
Fathom: A Browser-based Network Measurement
Platform
Mohan Dhawan, Justin Samuel, Renata Teixeira, Christian Kreibich, Mark
Allman, Nicholas Weaver, Vern Paxson
To cite this version:
Mohan Dhawan, Justin Samuel, Renata Teixeira, Christian Kreibich, Mark Allman, et al.. Fathom: A
Browser-based Network Measurement Platform. ACM Internet Measurement Conference, Nov 2012,
Boston, United States. pp.73-86, �10.1145/2398776.2398786�. �hal-00835038�
Fathom: A Browser-based Network Measurement Platform
Mohan Dhawan
∗ Rutgers University[email protected]
Justin Samuel
UC Berkeley[email protected]
Renata Teixeira
_ CNRS & UPMC[email protected]
Christian Kreibich
ICSI & UC San Diego
[email protected]
Mark Allman
ICSI
[email protected]
Nicholas Weaver
ICSI & UC San Diego
[email protected]
Vern Paxson
ICSI & UC Berkeley
[email protected]
ABSTRACT
For analyzing network performance issues, there can be great utility in having the capability to measure directly from the perspective of end systems. Because end systems do not provide any external pro-gramming interface to measurement functionality, obtaining this capability today generally requires installing a custom executable on the system, which can prove prohibitively expensive. In this work we leverage the ubiquity of web browsers to demonstrate the possibilities of browsers themselves offering such a programmable environment. We present Fathom, a Firefox extension that imple-ments a number of measurement primitives that enable websites or other parties to program network measurements using JavaScript. Fathom is lightweight, imposing < 3.2% overhead in page load times for popular web pages, and often provides 1 ms timestamp accuracy. We demonstrate Fathom’s utility with three case studies: providing a JavaScript version of the Netalyzr network characteri-zation tool, debugging web access failures, and enabling web sites to diagnose performance problems of their clients.
Categories and Subject Descriptors
C.2.0 [Computer-Communication Networks]: General; C.4 [Performance of Systems]: Measurement techniques; D.2.8 [Software Engineering]: Metrics—performance measures
General Terms
Design, Measurement, Performance, Security
Keywords
Network troubleshooting, network performance, end-host network measurement, web browser, browser extension
∗This work was done while the author was visiting ICSI.
_This work was done while the author was visiting UC Berkeley
& ICSI.
Permission to make digital or hard copies of all or part of this work for personal or classroom use is granted without fee provided that copies are not made or distributed for profit or commercial advantage and that copies bear this notice and the full citation on the first page. To copy otherwise, to republish, to post on servers or to redistribute to lists, requires prior specific permission and/or a fee.
IMC’12,November 14–16, 2012, Boston, Massachusetts, USA. Copyright 2012 ACM 978-1-4503-XXXX-X/12/11 ...$15.00.
1
Introduction
Network measurements from the perspective of end systems often play a vital role both for researchers who want to develop general insight into how the Internet functions, and for practitioners aim-ing to diagnose individual performance issues. To gain insight into network operation, researchers traditionally either (i) beg acquain-tances to install a custom measurement tool, or (ii) use or instan-tiate infrastructure to conduct the measurements (e.g., PlanetLab). Neither of these options scales to supporting broad measurement of the network’s edge, limiting the scope of the insight we can ob-tain. Practitioners, on the other hand, have less interest in develop-ing general knowledge about networked systems and more interest in understanding the performance of their own systems, including understanding why their users experience suboptimal performance. While systems developed by the research community for general measurement may aid practitioners in small ways, these systems do not run on regular users’ end systems and hence do not offer help with specific measurement or debugging of user problems.
While researchers and practitioners come to the need for mea-surement of user end systems from opposite ends of the spectrum— i.e., one looking for broad, general results, and the other seek-ing specific information—both find obtainseek-ing such measurements problematic due to the lack of general support in end systems. While getting users to install programs can suffice for particular, limited situations, the approach does not scale up: one cannot rely upon users repeatedly conducting such installations as a building block for facilitating measurement. One difficulty in this regard concerns users not wanting to continually undergo the hassle of the process. Another difficulty is the challenge that implementors face in developing portable executables that run correctly across a wide range of system configurations. A third issue is one of safety: such installations, whether for standalone binaries or native code that extends an existing system, generally require privileged access and trust in the behavior of the introduced program.
In this work we aim to overcome these difficulties by minimiz-ing the impediments to writminimiz-ing and installminimiz-ing measurement pro-grams across a large number of end systems. Our vehicle for do-ing so is Fathom, a browser-based extensible measurement plat-form. Fathom provides a measurement-oriented API that standard JavaScript loaded from any web page can tap into to facilitate em-pirical observation.
We argue that building a measurement platform into the web browser hits a sweet spot for both deployability and flexibility, thus providing Fathom with the potential to flourish where other
mea-surement systems have floundered. The ubiquity of web browsers, and the central role they play for a vast array of disparate network activities, provide an unparalleled scaling potential that holds great promise for benefiting common measurement and troubleshooting scenarios (§2). Like other measurement platforms, Fathom re-quires users to install a piece of software, a step that generally presents a significant hurdle to widespread adoption. However, the user only has to do so once to enable a vast range of measure-ments. By bundling useful Fathom applications with the platform itself (most notably, a connectivity debugger that works even in complete absence of connectivity), we provide users an immediate incentive for installation.
We begin by framing desiderata for a browser-based measure-ment platform (§3), which guide both Fathom’s design and its im-plementation. Our design (§4) includes a set of APIs covering a wide range of measurement and troubleshooting applications, sig-nificantly expanding the capabilities of in-page JavaScript code. To ensure safety, we equip Fathom with a security model that balances user approval, permission management, and code-signing (§4.2
and § 4.3). Consideration of possible implementation strategies motivates our decision to implement Fathom as a JavaScript-only extension for the Firefox browser, paying close attention to the constraints imposed by modern-day browser environments (§5). We demonstrate that careful design of a JavaScript-driven mea-surement platform enables experimenters to conduct meamea-surements with modest overhead for the user (§6.1) and high accuracy (§6.2). We report on additional experiences gained using Fathom in three different use cases (§7). We discuss portability and adoption in-centives (§8), and close with a survey of related browser extension work and measurement platforms (§9).
Contributions: Fathom explores the feasibility of building a generic network measurement and troubleshooting platform into modern browsers. We view our contribution as developing a re-alization of broad capability that the community has been working towards for a number of years. Fathom builds on the lessons of previous efforts and reflects a promising, practical approach that (i) fosters innovation via open-endedness, as opposed to implement-ing a particular tool; (ii) provides unparalleled access to the edge via the ubiquity of browsers; (iii) enables novel analyses supported via passive collection of context and active experimentation; (iv) combines existing security primitives in a novel way to safely ex-pand in-page JavaScript capabilities.
Fathom is open source and we invite interested readers to visit http://fathom.icsi.berkeley.edu to download the platform and provide feedback.
2
Motivating Scenarios
We begin by sketching examples of measurement efforts that bene-fit from both an end system vantage point and a large footprint. The list here is far from exhaustive; our design is general, and hence adaptable to a range of other tasks, too.
Web performance debugging: With a browser-based vantage point website operators can significantly improve their ability to diagnose slow load times. Along those lines, Google’s analytics code recently started collecting basic page rendering times [24]. This captures facts, but cannot provide troubleshooting assistance, for which page authors currently lack critical information. The web pages’ isolation from the host system here works against the developer, preventing access to helpful indicators such as system load and I/O characteristics. For example, the Google Maps fo-rum [19] shows discussions whereby Google engineers explicitly ask users to quantify the “slowness” of page loads, including an-cillary system-level information such as CPU and network activity.
By allowing Google engineers access to a measurement platform in the user’s browser they could directly extract the required in-formation. Researchers can also leverage this capability to better understand web performance and complexity (e.g., [7,10]) both at scale and across sites.
Web access failures: Similar to the performance debugging case, a browser-based platform can also directly assist users in diagnos-ing website failures. In this scenario, the browser could provide a “diagnose” button that launches measurements to identify common causes of access failures (e.g., loss of connectivity or DNS issues). While web failures have been studied in a passive fashion [1,42], giving users a way to conduct real-time assessment offers the po-tential to both (i) better diagnose the problem with contemporane-ous active measurements and (ii) inform users what might be done to fix the problem (or at least who to ask to fix the problem). Local network debugging: Poor performance can also stem from issues in the local network and hence combining external- and local-network measurements can help pinpoint the location of the problem [10]. Further, when multiple local systems use the mea-surement platform we can discover this—e.g., using multicast DNS or UPnP—and coordinate the vantage points for a richer analysis of the failure.
ISP performance: A wide range of tools perform active measure-ments from end systems to a controlled server, including speed tests [4], general performance diagnostics [20,28,31], traffic tam-pering [46], and traffic shaping detectors [12,25]. While each of these tools performs custom tests, they share the basic need to con-duct active probing from end systems.
Large-scale topology mapping: Many efforts within the research community over the years have tried to understand the Internet’s topology by conducting traceroute(-like) measurements from mul-tiple vantage points [8,44,47]. A browser-based platform would facilitate such studies from a breadth of vantage points currently not practical.
3
Platform Design Goals
We identify the broad design goals for an end-system based mea-surement platform as follows:
Rich measurement capabilities: The examples in §2show that we require support for both passive and active observations. Pas-sive measurements provide precise and continuous understanding of the activity in the browser, ranging from system-level infor-mation such as CPU load, memory availability, and traffic load, to browser-level activity such as HTTP session tracking and fine-grained page-level activity (e.g., DOM1updates and event loop ac-tivity). Note that this enables far broader analyses than available to in-browser JavaScript debuggers (e.g., Firebug). While network problems may often manifest in passive measurements, their root cause frequently reveals itself only using active probing. We there-fore require a wide range of network I/O primitives, reaching as far down in the networking stack as feasible.
Extensibility: As sketched in §2, we strive for a general measure-ment facility rather than providing a simple interface to ready-made measurements. Therefore, instead of providing APIs for specific measurements, the platform should provide APIs that support the implementationof as wide an array of measurements as possible. Security and privacy: While Fathom strives to maximize utility to practitioners and experimenters, the platform must not compromise the privacy of the user (e.g., expose browsing history). Addition-1Document Object Model, a browser-independent tree abstraction representing a web page.
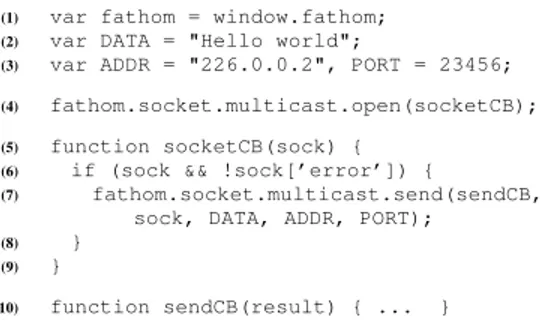
(1) var fathom = window.fathom; (2) var DATA = "Hello world";
(3) var ADDR = "226.0.0.2", PORT = 23456; (4) fathom.socket.multicast.open(socketCB); (5) function socketCB(sock) {
(6) if (sock && !sock[’error’]) {
(7) fathom.socket.multicast.send(sendCB, sock, DATA, ADDR, PORT);
(8) }
(9) }
(10) function sendCB(result) { ... }
Figure 1: Asynchronous multicast network output in Fathom.
ally, the platform must not allow for the abuse of host or network resources.
Measurement accuracy: We require the measurement platform to accurately track time and the outcome of network I/O events. Pre-cise timing supports the ability to both understand when an event happened and to schedule future events.
Low system overhead: We desire the platform’s runtime overhead to be as low as possible for two reasons: (i) high overhead can alter test results for intensive experiments (e.g., bandwidth mea-surements) and (ii) the platform resides in a user’s application and hence we do not want to unduly impact the user’s browsing activity. Portability: Measurement code should work portably on any im-plementation of the platform. This implies that measurement code should execute without requiring compilation to different execution environments.
Fathom’s design (§4) addresses the first three goals and its im-plementation (§5) the remaining goals.
4
Fathom
We design Fathom to provide a rich set of APIs for measure-ments. Since Fathom significantly expands the capabilities of in-page JavaScript code, it requires a carefully thought-out security and privacy model.
4.1 API design
Fathom’s APIs remain conceptually independent of the underly-ing platform implementation and cover a broad range of network I/O capabilities as well as means to obtain system information and historical performance baselines. Our case studies (§7) and devel-opment experience drove the design.
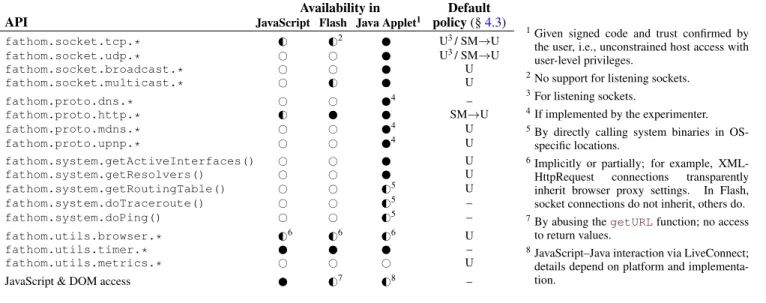
To make its services available to in-page JavaScript code, Fathom creates a new JavaScript object, registers its APIs as meth-ods on this object as requested by the measurement code (see §4.3), and adds it to the page’s window object as window.fathom. Web application code can invoke these APIs to perform both pas-sive and active measurements on the end system. To do so, the caller provides a callback function which Fathom will invoke when the result of the call becomes available. This approach provides natural asynchronicity in the presence of potentially blocking net-work I/O. Fathom passes a single object to the callbacks. A set of properties on the object conveys error codes and return values. Figure1shows an example of sending data over a multicast socket. Fathom currently provides four main API families (listed in Ta-ble1):
fathom.socketprovides socket management. These func-tions export low-level socket functionality and serve as the basis for active measurements, including opening TCP and UDP sock-ets, setting socket options, and performing both blocking and non-blocking I/O operations.
fathom.proto supplies clients and servers for common application-layer protocols including DNS, multicast DNS, HTTP, and UPnP.
fathom.system realizes controlled access to system-provided tools and information to invoke select services on the host that can provide information otherwise unavailable or incon-venient to re-implement. Fathom sanitizes the call arguments, han-dles onerous output parsing, and returns results to the caller while abstracting platform specifics. Examples in this family include the host’s ping and traceroute implementations. In contrast to other runtime plugins such as Java (see §5.1), Fathom’s API never al-lows invocation of arbitrary system commands.
Lastly, fathom.utils collects additional helpful APIs, par-ticularly access to aggregate statistics for passively collected data (metrics.*) and configuration settings for the browser (browser.*), such as proxy configuration.
fathom.utils.metrics.* performs low-level system sampling and monitors the browser’s HTTP activity. Fathom cur-rently conducts passive data collection in three domains: each web page, the browser itself, and the host’s system and network resource usage. For web pages, collection includes socket connection times, DNS resolution times, HTTP response times and goodput, as well as the trigger times for DOMContentLoaded and Load page events.2 From the browser, it collects its overall memory use as
well as network transmission statistics. Finally, from the host sys-tem it collects CPU load, memory use and availability, per-process load, and network interface statistics including packet/byte coun-ters, transmission errors, and—for wireless links—signal strength and noise levels. Per-page CPU load proves tricky to measure. Fathom can expose any browser specific performance measurement API [37] to web pages to measure JavaScript overhead, but authors would still need to instrument their code for reliable profiling. Fur-thermore, the CPU load induced by active embedded objects such as Flash manifests outside of the browser.
Fathom keeps a history of these metrics to provide baseline per-formance metrics for the pages. JavaScript code using Fathom can then obtain aggregate statistics of these data points in order to diagnose detected anomalies in the document loading process. Fathom stores browser and system metrics in client-side persistent storage, while the web page metrics end up in the site’s HTML5 localStoragefacility. This separation of storage for the base-line metrics enables websites to selectively retain or discard col-lected datasets for individual browsing sessions, reduces Fathom’s persistent storage requirements, and minimizes information leak-age across different origins.
Since Fathom monitors the browser’s entire HTTP activity, web pages not requiring Fathom’s capabilities will also incur an over-head in page load times. To exclude any added overover-head, we pro-pose that sites that require Fathom’s diagnostic capabilities could explicitly request them. To signal to the server that the client sup-ports Fathom, Fathom adds an X-Fathom header in the HTTP re-quest for each page. Web sites that wish to enable diagnostic mea-surements for the page and its additional resources echo this header in their response. Via local browser configuration the user can re-quest passive data collection for sites as needed.
Comparison: Flash and Java constitute the main competitors to Fathom, so it behooves us to compare their capabilities directly. Fathom’s network I/O capabilities subsume Flash’s, with the ex-ception of the latter’s built-in multimedia streaming capabilities. 2When downloading a page’s DOM has finished, the browser trig-gers a DOMContentLoaded event. When the page’s additional components (such as images) have finished downloading as well, the browser triggers a Load event.
Availability in Default API JavaScript Flash Java Applet1 policy (§4.3)
fathom.socket.tcp.* G# G#2 U3/ SM→U fathom.socket.udp.* # # U3/ SM→U fathom.socket.broadcast.* # # U fathom.socket.multicast.* # G# U fathom.proto.dns.* # # 4 – fathom.proto.http.* G# SM→U fathom.proto.mdns.* # # 4 U fathom.proto.upnp.* # # 4 U fathom.system.getActiveInterfaces() # # U fathom.system.getResolvers() # # U fathom.system.getRoutingTable() # # G#5 U fathom.system.doTraceroute() # # G#5 – fathom.system.doPing() # # G#5 – fathom.utils.browser.* G#6 G #6 G #6 U fathom.utils.timer.* – fathom.utils.metrics.* # # # U
JavaScript & DOM access G#7 G#8 –
1Given signed code and trust confirmed by
the user, i.e., unconstrained host access with user-level privileges.
2No support for listening sockets. 3For listening sockets.
4If implemented by the experimenter. 5By directly calling system binaries in
OS-specific locations.
6Implicitly or partially; for example,
XML-HttpRequest connections transparently inherit browser proxy settings. In Flash, socket connections do not inherit, others do.
7By abusing thegetURLfunction; no access
to return values.
8JavaScript–Java interaction via LiveConnect;
details depend on platform and implementa-tion.
Table 1: Primary Fathom namespaces and APIs. Due to lack of space, we show select individual functions only for the system family of calls, given its diversity. The final column indicates input mechanisms required by the default client policy (see §4.3): “U” symbolizes that a capability requires user input, “SM→U” means that server manifests suffice to permit the capability while their absence necessitates user input, and “–” indicates permission without additional confirmation. Fathom by design provides full access to JavaScript functions and the DOM without the need of an additional API; we include the ability here to compare to other platforms.
In particular, Fathom supports listening sockets, UDP, protocol-specific APIs, as well as controlled access to host commands and historical performance baselines. With Java, the situation depends on the execution context: without host-specific customization, un-trusted applets only allow a limited set of network I/O APIs and require communication with the applet’s origin server. As pointed out in §5.1, signed and trusted applets (as well as Java applica-tions) provide an over-privileged environment that supports all of Fathom’s capabilities, without abstracting from platform specifics and without reliable DOM interaction. Table1summarizes the re-spective capabilities.
4.2 Privacy
Our first goal is to ensure Fathom does not allow measurements to exfiltrate sensitive information from a user’s browser or host. To do so, Fathom’s design mandates that its network I/O stack oper-ates independently of the browser’s stack. Hence, any state the browser would normally associate with a connection is unavail-able to Fathom. For example, when Fathom script code running in a web page from site a.com issues HTTP connections to site b.com, such connections do not transmit current session cook-ies for b.com even though the user might currently be logged in to that site in a separate tab. This mechanism effectively defeats classic attacks leveraging same-origin violations, such as cross-site scripting (XSS) or cross-cross-site request forgery (CSRF). Like any JavaScript code, Fathom scripts can only access host-local state (in-cluding cookies) for the site the script originated from (a.com, in this case).
By providing websites with the ability to collect additional client-side data in the form of both active and passive measure-ments, Fathom increases the ability for websites to fingerprint visitors [15]. In addition, clients using anonymizing proxies ex-pose themselves to additional de-anonymization risks due to web pages having access to TCP and UDP sockets that can bypass the browser’s proxy settings, as well as communicating with local
net-work services (such as the local DNS resolver) that may expose identifying information. Current tools for obtaining anonymity or resisting fingerprinting try to automate disabling or changing sensitive browser functionality [45], but require vigilance on the user’s part. Thus, it seems reasonable to expect developers of such technologies (or users employing it) to consider disabling Fathom as needed. Additionally, when the browser has a proxy setup, Fathom’s default policy (see below) could disallow active measure-ment except through the proxy or by explicit agreemeasure-ment of the user. Doing so would also reduce the chances of fingerprinting through arbitrary active communication.
The storage of local data about a user’s browsing history is another important privacy concern. Most popular browsers have adopted private browsing modes that, when enabled, aim to elimi-nate the local storage of information that could later reveal a user’s browsing history [2]. Additionally, users expect that “clearing their history” removes all data the browser keeps that one could use to infer their history—behavior that Fathom conforms with.
4.3 Security
We next discuss Fathom’s model for controlling scripts such that the platform has adequate protection against facilitating active at-tacks. We note that in the limit any communication we allow can become part of a distributed attack, but the same applies to browsers without Fathom [29, 50]. We strive to provide enough control that Fathom does not exacerbate the situation significantly. In our present design, Fathom sets its security posture for a given script based on the following inputs:
I.1: Client Policy. Once users have installed Fathom, they may tune the client policy by customizing a general local security pol-icy that comes with Fathom. This polpol-icy specifies the conditions under which Fathom makes API calls available to scripts. For groups of APIs, the policy defines which destinations they may access, whether they require permission to execute, and the form of that permission. Permission forms include user confirmation,
Resource Schema Description
http://*.google.com:* fathom.http.* APIs may contact any *.google.com name on arbitrary ports
*://{upnp}:* any API can contact hosts found via fathom.upnp.* calls
udp://10.1/16:53,5353 fathom.udp.* APIs may contact hosts within 10.1/16 on the DNS and mDNS ports
Table 2: Example resource schemas in Fathom script manifests.
script manifests, and code signing, with multiple forms possible in order to indicate priorities. Users can adjust this policy at any time. Table1shows the default policies for the various API groups. I.2: User Confirmation. Fathom can directly ask users whether it should allow some activity at script run time. We do not con-sider this a particularly appealing mechanism because (i) framing questions in a way users will understand is challenging, and (ii) a system that overly interferes with a user’s workflow may lead users to disable Fathom, or train them to grant permission requests blindly [16]. (Note that Fathom’s status icon in the browser’s tool-bar always indicates to the user when a web page employs Fathom APIs.)
I.3: Script Manifests. Each Fathom script includes a script mani-festthat succinctly declares desired resources. Fathom ensures that in-page JavaScript code can only access resources declared in the manifest, subject to the effective client policy. Currently, these re-sources include Fathom APIs and active measurement targets. APIs and their permissible targets get expressed in tandem in resource schemasof the following form:
[API _subset ] : //[destinations] : [ports]
A resource schema requests access to certain destinations and ports for a subset of the Fathom API. Similar to import state-ments in other languages, Fathom supports API aggregation, al-lowing authors to request access to specific functions (e.g., to fathom.proto.dns.query()) or to all routines in a fam-ily (e.g., fathom.proto.dns.*). Destinations come in three forms: (i) domains with wildcarding (such as *.a.com), (ii) IP address ranges (e.g., 192.168/16), and (iii) derived IP addresses (e.g., {upnp}), covering cases where one Fathom API returns an address that the author wants to subsequently pass to another API, but which the script author cannot specify in advance.3 Table2
shows examples of Fathom resource schemas.
Fathom enforces resource schemas by initially only making a single API function available: fathom.init(). This func-tion receives the script manifest (in JSON form), and subsequently hooks only the requested APIs into the window.fathom object. Scripts thus have no way to access APIs they did not request. I.4: Server Manifests. In addition to script manifests, we allow targets to explicitly control permissible incoming traffic via server manifests. These manifests reside at a well-known location on web servers, currently /fathom.json. Server manifests can whitelist connectivity for scripts originating from specific domains or IP ad-dresses. Users can configure their client policy to allow APIs to proceed without prompting whenever server manifests permit inter-3
For example, UPnP’s discovery phase produces IP addresses to which the script may want to connect via HTTP in order to retrieve a device’s service profile. Resource schemas allow precise expres-sion of such dependencies, in contrast to broad notions such as “lo-cal network.” Fathom tracks hostnames and IP addresses returned by its APIs.
action with the given destination. This scenario forms the default for most APIs initiating connections.
I.5: Code Signing. Finally, experimenters can sign Fathom scripts cryptographically to express authorship. Such signatures provide two key benefits. First, signatures establish an identity behind Fathom code, which allows users to reason about scripts in terms of their trust in the author, instead of (or in addition to) making judg-ments based on the resources the script intends to use (API calls and targets). This trust in authorship likely proves easier for non-technical users to understand. Second, signed code allows users to configure permissions at the granularity of author identities in-stead of script origin. Furthermore, Fathom can identify scripts ab-stractly, across origins, and even when users save Fathom-bearing pages to disk.
Examples: With the above inputs Fathom can derive effective poli-cies for each arriving script at run time. For instance, Fathom can let an arriving script proceed without user prompting if (i) the client policy (I.1) permits execution without prompting for the API re-sources the script requests (via its script manifest, I.3) and (ii) the desired destination agrees via a server manifest (I.4), given (iii) this server manifest actually exists and indeed agrees. In a more simple scenario, if a script bears the signature (I.5) of an author whom the user added to their local whitelist indicating full trust in the code, then the script will execute without any prompting.
By design, policy inputs can come into conflict. The client policy resolves such cases. Consider a script that declares (via I.3) its need to use fathom.socket.tcp.* to open a connection to a given target that has agreed to such communication (via I.4). If the user’s client policy (I.1) requests prompting for permission to use fathom.socket.tcp.* then Fathom will prompt the user (via I.2) before running the code regardless of the server’s consent and any possible signing.
Our hope is that with more extensive experience, a subset of in-puts will emerge that proves sufficient, since fewer mechanisms would simplify explication and maintenance of the security frame-work. Moreover, expanded user experience will allow us to better understand how Fathom’s input mechanisms can accommodate the users’ potentially limited awareness of the implications of the dif-ferent permission levels.
Comparison: Fathom’s security model borrows from the Java and Flash platforms, with careful consideration of current browsers’ same-origin policies. Like Java, we employ code signing and pro-vide user consent as a means to enable functionality, but in contrast to Java’s carte blanche permissions after user consent to signed code (§5.1), Fathom retains precise API-level control and allows neither execution of arbitrary binaries nor file system access. Like Flash, we employ server manifests to establish an explicit con-sent signal for the Fathom core that permits cross-site connec-tions [33]. Script manifests exist in several technologies, includ-ing Java, Flash, and Android apps, as well as Firefox and Chrome extensions. However, our notion of resource schemas renders re-source control more explicit than any of these technologies.
5
Implementation
Web browsers are complex systems, hence the design of a browser-based measurement platform requires careful thought. We first dis-cuss the implementation choices within the browser, and then we describe our prototype of Fathom, which we implement as a Fire-fox extension.
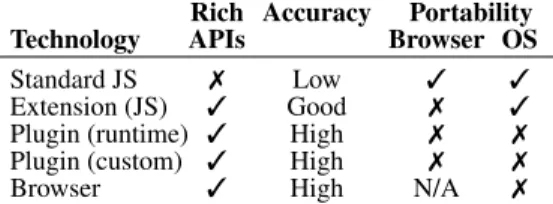
5.1 Implementation space
To maximize ease of adoption, we would like Fathom to depend on the browser’s architecture as little as possible while still
imple-Rich Accuracy Portability Technology APIs Browser OS
Standard JS 7 Low 3 3
Extension (JS) 3 Good 7 3
Plugin (runtime) 3 High 7 7 Plugin (custom) 3 High 7 7
Browser 3 High N/A 7
Table 3: Design space for a browser-based platform. Note: the accuracy of JavaScript-based extensions depends upon the underlying extension API.
menting the design discussed above. In the following, we discuss several points along this design space. Table3summarizes the ca-pabilities of each approach.
Standard JavaScript: While it is possible to implement some types of measurements in JavaScript (see discussion in §7.1), the lack of low-level socket interfaces and access to host properties, leaves this approach suboptimal. Additionally, measurement accu-racy would require careful implementation as timer accuaccu-racy de-pends heavily on browser architecture and load.
Browser extensions: Extensions enhance the functionality of the web browser and allow implementation of measurement tasks in portable JavaScript, platform-dependent C/C++, or both. The API richness available to JavaScript extensions varies considerably across browsers. Those extensions execute with browser privileges and have access to most system resources, including the network and file systems, and remain portable across different operating sys-tems for a particular browser. Since most modern browsers compile JavaScript to native code using JIT compilers, extensions do not impose any significant performance overhead. JavaScript exten-sions present good candidate vehicles for realizing a measurement platform, assuming sufficient API richness and accuracy. C/C++ extensions increase measurement capability at the expense of porta-bility.
Runtime plugins: In this category, Java, Flash, and Silverlight technologies allow developers to implement experiments and eas-ily distribute them to users who have the required runtime plugin installed. Indeed, Java is a popular choice for measurement ex-periments due to its rich APIs and performance, but it comes with crucial shortcomings that largely also apply to the Flash platform. First, Java’s sandboxing keeps execution effectively fully separate from the containing web page. By contrast, measurement code that executes within a web page can directly interact with current web applications. Second, the runtimes’ security policies tend to prohibit activities that could aid network measurements (such as tracerouteor ping invocations). Java’s code-signing feature provides a way to work around this limitation: after the user ac-cepts an initial dialog presenting the code author’s identity, even self-signed applets may access arbitrary runtime APIs and thus behave like host-native applications with full user privileges, in-cluding permission to create and delete files or contact arbitrary network locations. While no doubt useful in principle, this carte blancheability far exceeds the permissions required to implement measurement and troubleshooting code. Third, the availability of the runtime presents a limiting factor, as virtually no modern web sites use Java applets.4 Fourth, even when installed, code porta-bility remains uncertain. For example, JavaScript interaction from plugin code remains highly platform-dependent, and the Android operating system supports only an API-limited dialect of Java. 4
OSX and Windows no longer include a Java runtime by default, while several recent critical security incidents relating to Java [17,
26,35] further erode users’ willingness to install the platform.
Custom plugins: We could develop our own native measurement plugin in C/C++. While enabling great performance and host ac-cess, portable interaction with the browser remains uncertain. For example, Microsoft recently dropped support for the cross-browser NPAPI [53] in its browsers. Sandboxing technologies like NaCl [55] and Xax [13] allow the execution of native applications within the browser without compromising on performance, but their sand-boxed environment respects the browser’s security policies and dis-ables application code from performing TCP/IP or UDP network-ing, or even local file I/O.
Browser changes: One could build the entire platform into an open-source browser, which would provide ideal feature support. This approach would present a substantial development effort and would likely find little immediate support from browser vendors. While not immediately feasible, if a general purpose measure-ment platform proves useful—especially to web site operators—the functionality could be moved into browsers in the future.
After considering the major browsers and the design space sketched above, we chose to implement our prototype of Fathom as a JavaScript-only extension for the Firefox browser. Several as-pects informed this choice: (i) Firefox enjoys great popularity and exists on a wide range of different platforms; (ii) its XPCOM inter-face provides a rich API to extensions; (iii) as we describe further below, this API allows us to perform low-level socket I/O directly from JavaScript. The latter currently sets Firefox apart from other browsers, for which we would need to implement at least parts of Fathom in native code. The extension realizes the design details outlined in §4and currently consists of 3,200 lines of JavaScript. 5.2 Firefox’s architecture
Before describing Fathom’s architecture in detail, we briefly ex-plain the major components of the Firefox browser relevant to Fathom’s design. Firefox’s DOM subsystem creates an abstract representation of the visited web pages, which the rendering en-gine uses for layout and page imaging. A single, shared JavaScript engine parses and interprets both web page and extension code, the browser’s UI thread. While the browser restricts web page code to stringent security policies, the extension code runs with browser-level privileges. The network engine implements application-layer network protocols such as HTTP and FTP. To do this, it employs the Netscape Portable Runtime (NSPR), Mozilla’s platform-neutral API for low-level network I/O and libc-like functions. The XP-COM subsystem implements a number of core architecture facil-ities such as threads and memory management. It also exposes these features to the JavaScript runtime. Furthermore, it includes js-ctypes[40], a JavaScript wrapper to the ctypes library, allowing extensions implemented in JavaScript to call functions in shared C libraries.
5.3 Architectural challenges
Firefox’s architecture poses a number of challenges for extension development, particularly given the design goals for a network monitoring platform as we outlined in §3.
First, without the js-ctypes wrapper, we could not perform socket-level I/O from JavaScript and would need to resort to native code. Even given js-ctypes, implementation of some socket APIs requires handling platform dependent data types (such as union-based network address structures) which creates a challenge for achieving a truly OS-neutral Fathom. We overcame this problem by providing sufficient padding in the relevant JavaScript datatypes to accommodate varying union sizes on different platforms.
Second, despite low-level socket access, ICMP responses and raw sockets remain unavailable. Thus, Fathom cannot provide ac-cess to packet-level traces, which would be useful for detailed
diag-Fathom Firefox fathom object & APIs DOM Rendering Engine JavaScript Engine Network Engine NSPR XPCOM js-ctypes Socket workers FathomScripts Active/passive measurement scripts Network Storage Shell
Figure 2: Fathom’s architecture in Firefox. Fathom augments the browser’s XPCOM subsystem with measurement capabil-ities and extends each web page’s DOM with a fathom ob-ject and associated measurement APIs. Worker threads enable asynchronous API implementation.
nosis. Fathom overcomes the problem by leveraging access to the browser’s command execution API to directly invoke select ser-vices on the host, like ping or traceroute and sidestep this architec-tural challenge.
Third, JavaScript executing as part of a web page or browser extensions accesses the objects on the web page from the browser’s UI thread. Call blocking or long-running functions while executing in this thread would render the entire browser’s UI unresponsive.
Fourth, while Firefox extensions can use a threading mecha-nism called Chrome Workers5[39], these threads do not follow the
standard OS model of a shared address space with synchroniza-tion primitives. Instead, a message-passing system similar to Web Workers exclusively manages communication with worker threads, imposing additional latency.6
Fifth, to conserve system resources, recent Firefox versions clamp callback timer accuracy for in-page JavaScript to low pre-cision when the user is viewing a page in a different tab. This clamping can add further function call latency.
5.4 Fathom’s architecture
Figure2shows the schematic architecture of Fathom running in Firefox. Once installed, the extension creates a component in the XPCOM subsystem that performs two main tasks. First, it in-stalls measurement scripts that handle data collection for passive in-browser measurement. Second, it provides measurement and network I/O APIs to in-page JavaScript. We next discuss the main implementation decisions of Fathom’s prototype.
Asynchronous API callflow: As mentioned in §5.3, in-page and extension JavaScript code as well as the application’s UI thread share a single thread of execution. Since Fathom likewise consists of JavaScript code, its focus on network I/O requires careful API design on our part to avoid the possibility of rendering the entire application unresponsive. In order to invoke potentially blocking 5“Chrome” here refers to a privilege level within the Firefox browser, not to the Google Chrome web browser.
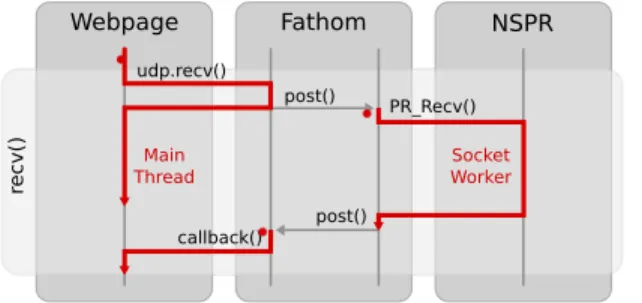
6While XPCOM exports an interface to manage OS-level threads, we opted for Chrome Workers as they provide a natural, Web Worker-like asynchronous interface and also give thread safety guarantees. Webpage Fathom rec v( ) post() post() callback() udp.recv() NSPR PR_Recv() Main Thread Socket Worker
Figure 3: Asynchronous callflow in Fathom between the main thread and a socket worker, for a recv() invocation on a UDP socket.
I/O calls without delaying the rest of the browser and without suf-fering delays due to browser load, Fathom performs all such calls in independently executing Chrome Worker threads and uses asyn-chronously invoked user-provided callbacks when I/O operations complete. Fathom allocates these worker threads on per-socket granularity as socket workers. Firefox’s event management on such threads thus ensures that I/O operations queue up and get processed as I/O progresses. Figure3illustrates the callflow.
Timer throttling: The throttling of frequently executing timer callbacks in background tabs, as mentioned in §5.3, could affect measurements implemented in inactive in-page JavaScript code. For example, a measurement in a background tab that invokes the fathom.socket.udp.receive() API call in a callback invoked periodically via JavaScript’s setInterval() mecha-nism, Firefox would clamp the timeout at 1000ms, perhaps sig-nificantly slowing down and affecting the measurement. As a workaround, Fathom users can package an entire measurement into a single function (with nested state and functions) and provide the sourceof that function—a FathomScript—to Fathom (JavaScript’s toSource()feature makes this easy). Fathom then launches a low-privileged Web Worker, prepares it such that it offers the Fathom API, and proceeds to execute the function in the Worker. This guarantees independence from in-page timer clamping. Script authors need only be aware of this feature in special cases requiring the use of low-latency I/O inside Fathom (see §7.1).
Maintaining baseline measurements: For passive measurements, the current implementation of Fathom samples browser and sys-tem information every 5 seconds and makes the last 2,000 sam-ples available to all web pages. Each sample takes approximately 450 bytes. While the Fathom implementation stores a sliding win-dow with the last 20 user sessions per domain for baseline met-ric measurements, all the parameters of the baseline metmet-rics are configurable. We plan to evaluate different techniques for keeping baseline measurements in our future work.
Security model: Our present implementation supports all of the approaches outlined in §4.3other than code-signing, which we anticipate adding in the near future. While Firefox already sup-ports signing JavaScript code [38], we have opted not to employ the mechanism directly in Fathom, due to technical shortcomings.7We
do, however, follow Firefox’s approach of signing the JavaScript code of an entire web page, including scripts it pulls in additionally, which provides protection against runtime page modifications. Controlling resource consumption: Our design incorporates
7Firefox requires bundling the required files into a JAR file, re-quires a jar: protocol handler for the download, insists on spe-cific Content-Type header MIME values, and uses a rather sim-plistic dialog to convey signer identity to the user.
tracking Fathom’s resource usage—e.g., number of open connec-tions or amount of data transmitted and received in the last time unit. Currently we do not restrict resource usage, which is con-sistent with other runtime plugins such as Flash and Java. As we accrue experience with Fathom we may decide exposing resource usage policy to users and/or developers as it becomes necessary. In the current implementation, if a user judges that a given experi-ment is overloading her system, she can simply close the web page. Given how simple it is for users to stop measurement pages, exper-imenters have a strong incentive to use system’s resources consci-entiously.
6
Performance Evaluation
We evaluate Fathom’s performance using two metrics—overhead on web browsing and timing accuracy. We conduct all experiments with Firefox v7.0.1 on a 2.20GHz Intel Core2 Duo machine with 2GB RAM, running Ubuntu 10.04, and connected to a 100 Mbps local network.
6.1 Overhead
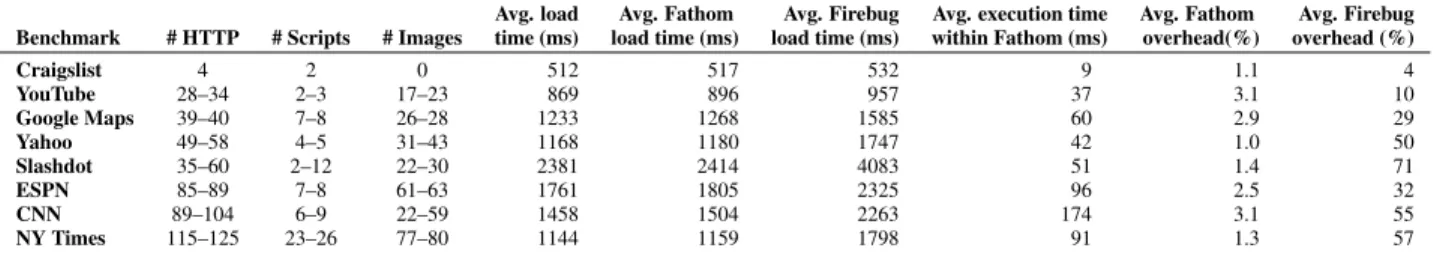
We evaluate Fathom’s page load overhead for eight popular web sites (CNN, Craigslist, ESPN, Google Maps, New York Times, Slashdot, Yahoo! and YouTube) with diverse JavaScript complex-ity and number of HTTP requests. For each site, we compare the time interval between initiating a page load and the firing of the Load event in a Fathom-enhanced browser against a normal browser. The Load event fires at the end of the page loading process when all page components have rendered. To obtain the ground truth, we enhance the browser with a lightweight extension that captures only the page load times. We also compare Fathom’s overhead with that of Firebug [36], a popular browser extension to debug web page performance. Firebug performs extensive diag-nostic measurements, which increase the page load time. We use Firebug as a reference and not as a direct comparison.
We perform 50 page loads for each benchmark and record the timestamp values for the Load event and the clock-time spent within Fathom’s code for collecting the metrics. To measure the worst case performance overhead Fathom imposes, we conduct all experiments on a browser with a warm cache. Table4shows the average absolute load times and Fathom’s relative overhead for the benchmarks. The count of HTTP requests, scripts, and images in-dicates the range between the minimum and the maximum number of requests of each type until the page finishes loading. Requests that start after the page has loaded are not included in these num-bers, as Fathom’s activity for such requests will not affect the load time.
Overall, Fathom imposes 1–3% overhead for all the benchmarks. We note that as the number of HTTP requests increase, the average execution time within Fathom also increases. We expect this behav-ior, because Fathom observes all HTTP activity to collect passive measurements. We also observe that with the increase of HTTP re-quests, Fathom does not always incur a corresponding increase in the absolute overhead. This is because Fathom’s overhead is not additive. Since we implement Fathom in JavaScript, its execution will only block the single-threaded JavaScript interpreter, while the rest of the browser can continue loading the page. Thus, Fathom’s overhead gets masked in part by network latency and the browser’s parallelism during the document loading process.
6.2 Accuracy
Network measurement platforms require accurate timestamps and timers. Fathom leverages the browser’s JavaScript API to record timestamps and the XPCOM API to implement a timer. As with all
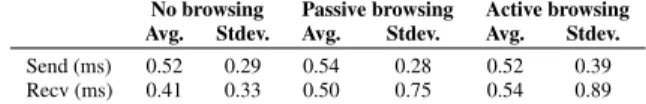
No browsing Passive browsing Active browsing Avg. Stdev. Avg. Stdev. Avg. Stdev. Send (ms) 0.52 0.29 0.54 0.28 0.52 0.39 Recv (ms) 0.41 0.33 0.50 0.75 0.54 0.89
Table 5: Difference in timestamps from Fathom and tcpdump for sent and received packets under different browsing condi-tions.
measurement, competing activity (browser, host and network) can affect accuracy of timestamps and firing of timers.
Timestamp accuracy: We measure the accuracy of Fathom’s time-stamps by sending probe packets between two machines on the same local network and recording timestamps for those packets in Fathom and via packet capture with tcpdump on the same ma-chine. Since the timestamps from Fathom and tcpdump stem from the same clock, the difference between the timestamps for each packet are due to the time required to traverse the network stack between the interface and the browser.
We test timestamp accuracy under different browsing conditions with a train of 106 probe packets with a payload of 200 bytes each. In the “no browsing” scenario, there is no other browsing activ-ity in progress. For the “passive browsing” scenario, we load four web sites (CNN, Google Maps, NYTimes and YouTube) in separate browser tabs and send the probe train after the sites finish loading. For the “active browsing” scenario, we send the probe train while simultaneously loading the same four sites in other tabs.
Table5shows the results of the experiment. The “send” row indicates the difference in timestamps from the time Fathom dis-patches the probe to the resulting timestamp from tcpdump. Sim-ilarly, the “recv” row indicates the delay from the timestamp given by tcpdump to its arrival in Fathom. In all the browsing sce-narios we find the accuracy of the timestamps in Fathom—which inherit the XPCOM granularity of 1 ms—to be within 1 ms of the tcpdumpreported event time. Further, the standard deviation for all experiments is also below 1 ms. In the passive and active brows-ing scenarios, Fathom’s receive timestamp accuracy remains lower than in the “no browsing” case, but the accuracy is still less than 1 ms.
We next explore Fathom’s timestamp accuracy under heavy cross-traffic on the host. We repeat the experiment for 10 probe trains of 10 packets while performing an iperf [21] transfer with 4 TCP connections between two hosts on the same local network. In this experiment, the average difference in the “send” timestamps in-creases to 729 ms. This test represents a worst-case scenario when users fully utilize their network; the heavy concurrent network traf-fic from iperf completely fills the egress queue, which prevents timely transmission of Fathom-generated probes.
Timer: We measure the accuracy of Fathom’s timer by testing how precisely it can dispatch 200-byte probes at 200 ms intervals. We use the timer to send 51 probe trains of 100 probes each and mea-sure the average (µ) and standard deviation (σ) for the observed intervals between consecutive probes. Since the accuracy for XP-COM timers is 1 ms, a σ of more than 1 ms would mean that the timer loses precision. We study timer accuracy in four scenarios: (i) no browsing, (ii) passive browsing, as described above (and for which asynchronous activity due to both ads and scripts can lead to concurrent activity), (iii) active browsing, as described above, and (iv) CPU stress case, where we emulate a competing process in the host that overloads the CPU.
For the no-browsing and stress tests, we find the mean timer in-terval to be within 1 ms of the expected value of 200 ms. Further, for both cases the 5th percentile was 199 ms and the 95th
per-Avg. load Avg. Fathom Avg. Firebug Avg. execution time Avg. Fathom Avg. Firebug Benchmark # HTTP # Scripts # Images time (ms) load time (ms) load time (ms) within Fathom (ms) overhead(%) overhead (%)
Craigslist 4 2 0 512 517 532 9 1.1 4 YouTube 28–34 2–3 17–23 869 896 957 37 3.1 10 Google Maps 39–40 7–8 26–28 1233 1268 1585 60 2.9 29 Yahoo 49–58 4–5 31–43 1168 1180 1747 42 1.0 50 Slashdot 35–60 2–12 22–30 2381 2414 4083 51 1.4 71 ESPN 85–89 7–8 61–63 1761 1805 2325 96 2.5 32 CNN 89–104 6–9 22–59 1458 1504 2263 174 3.1 55 NY Times 115–125 23–26 77–80 1144 1159 1798 91 1.3 57
Table 4: Average page load overhead of Fathom for popular web pages over 50 runs.
centile was 201 ms. For the passive and active scenarios, we use 10 probe trains of size 10, with probes sent at 200 ms intervals. In the passive-browsing scenario, the average lies within 2 ms of the expected, the 5thpercentile was 1 ms, and the 95thpercentile was 267 ms. For the active browsing scenario, the average lies within 33 ms of the expected, the 5thpercentile was 12 ms, and the 95th percentile was 669 ms. This large drop in accuracy compared to the no-browsing and stress experiments occurs because multiple tabs in the same browser window share the same browser runtime.
To sum up, Fathom often achieves 1 ms timestamp accuracy, but the accuracy of timestamping sent packets degrades under both heavy network traffic and concurrent tabs within the browser. The degradation in timing accuracy due to competing activity is a well-known difficulty when measurements are running in shared envi-ronments like end-systems. For example, it is well-known that measurements running in PlanetLab will suffer due to concurrent activity [48]. Measurement scripts that use Fathom should be aware of these issues and perform extra tests to verify the accuracy of their experiments. For example, scripts can invoke Fathom APIs to re-quest CPU load and network cross-traffic on the host to test existing operating conditions.
7
Case Studies
In this section, we demonstrate Fathom’s utility by implementing three example usage cases that together exercise different aspects of its API: providing a JavaScript version of ICSI’s Netalyzr test-suite, debugging web access failures, and enabling Google Maps to diagnose poor web page performance. Our goal is to illustrate how Fathom can support disparate measurement needs.
7.1 Netalyzr
We test Fathom’s suitability as a platform for conducting a wide range of active measurements by reproducing many of the tests present in our Netalyzr testsuite [28]. Netalyzr relies on a Java applet for its client-side tests, so supporting this range of measure-ments can serve as a litmus test for Fathom’s flexibility. We devel-oped a Fathom-powered JavaScript version of the suite,8focusing in particular on tests not feasible in standard JavaScript.
API requirements: In the following, we consider Netalyzr’s full set of test categories and discuss Fathom’s significance in the tests. Address-based tests: This category primarily investigates whether the client resides behind a NAT, and if so, how the NAT renumbers the client-side address and port numbers. It requires the equivalent of getsockname(), i.e., access to the local address and port of a socket. Standard JavaScript does not provide these, but Fathom’s TCP APIs do.
UDP and TCP port reachability:Tests in this category measures the extent to which the client can communicate freely on approx-imately 30 ports used by standard protocols. For TCP, standard JavaScript APIs can approximate these tests somewhat clumsily, 8
http://netalyzr.fathom.icsi.berkeley.edu
while for UDP no mechanisms exist. Fathom provides raw TCP and UDP access, making these tests easy.
Access link properties: Netalyzr leverages Java’s raw UDP access to implement basic latency testing, upstream/downstream bandwidth measurement, and in-path buffer size measurements. Standard JavaScript APIs provide no equivalent functionality, but Fathom’s UDP access allowed us to realize the tests.
HTTP functionality & correctness: These tests determine the presence of HTTP proxies and, if found, the use of caching and caching correctness. The JavaScript XMLHttpRequest API is sufficient to implement Netalyzr’s proxy tests as it provides in-adequate control over raw message headers and browser caching. Fathom’s TCP APIs allow us to realize these tests.
DNS functionality & correctness: This category broadly cov-ers DNS feature support tests, lookup performance measurements, lookup result correctness, and tests for known security problems. While standard JavaScript APIs can use the success status of HTTP requests as an implicit signal of success for the underlying DNS lookup, one cannot obtain the actual IP address resulting from the request, which virtually all tests in this category require. Fathom’s DNS API allows us to conduct these tests.
IPv6 support:This category includes reachability tests to IPv6-only servers as well as performance comparisons to servers reach-able over IPv6 as well as IPv4. As the address family effectively remains abstracted, standard JavaScript can handle these tests via URL requests from the servers in question.
API usability: The Java-to-JavaScript porting effort also allow us to compare programming paradigms. JavaScript’s basic single-threaded execution model with callback-driven asynchronicity dif-fers substantially from Java’s lightweight threading model. Ac-cordingly, restructuring the client’s overall execution flow required significant reworking of the basic design, while porting the tests themselves felt quite straightforward. Netalyzr’s tests execute in individual threads using I/O that may block, with a main thread monitoring test durations. In writing our JavaScript version, we re-structured each test into a larger set of individual functions chained together via callbacks invoked by Fathom upon I/O progress. The main test sequence likewise leverages test completion callbacks. We implemented the Fathom-driven Netalyzr subset in two weeks, the majority of which went into replicating the overall test execu-tion, reporting harness, and GUI. Each test took on the order of an hour to port.
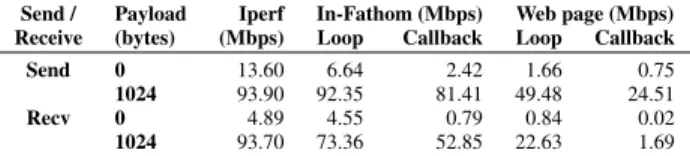
Fathom bandwidth tests: Netalyzr’s testsuite includes measure-ments of the available send and receive bandwidths. We implement two versions of the bandwidth test:
• In-Fathom. To estimate the maximum possible send/receive rate that Fathom can achieve, we invoke NSPR’s UDP send/recv APIs within a tight loop to saturate the available network bandwidth. Since executing a tight loop increases CPU load, we repeat the experiment and invoke the NSPR send
Send / Payload Iperf In-Fathom (Mbps) Web page (Mbps) Receive (bytes) (Mbps) Loop Callback Loop Callback
Send 0 13.60 6.64 2.42 1.66 0.75
1024 93.90 92.35 81.41 49.48 24.51
Recv 0 4.89 4.55 0.79 0.84 0.02
1024 93.70 73.36 52.85 22.63 1.69
Table 6: Fathom’s send/receive data rates for different pay-loads.
API within a setTimeout with delay 0, which enables other events in the event queue to get processed.
• Web page. To get an estimate of the send/receive traffic that JavaScript on a web page can achieve, we perform the same tests but invoking Fathom’s socket send/recv APIs, both within a loop and using a timer.
We perform all tests between a laptop and a desktop connected over a 100 Mbps Ethernet and compare them with the speed achieved by iperf. We determine the maximum available send bandwidth using a Fathom client and an iperf server. We deter-mine the maximum available receive bandwidth using a Fathom-based server and an iperf client. Table6shows the results. We observe that under the In-Fathom category, using the NSPR APIs we get much higher traffic rates than the web pages using Fathom’s APIs. We expect this, since NSPR APIs are synchronous, while due to the asynchronous nature of Fathom APIs every additional callback in the call sequence affects the bandwidth rates.
We also observe that send rates increase as the payloads increase and match iperf send rates at high payload size. But the maximum achievable receive rate did not exceed 73.4 Mbps. Although we could not experimentally verify the cause of the imbalance in the send and receive rates, the discrepancy could arise due to the js-ctypes library used for Fathom’s socket APIs. We suspect js-js-ctypes, which does not benefit from JavaScript’s JIT optimizations [18,6], may pose a significant performance bottleneck.
A natural way to improve the send/receive bandwidths is to par-allelize the tests. We tried using HTML5 Web Workers, which spawn OS-level threads to concurrently perform the bandwidth tests. We observed that the reported bandwidth did not increase when running the test in a tight loop. We attribute this to a lim-itation of the Workers, which cannot access the page’s JavaScript namespace, including the window object. Workers, thus, cannot access Fathom APIs defined on the window.fathom object. All accesses to Fathom APIs must require another level of indirection using the asynchronous message passing postMessage API be-tween the Worker thread and the main UI thread (which has ac-cess to the window.fathom object). This indirection limits the achieved bandwidth.
To enable better bandwidth tests from a web page, script authors should therefore implement bandwidth tests via FathomScripts (re-call §5.4), as they obviate the message passing overhead. Summary: Our implementation of key Netalyzr tests that prove difficult or infeasible to realize in standard JavaScript (local net-work configuration, UPnP probing, DNS features, and particu-larly UDP-based latency and bandwidth tests) confirm Fathom’s versatility. For tests leveraging low-level APIs, particularly fathom.socket.*, the coding effort compares to that re-quired in Java, while tests that could leverage Fathom’s APIs (e.g. fathom.proto.upnp.*) instead of needing full protocol im-plementations required a fraction of the code.
7.2 Web access failure debugging
While troubleshooting suites such as Netalyzr work well when the user has access to sufficient connectivity to download and run the testsuite, such an approach fails in the presence of more funda-mental connectivity problems. Indeed, a frequent request we re-ceive from Netalyzr users is to expand the connectivity tests in that direction, particularly in Netalyzr’s command-line interface. For such scenarios, we developed a “Debug my connection” measure-ment application. We include this script as a built-in part of the Fathom distribution (which provides an immediate incentive for users to install Fathom), but emphasize that we implement it solely in JavaScript using the existing Fathom API. The script is currently 400 LOC.
Implementation: We structure the connectivity debugger by start-ing at the host’s link-level network interface configuration and progressing upward through the protocol stack, identifying and reporting problems at each layer. The test begins by obtain-ing basic system usage statistics from Fathom’s usage baseline, including memory usage and process load. Using fathom. system.getActiveIntefaces(), we detect whether the system actually connects to any network. If so, we report re-cent link quality and throughput counters for the active interfaces, as reported by fathom.system.getNetworkUsage(), and, again using the baseline counters, report on cross traffic originat-ing from outside of the browser. We then move up to the net-work layer and test the availability of a default route in the sys-tem’s routing table, as well as IP-level connectivity (via fathom. system.doPing()) to the gateway and DNS resolver(s) (via fathom.system.getResolvers()), and relevant browser-level configuration settings such as proxies (via fathom.utils. browser.getProxyConfig()). Moving up to the transport level, we attempt retrieval of an image from www.google.com, and the test completes.
At each stage, we report on the outcome of the tests involved. In the current version, users click on a “Debug my connectivity” but-ton provided in the browser toolbar in order to initiate diagnosis, but we envision hooking the connectivity debugger into relevant parts of the browser in order to automatically provide contextual information to the user. For example, upon failing DNS lookups, we can automatically test the DNS configuration, and for unavail-able servers we can test whether the user experiences a full outage or one just affecting the destination site.
Collaborative debugging: We can further troubleshoot possible connectivity problems in the local network by leveraging Fathom’s rendezvous and server-side abilities. In particular, we can leverage Fathom’s UPnP and zeroconf capabilities (via fathom.proto. {mdns,upnp}.*) as follows. First, using UPnP we can try to lo-cate UPnP-enabled gateway devices. If available, such devices can report uplink type, upstream/downstream throughput counters, and other information [51]. Second, using UPnP and Zeroconf we can locate other Fathom-enabled devices. Since Fathom supports lis-tening sockets, we can then engage in both local and remote latency and throughput tests. Correlating the resulting numbers allows us to pinpoint packet loss problems.
To test this approach, we have implemented a Fathom-powered web application in 320 lines of code that lets two Fathom instances detect each other using UPnP and initiate probes to measure uni-directional loss and latency between each pair of Fathom-enabled nodes. The script then compares these values with historic val-ues of loss rates and delays for the local networks, obtained from Fathom’s passive data collection. Values greater than expected cause the application to report poor local network performance. Crucially, in order to conduct this testing the user neither needs to
Figure 4: Diagnosis logic when the page load failed (top) vs. when it succeeded (bottom).
understand command-line tools that might serve similar purposes, nor orchestrate the testing procedure manually. Currently, the web application consists of stand-alone web pages. Integrating its func-tionality into the debug button forms part of our future work. 7.3 Web services debugging: Google Maps
Fathom substantially expands the ability of web site developers to understand the context and impediments that affect the way their pages render in the client’s browser. Fathom’s API enables a range of potential measurements of interest in this context, such as pin-pointing of loss in the home or backbone [11], system and I/O load on the client’s device, and network connectivity configurations that hamper performance (e.g., via slow HTTP proxies). In the follow-ing, we demonstrate Fathom’s utility in troubleshooting client-side issues for web services by playing the role of the developer for Google Maps. We make two modifications to the Google Maps web page code. First, we embed a diagnostic script that uses Fathom APIs to obtain results for passive and active measurements. Sec-ond, we provide a debug button on the Google Maps page, which enables a user to initiate execution of the debug script. In the spe-cial case when the button itself does not render (because page load-ing failed), users can employ Fathom’s connectivity debugger as explained in the previous section.
Implementation: The debug script first verifies if the Load event for the Google Maps web page fired, confirming full page load. Figure4illustrates the decision logic Fathom follows for failures (top) and successes (bottom) of page load attempts. If the load time—i.e., the time elapsed between the first HTTP request and when the Load event fires—resembles9the corresponding baseline value, then the algorithm reports a normal load and terminates.
If the load time turns out far smaller than the baseline value, the baseline metric does not apply to the current scenario. Possible causes include changing content size, page caching, and improving network conditions (such as when the user moved to a faster net-9We say that a value is similar to the corresponding baseline value if it lies within ±2 σ of the baseline value.
work). Fathom tracks all HTTP-level metrics for the last 20 user sessions. Using DOM localStorage, it makes the results avail-able to all scripts of the same origin. We then average these values to generate baseline values for Google Maps. As a result, the debug script can identify the problem by checking if the amount of down-loaded content for the web page reduced substantially, if the data rate for individual resources in the web page improved, and also if the browser fetched a web page resource entirely from the cache.
If the load time far exceeds the baseline, it could indicate a net-work impediment or a host problem. To distinguish between the two cases, the debug script examines the content time, i.e., the time elapsed to download the content of the web page. A content time less than or equal to the baseline indicates that a problem with the host machine or the browser slowed down the rendering. Such a condition could also arise if the user explicitly stops the loading of the web page and then invokes the debug script. Our debug script uses fathom.system.* APIs to determine resource utilization. If content time proves larger than the baseline, the problem most likely resides in the network. We debug slow networks as discussed in the previous section.
Emulating Google Maps: Since we did not have access to Google Maps servers, we modified the site’s JavaScript code at runtime. When visiting the Google Maps page, we inject the debug script and the Fathom debug button using Greasemonkey [30]. Our debug script uses Fathom APIs to implement all diagnostic cases shown in Figure4.
We implemented Fathom’s Google Maps debug script in 640 lines. It imposes no observable runtime overheads. The bulk of the script implements parsing routines to interpret responses from fathom.system.* as well as statistical utilities to compute av-erage and standard deviation for metric values. Fathom’s system, network, and browser-level APIs directly provide all values except for cross-traffic, which we measure using a combination of APIs: cross-traffic at the host is the fraction of HTTP traffic observed by the browser over the TCP-level traffic approximated from the link-level network measurements. In order to estimate cross-traffic given only transport level information from the browser, Fathom must also account for the effect of framing. To do so, Fathom as-sumes all link-level traffic to be TCP and subtracts the per-packet overhead from the traffic counters (in bytes) to get approximate transport level TCP traffic. It then compares this value against the TCP traffic values available from the browser.
We used our debug script and performed 10 trials of loading the Google Maps home page with packet loss of 10, 20, 30 and 50 percent and packet delays of 0.5, 1.0, 1.5 and 2.0 seconds. We emulate packet loss and delays with netem. In each case, before starting the experiments, we loaded the Google Maps home page repeatedly to allow Fathom to calculate the starting baseline metrics using 20 normal sessions.
While the page load time increased in the presence of packet loss rates up to 20%, the content download time remained within two standard deviations. Higher packet loss rates severely affected the goodput and the page took much longer to load. We observed that for all packet delays (starting from 0.5 seconds), the debug script indicated load times larger than two standard deviations and the content download time also increased. In all cases, the debug script identified a change in the network operating conditions. As the number of completed connection trials increased, more sam-ples fell into the range of two standard deviations and so Fathom could include the HTTP metric values from the newer sessions. The debug script thus adjusted the baseline correspondingly, with the result that some of the later trials reported normal operating conditions.