Cooperative Localization in Mines Using
Fingerprinting and Neural Networks
A Master's Thesis
Submitted to the School of Engineering
through the applied sciences department
in
partial fulfillment of the requirements for
the Degree of Masters of Science
in
Engineering (option
Telecommunications) at the
U niversite of Quebec en Abitibi-Temiscamingue
Director:
Nahi Kandil
Co-directors: Sofiene Affes
Chahe N erguizian
Mise en garde
La bibliothèque du Cégep de l’Témiscamingue et de l’Université du Québec en Abitibi-Témiscamingue a obtenu l’autorisation de l’auteur de ce document afin de diffuser, dans un but non lucratif, une copie de son œuvre dans Depositum, site d’archives numériques, gratuit et accessible à tous.
L’auteur conserve néanmoins ses droits de propriété intellectuelle, dont son droit d’auteur, sur cette œuvre. Il est donc interdit de reproduire ou de publier en totalité ou en partie ce document sans l’autorisation de l’auteur.
ABSTRACT
This work is a special investigation in the localization of users in underground
and confined areas such as gold mines. It sheds light on the basic approaches that are
used nowadays to estimate the position and track users using wireless technology. Localization or Geo-location in confined and underground areas is one of the topics under research in mining labs and industries. The position of personnel and equipments in areas such as mines is of high importance because it improves industrial safety and security. Due to the special nature of underground environments, signals transmitted in a mine gallery suffer severe multipath effects caused by reflection, refraction, diffraction and collision with humid rough surfaces. In such cases and in cases where the signals are blocked due to the non-line of sight (NLOS) regions, traditional localization techniques based on the RSS, AOA and TOA/TDOA lead to high position estimation errors. One of the proposed solutions to such challenging situations is based on extracting the channel impulse response fingerprints with reference to one wireless receiver and using an artificial neural network as the matching algorithm.
In this work we study this approach in a multiple access network where multiple access points are present. The diversity of the collected fingerprints allows us to create artificial neural networks that work separately or cooperatively using the same localization technique. In this approach, the received signals by the mobile at various distances are analysed and several components of each signal are extracted accordingly. The channel impulse response found at each position is unique to the position of the receiver. The parameters extracted from the CIR are the received signal strength, mean excess delay, root mean square, maximum excess delay, the number of multipath components, the total power of the received signal, the power of the first arrival and the delay of the first arrival.
The use of multiple fingerprints from multiple references not only adds diversity to the set of inputs fed to the neural network but it also enhances the overall concept and makes it applicable in a multi-access environment. Localization is analyzed in the presence of two receivers using several position estimation procedures. The results showed that using two CIRs in a cooperative localization technique gives a position accuracy less than or equal to lm for 90% of both trained and untrained neural networks. Another way of using cooperative intelligence is by using the time domain including tracking, probabilities and previous positions to the localization system. Estimating new positions based on previous positions recorded in history has a great improvement factor on the accuracy of the localization system where it showed an estimation error ofless than 50cm for 90% of training data and 65cm for testing data.
The details of those techniques and the estimation errors and graphs are fully presented and they show that using cooperative artificial intelligence in the presence of multiple signatures from different reference points as well as using tracking improves significantly the accuracy, precision, scalability and the overall performance of the localization system.
ACKNOWLEDGMENT
I would like to acknowledge my advisor professor N ahi Kandil for his extraordinary care and support, for his advices and professional experience which helped speed up the research process. I would also like to thank my co-director professor Sofiene Affes, for all his bright ideas and how he helped me think in a manner outside the box which contributed in the success of this work. I also would like to thank professor Chahe N erguizian for his cooperation and help in providing data and measurements which were the base to build on.
I salute the Laboratoire de Recherche Telebec M obilite en Communications
Souterraines (LRTCS) and the Institut national de la recherche scientifique Energy, Materials and Telecommunications (INRS-EMT) for their experienced research team and their equipment that contributed in the achievement of this study.
I also would like to thank the Universite du Quebec en Abitibi-Temiscamingue
for accepting me as a part of their family, for the help they provided to make me adapt as an international student in their region and for the great experience I had with them during my studies.
I dedicate my work to my father, mother and brothers who supported me in this journey. To my friends who were always there to help me accomplish my goal.
TABLE OF CONTENTS
ABSTRACT ... .II
ACKNOWLEDGMENT ... 111
TABLE OF FIGURES ... VI LIST OF TABLES ... VIII NOTATIONS AND ABBREVIATIONS •••••••••••••••••••••••••••••••••••••••••••••••••••••••••••••••••••••••••••••••••••••••••••••••••••••••••••••••••••••• IX CHAPTER !-INTRODUCTION TO THE THESIS ... ! 1.1. RESEARCH PROBLEMATIC: ... 2
1.2. OBJECTIVE OF THE RESEARCH ... 2
1.3. RESEARCH METHODOLOGY ... 3
1.4. STRUCTURE OF THE THESIS ... 4
CHAPTER 2 -INTRODUCTION TO LOCALIZATION ... 5
2.1. AN OVERVIEW OF LOCALIZATION ... 5
2.2. THE TRIANGULATION ALGORITHMS ... 6
2.2.1. Lateration Technique ... 6
2.2.2. Angulation technique based on the Angle of Arrival: ... 15
2.3. SCENE ANALYSIS OR FINGERPRINTING ... 16
2.3.1. Probabilistic Methods ... 17
2.3.2. K-Nearest-Neighbor (kNN) ... 18
2.3.3. Artificial Neural Networks {ANNs) ... 19
2.3.4. Support vector machine (SVM) and Smallest M-Vertex Polygon (SMP) ... 20
2.4. MODERN LOCALIZATION SYSTEMS ... 21
2.4.1. Fundamentals of localization systems ... 21
2.4.2. Examples of modern positioning systems ... 23
CHAPTER 3- LOCALIZATION IN MINES USING FINGERPRINTING AND NEURAL NETWORKS ... 29
3.1. FINGERPRINTING AND WIRELESS SIGNALS ... 29
3.3. LOCALIZATION USING ONE RECEIVER ... 34
3.4. CHALLENGES OF THE LOCALIZATION SYSTEM ... 35
CHAPTER 4- COOPERATIVE LOCALIZATION USING TWO RECEIVERS OR MORE ... 38
4.1. FINGERPRINTING METHODOLOGY ... 38
4.2. STRUCTURE OF THE NEURAL NETWORKS ... 40
4.2.1. Localization based on separate neural networks ... 40
4.2.2. Localization based on one neural network ... 42
4.3. RESULTS OF THE COOPERATIVE TECHNIQUES ... 44
CHAPTER 5- LOCALIZATION USING TRACKING ... 49
5.1. FINGERPRINTING METHODOLOGY ... 49
5.1.1. Theoretical Model ... 50
5.1.2. Random-Walk Model ... 52
5.2. STRUCTURE OF THE NEURAL NETWORK ... 53
5.3. RESULTS OF LOCALIZATION USING TRACKING ... 55
CHAPTER 6- CONCLUSION ... 59
APPENDIX A- REFERENCES ... 61
APPENDIX B- WIRELESS-BASED INDOOR POSITIONING SYSTEM AND SOLUTION ... 65
TABLE OF FIGURES
FIGURE 2-1. POSITION ESTIMATION USING THREE RSS MEASUREMENTS FROM NODES A, 8 AND C. ... 10
FIGURE 2-2 LOCALIZATION BASED ON THE TOA ... 11
FIGURE 2-3 LOCALIZATION BASED ON TDOA MEASUREMENTS ... 14
FIGURE 2-4 LOCALIZATION BASED ON THE AOA ... 15
FIGURE 2-5 SAMPLE NEURAL NETWORK ... 20
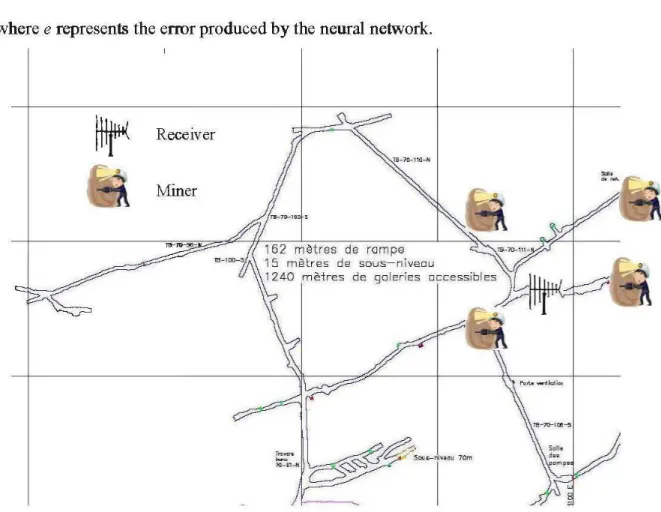
FIGURE 3-1- MAP OF THE GALLERY ... 31
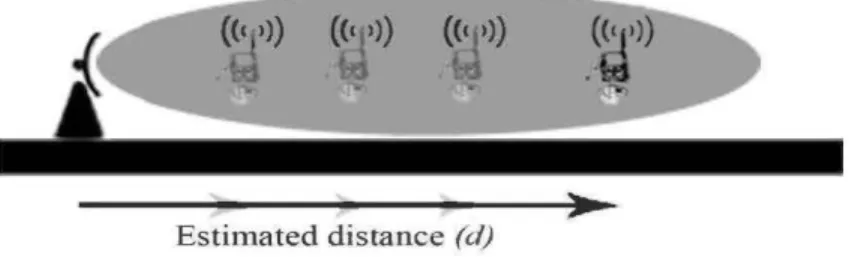
FIGURE 3-2- LOCALIZATION USING ONE FIXED RECEIVER. THE Cl R IS EXTRACTED AT DIFFERENT DISTANCES TO THE TRANSMITTER WITH 1 METER STEP SIZE ... 35
FIGURE 3-3. EXAMPLE OF A LOCALIZATION ERROR IN MINES ... 36
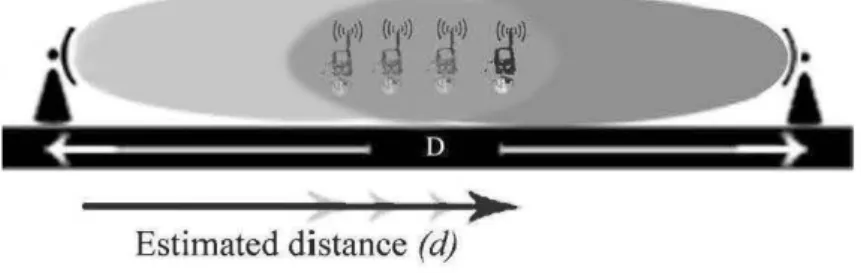
FIGURE 4-1- LOCALIZATION USING TWO SIGNATURES OF TWO RECEIVERS IN THE AREA WHERE TWO SIGNALS INTERSECT ... 39
FIGURE 4-2- LOCALIZATION BASED ON TWO SEPARATE ESTIMATIONS ... 41
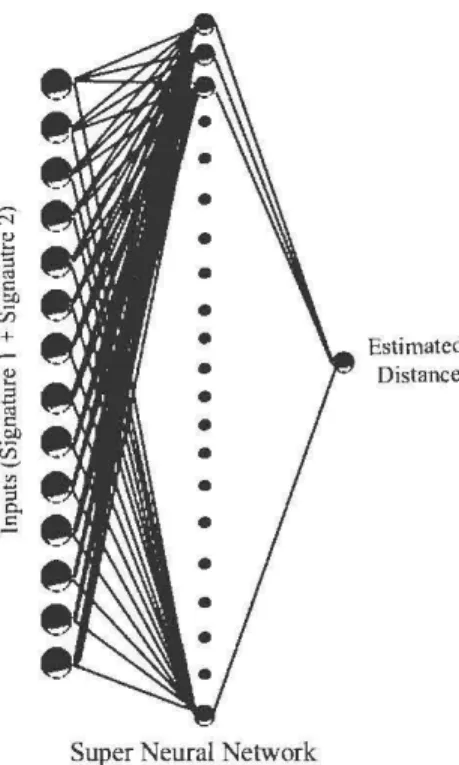
FIGURE 4-3- NEURAL NETWORK BASED ON MULTIPLE SIGNATURES ... 43
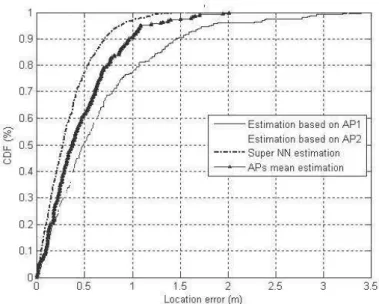
FIGURE 4-4- CDF PLOTS OF THE POSITION ESTIMATION ERRORS AT A RECEIVERS' SEPARATION DISTANCE 0=60M USING SEVERAL LOCALIZATION TECHNIQUES ... 45
FIGURE 4-5- CDF PLOTS OF THE POSITION ESTIMATION ERRORS AT A RECEIVERS' SEPARATION DISTANCE 0=80M USING SEVERAL LOCALIZATION TECHNIQUES ... 45
FIGURE 4-6- CDF PLOTS OF THE POSITION ESTIMATION ERRORS AT A RECEIVERS' SEPARATION DISTANCE 0=100M USING SEVERAL LOCALIZATION TECHNIQUES ... 46
FIGURE 4-7- CDF PLOTS OF THE POSITION ESTIMATION ERRORS AT A RECEIVERS' SEPARATION DISTANCE 0=60M USING SEVERAL LOCALIZATION TECHNIQUES ... 47
FIGURE 4-8- CDF PLOTS OF THE POSITION ESTIMATION ERRORS AT A RECEIVERS' SEPARATION DISTANCE 0=80M USING SEVERAL LOCALIZATION TECHNIQUES ... 47
FIGURE 4-9- CDF PLOTS OF THE POSITION ESTIMATION ERRORS AT A RECEIVERS' SEPARATION DISTANCE 0=100M USING SEVERAL LOCALIZATION TECHNIQUES ... 48
FIGURE 5-1 POSSIBILITIES OF PREVIOUS POSITIONS FOR L=2 ... 50
FIGURE 5-2 POSSIBILITIES OF PREVIOUS POSITIONS FOR L=3 ... 52
FIGURE 5-4 CDF PlOTS FOR THE TESTING DATA USING THE THEORETICAl MODEl. ... 56 FIGURE 5-5 CDF PlOTS FOR TRAINING DATA USING THE RANDOM-WAlK MODEl ... 57 FIGURE 5-6 CDF PlOTS FOR TESTING DATA USING THE RANDOM-WAlK MODEL ... 58
LIST OF TABLES
TABLE 5-1 FINGERPRINT COMBINATIONS FOR L=2... 51
ANN AOA AP BP CIR GPS GRNN GSM IFT LOS MLP MS NLOS PDP PL RF RMS TDOA TOA UWB WLAN
NOTATIONS AND ABBREVIATIONS
Artificial Neural Network Angle Of Arrival
Access Point Back Propagation
Channel hnpulse Response Global Positioning System
Generalized Regression Neural Network Global System for Mobile communication Inverse Fourier Transform
Line Of Sight
MultiLayer Perceptron
Mobile Station Non Line Of Sight Power Delay Profile Path Loss
Radio Frequency Root Mean Square
Time Difference Of Arrival
Time Of Arrival Ultra Wide Band
CHAPTER
1 -
INTRODUCTION TO THE THESIS
Telecommunications is one of the fields that are rapidly growing nowadays and its main goal is to provide communication services and data transfer anywhere anytime. Many of those services are wireless and they range from simple remote controls to complex satellite systems. One of the vast numbers of applications of wireless telecommunication systems is position estimation or localization. Outdoor localization systems such as Global Positioning System (GPS) are already in the market and are available to anyone providing an important service that can locate the user's position precisely showing the road names and the direction to take in order to reach any destination within a city or a country. On the other hand, indoor localization is still a controversial topic due to the fact that the signals transmitted indoor undergo several deformations due to reflections and multipath effects caused by the indoor environment. Unlike outdoor mediums where signals travel freely in open-spaces, indoor environments are more complicated channels that need to be modeled in order to estimate how the signal would be received after being reflected, refracted or scattered. The main purpose of this work is to study localization in one special indoor environment which is the mines.
Localization or Geo-location is still one of the major topics under research in mining labs and industries. The position of personnel and/or equipments in areas such as mines is of high importance because it improves the factors of industrial safety and security. Mines have their own nature which is made up of connected tunnels and humid rough surfaces. For that reason, wireless signals transmitted in mines' tunnels would reflect, refract and scatter forming multipath components or simply decay after short distances. Due to that and in the cases where signals can no longer travel due to the presence of interconnected tunnels and non line of sight regions, localization using traditional techniques based on calculating the received signals' strength, angle of arrival, or time of arrival would no longer give a precise estimation of the user's position [3 ][ 4]. One of the new approaches to localization in confined areas and mines used the
channel impulse response (CIR) as a fingerprint and it proved to g1ve accurate positioning results. The characteristics of wireless signals that define what a CIR is will be covered later.
1.1. Research Problematic:
Localization using the CIR as a fingerprint is one of the accurate solutions that estimate the position of transmission precisely in a mine's gallery. However, research was conducted based on one receiver and is only applicable in a single gallery. Despite the fact that the results are promising, there are several obstacles that prevent using the same technique in underground environments such as mines due to the following reasons:
The need of a global localization system that can cover all the areas of interest which involves the use of more than one Access Points (AP) or receiver in the whole area of interest.
The existence of junctions and connected tunnels, these tunnels may result in misleading information about the exact position of the mobile user or mmer.
On the other hand, using cooperative artificial intelligence in a localization
technique where more than one rece1ver IS available is a promising alternative
because it leads to better estimation results.
1.2. Objective of the Research
The main objective of this research is to introduce localization in a cooperative technique where more than one receiver shares the responsibility of estimating the position of the transmitted signal underground. This work enhances the previously used method [3] of geo-location and makes it more accurate and precise. The different signals received at different locations add more diversity to the positioning
performed in both space and time domains, i.e. in space domain, two different receivers in different locations will receive the same transmitted signal to give one position estimation result, while in time domain, the neural networks will record the study the history of fingerprints as a function of time and then localize the position based on two or more fingerprints. Here, the fingerprints of the previous positions play an important role in estimating the new position of the transmitter.
1.3. Research Methodology
Several localization approaches are discussed in the thesis and they are divided under two categories: triangulation and scene analysis techniques. In the triangulation approaches, the same theory is used for both indoor and outdoor systems and it mainly relies on the received signal's components such as the received signal's strength (RSS), angle of arrival (AOA) or time of arrival (TOA); those components are used to calculate the distance to the transmitter. In the second approach, information about the received signals is collected throughout the area of interest and then it is stored in a database. After collecting the data, artificial neural networks are presented as the matching algorithms that can be trained to form a specific model of localization in that special environment. Those estimations can be made based one transmitter or in a cooperative manner where two or more transmitters are used. The details of those techniques and the estimation errors are fully presented in the chapters that follow.
In the following, we present a specific localization approach based on the
multiple impulse-response fingerprinting combined with neural networks in a multi-access environment. In this approach, the received signals by the mobile at various distances are analysed and several components of each signal are extracted accordingly. The channel impulse response found at each position gives a precise uniqueness to that position and forms a signature or a fingerprint at a specific distance from the transmitter. One signature is a collection of extracted parameters which are the RSS, mean excess delay, root mean square, maximum excess delay, the number of multi path components,
the total power of the received signal, the power of the first arrival, and the delay of the first arrival.
1.4. Structure of the thesis
In the second chapter, a survey of wireless localization techniques shows the modern localization systems and methodologies. This will discuss the basic methods and parameters used in localization system and their respective performance in indoor environments.
In chapter three, a short investigation of wireless signals characteristics will be conducted which leads to identifying essential parameters used in most localization systems. This chapter will discuss the choice of the fingerprinting technique and neural
networks as a technique used in geolocation in mines highlighting its major advantages and drawbacks.
Chapter four will introduce the cooperative localization system used in this work
including the algorithms and neural network architectures. In this chapter, position
estimation is discussed in a cooperative manner where two or more receivers get
involved in collecting the fingerprints of a transmitter, then they feed these fingerprints to the artificial neural networks which handle position estimation using different techniques. The results of all techniques and methodologies are presented afterwards using multiple neural networks and testing all the data, the techniques of localization are compared together and analyzed in different graphs.
Chapter five introduces the concept of tracking based on the adding the previous positions of the miners as parameters that contribute in estimating the current position. The theory of tracking and the random walk model are fully discussed and tested. The results oflocalization using tracking are interpreted at the end of the chapter.
Finally, a conclusion is drawn out in chapter six showing the advantages of the different techniques that were introduced to the localization system and the major future challenges these techniques encounter.
CHAPTER
2
-INTRODUCTION TO LOCALIZATION
2.1. An Overview of localization
Localization, position estimation and geo-location are all synonyms used in wireless networks and they hold the same concept which is the estimation of the position or location of a mobile user based on the wireless transmission of electromagnetic signals. Localization was recently used in a variety of applications and services that are both commercial and military. These services may be essential for outdoor purposes such as the detection of emergency calls, fraud and the management of traffic, at the same time, several applications involve indoor localization used for home automation, tracking of fire-fighters and miners, patient monitoring and intruder detection [1].
Geo-location is a process where the system locates the position of the person or/and equipment based on the wireless transmission between terminals. Based on that,
we can distinguish several types of positioning algorithms. For example if the mobile user is the one that receives the signals and based on that information it localizes itself,
the system would be a self-positioning system. On the other hand, if the base stations were the nodes that localize a mobile unit, this would be a remote system. Due to the fact that wireless transmission travel between both nodes most of the times, some
systems use the indirect positioning algorithms that allow one node to estimate the location of the mobile and then send the information back to the other node. These systems are called indirect and they may be indirect remote systems where a mobile localizes itself and informs the base station of its position. On the other hand, the system may be indirect self positioning, where the remote localizes the mobile unit and sends its location to that unit using data transfer.
In order to estimate the source of a wireless transmission, several techniques are used and will be discussed in the literature. The first key point to localization is to understand the characteristics of wireless communications and electromagnetic signals travelling between the transmitter and the receiver. These singles carry information and
hold certain characteristics such as frequency, power, phase, etc ... so each wireless signal may have its own power, frequency and phase once it was transmitted. However, those parameters may change at the receiver's level after being affected by the transmission medium or what is called the channel of communication. For example, the power of any wireless transmitted signal decreases once the distance increases causing the signal to fade. The frequency of a transmitted signal may be altered if the receiver is at a speed travelling towards or away from the transmitter. To make it simple, our minds are able to localize someone calling us at a distance away from us by using the
frequency of that person, direction of arrival of his/her voice and amplitude. In wireless
communications the concept is the same, once a signal is received; several parameters are extracted and compared to the original signal transmitted. Then several algorithms and techniques may be used in order to estimate the position of transmission.
2.2. The Triangulation Algorithms
Most of the algorithms used in localization follow the triangulation technique. The concept of the triangulation technique is based on collecting information from at least three reference points and then estimating the position of the user in an area of intersection. Several algorithms are present and depend on parameters extracted from the received signals. These parameters classify the type of the triangulation technique, for example using the received signal's strength or the time of arrival as a parameter to estimate the position of the transmitter is categorized under the lateration techniques whereas using the angle of arrival as a parameter for position estimation classifies the technique as angulations technique. A detailed discussion about each kind is presented along with the difficulties each algorithm faces in different environments.
2.2.1. Lateration Technique
The main purpose of geo-location is to find the distance that separates the transmitter from the receiver(s). Here, the medium or environment plays an important role in defining which technique to use. In a lateration technique, at least three reference
points are required to localize a transmitter. The number of reference points needed depend on whether localization is two or three dimensional. The following techniques summarize the major localization concept.
2.2.1.1. TECHNIQUE BASED ON THE RECEIVED SIGNAL'S STRENGTH:
Signals transmitted through an open space or specific channels are subject to energy loss on the way to the receiver. One of the methods of calculating the distance to the receiver is by analyzing how much energy the signal has lost on its way to the receiver. Knowing some specifications about the transmitted signals such as the power, the frequency of transmission and the antenna gains allows us to calculate the distance traveled by the signals before reaching the receiver and this allows estimating the position of the transmitter unit.
In the case of free space, the Free Space Path Loss (FSPL) is a simple
example that is modeled using simple mathematical equations. An example of
localizing a transmitter in a free space channel may be helpful to understand the basic concept of localization using the received signal's strength. For instance,
after transmitting a wireless signal in free space with initial power (Pr) the power
of the received signal (PR) at a specific distance d away from the transmitter is
given by:
p = PrGr A=
~G
p GR 4nd 2 (4nd)' T T R· (2.1)
where PR is the received signal's strength measured in dB, Pr is the transmitted
signal's strength, Gr and GR are the antennas gains at the transmitter and the
receiver respectively. A is the wavelength related to the central frequency of the
wireless transmitted signal, and dis the distance separating the transmitter and the
rece1ver.
The distance d which is the main parameter used for position estimation
from equation (2.1) given the other parameters. In a free space model where wireless signals travel freely without being reflected or attenuated, the path loss can be easily calculated using the following equation:
(
4~d)
2FSPL = 1\. (2.2)
This can be rewritten in dB as:
FSPL = 10log10 (
(
4~d)
2 ) (2.3)(4ndf)
= 20loglo - c - (2.4) 20loglo (d)+ 20log10 (f)- 147.55. (2·5)However, some channel models are more complicated such as indoor and confined areas where the signals are attenuated by other factors like reflection, refraction, scattering, etc ... These factors change when altering the medium where the wireless transmission is taking place. Unlike free space models where the distance and frequency are the main factors of path loss, in different channel models (like indoor models) the path loss is also dependent on the channel's response to wireless signals. Thus, in each medium, several factors affect the transmitted signals such as reflection, refraction, small and large scale fading,
shadowing, etc ... In these cases, equation (2.5) no longer calculates the real path
loss of a transmitted signal and a more generalized equation can be written as follows:
where PR-d is the received signal's strength at a distance d away from the transmitter, and PT is the transmitted signal's strength. GT and GR are the gains of
the antennas at the transmitter and at the receiver, respectively. Pe-d is the
distance function and it is of the following form:
Pe-d(dB) = Pe-d0(dB)
+
10nlog(d~)
+
X. (2.7)where Pe-do is the loss measured for a distance do which is taken as 1 meter, n is
the attenuation coefficient and X is a random variable depending on the nature of
the channel. Replacing this equation in equation 2.6 leads us to the following equation:
PR-d (dB) = PT(dB)- Pe-do(dB)- 10nlog (ddJ- X+ GT(dB)
+
GR(dB).(2.8)
Equation 2.8 gives the PL including the factors that are affected by the channel, as well as other parameters represent the specifications of the transmission such as the gains of the antennas at both the transmitter and receiver.
Another formula is given in [15] as follows:
In Free Space o.=j3=2, and the values of
f
0and
d
0represent a specific
frequency and distance taken as a reference while
e;
is a variable used to model
the transmission
po~.In a 2D scenario, the estimated dislance represents a radius of a circle IMtere
the llansmitter lies. Thus three reference points or receivers are needed in this
technique and
theestimated position would be located at the intersection point of
the three cirdes as shown in figure 2.1. Due to the Jact that the transmitted signals
are made up of nrultipath components and non line of sight
re~ons,the estimated
distance does not represent the real distance that separates the BS from the MS.
The error
that
is produced by three different references forms an error
re~onv.hich
is the area where the three circles intersect .
...
--
--...
,.-,..
---'
' / -... ..
• , / . / . . ... - - •• ' ... ' I ./ /
~/', -. .
..-'~~Node B
!;''
\\J',, do
: I /
-d~"'1:-~·~· ~~~',-";....-'C)
'
I·
: I I
I I',11 NodeA
/ ' '
.
. " ..
\..
/
'/
'
d '
' ' ' / I ,;_;-' " · ",
...
...
___
_...·· / · · ·
..
, . / , r..·
' - "...
_
.... ,.,' -.
-~Node C
F~ure 2-1. Position estin\atWln using
three
RSS measurements from nodes A, Band C.The use of direct measurement of the distance from
theRSS cannot be
reliable because it mainly depends on the path loss model that IBs been
considered. It also may depend on
thechannel chataderistics, tlrus RSS-based
positioning techniques are sensitive to the variations of
thechannel.
In lad, due to
the severe multipath fading
and
shadoiMng present in the indoor environment,
path-loss models do not always hold. In our case of study which is the mines and underground environments, the use of this technique is not convenient due to the presence of connected tunnels that guide the transmitted signals and forces the multipath components to use a direction of transmission after bumping into the
walls of the tunnel. It is also shown in [13] that the accuracy of an RSS-based
positioning system deteriorates once the distance between the reference points mcreases.
2.2.1.2. TECHNIQUE BASED ON THE TIME OF ARRIVAL (TOA):
Localization using the time of arrival of a transmitted signal is an accurate technique that relies on the fact that the distance from the mobile target to the measuring unit is directly proportional to the propagation time. The concept of this technique is to calculate the time needed for a wireless transmitted signal to reach each of the three measuring reference points as shown in Fig. 2.2. This is only possible if the receivers are precisely synchronized or if they are exchanging timing information using certain protocols such as a two-way ranging protocols
[19], [20], [21].
Figure 2-2 Localization based on the TOA
Different techniques are used to measure the TOA such as direct sequence spread-spectrum [16][17] or ultra wide band (UWB) measurements [4], [18]. Once the one way time is measured, the distance between the transmitter and the receiver is calculated. A straightforward approach uses a geometric method to
compute the intersection points of the circles of TOA as presented earlier in the case of the RSS. The position of the target can also be computed by minimizing the sum of squares of a nonlinear cost function, i.e., least-squares algorithm [22],
[23]. It assumes that the mobile terminal, located at (x0, y0 ), transmits a signal at
time t0, the N base stations located at (x1, y1), (x2, y2), ... , (xN , YN ) receive the
signal at time t1, t2, ... , tN . As a performance measure, the cost function can be
formed by:
N
F(x) =
L
aF
f?(x). (2.10)i=l
where a, can be chosen to reflect the reliability of the signal received at the
measuring unit i, and.fi(x) is given as follows:
(2.11)
where cis the speed of light, and x = (x,
y,
t/ .
This function is formed for eachmeasuring unit, i = 1, ... , N, and.fi(x) could be made zero with the proper choice
of x, y, and t. The location estimate is determined by minimizing the function F(x).
However, in real time scenarios and in indoor environments, multipath components arrive at the receiver resulting in different time stamps. In such multipath environments, accurate TOA estimation requires high-resolution time delay estimation techniques. Another difficulty that faces the use of this technique is in the areas where there is no direct line of sight. In the cases of non line of sight (NLOS), the received signal is not necessarily that of the direct path. This results in misleading information about the real distance that separates the transmitter from the receiver.
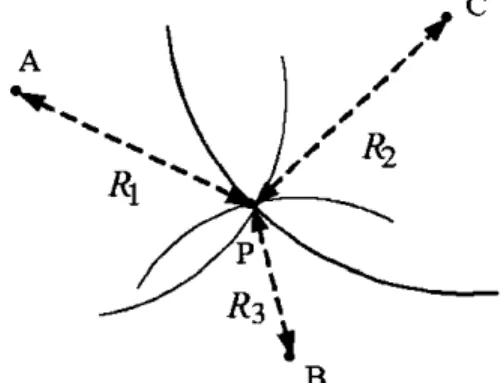
2.2.1.3. TECHNIQUE BASED ON THE TIME DIFFERANCE OF ARRIVAL (TDOA): Position estimation using TDOA depends on the difference in time at which the signal arrives at multiple measuring units. Since this technique is a triangulation technique. three reference nodes must be present in order to localize the transmitter. The base stations receiving the transmitted signal must be synchronized in order to precisely calculate the time difference of arrival at each base station. Correlation techniques are used to compute the TDOA estimates.
Suppose that the received signal at a receiver i is xi (t) = s(t- di)
+
ni (t) where s(t) is the transmitted signal. di and ni are the delay and noise at receiver i.respectively. Similarly. at receiver j. the received signal is xi (t) = s( t - da
+
ni (t) . The cross-correlation function of the two signals is calculated afterintegrating the lag product of the two received signals over a time period Tto give:
~
1fT
Rx x (T) = - xi(t)x1(t- T) dt.
i' J T
0
(2.12)
The TDOA estimate is the value t that maximizes
Rx x
(T). Given the case where'" J
there are three base stations A. B. and C with three TOA distances R1• R2• and R3•
each TDOA parameter determines a hyperbola for the position of the transmitter
(P) as shown in Fig. 2.3.
The transmitter must lie on a hyperboloid with a constant range difference
between at least two of the receivers. The equation of the hyperboloid is as follows:
) 2 2 2
- (xi -x)
+
(Yi -y)+
(zi -z) .where (xi,yi,zi) and (xi,yi,za are the coordinates of the fixed receivers i andj
respectively, and (x, y, z) is the position of the transmitter [24]. In a 2D scenario,
two hyperbolas are formed from TDOA measurements taken from the receivers A, B and C. The intersection of the two hyperbolas allocates the position of the
transmitter P. The solution of the hyperbolic equation can be conducted through
nonlinear regression. It can also be solved using the Taylor-series expansion
creating an iterative algorithm as shown in [25].
A
-·-' ·,_ ,. ... . \ _.P ...\
... ... B•
.
•
'
·,.. .. P
c
'·Figure 2-3 Localization based on TDOA measurements
Time synchronization must be performed between the base stations only unlike the TOA technique where synchronization involves the transmitter too.
Nevertheless, some other methods were proposed for the 802.11 wireless LANs
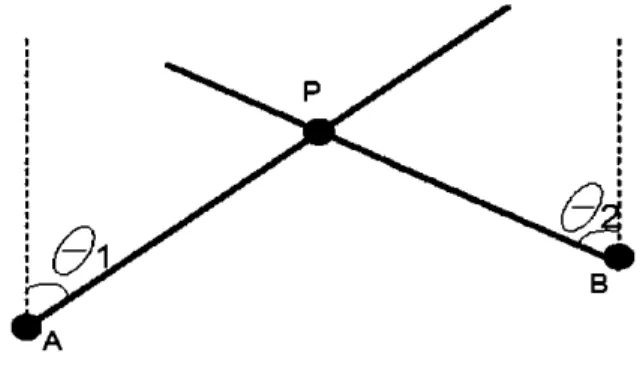
2.2.2. Angulation technique based on the Angle of Arrival:
In order to localize a transmitter based on the angle of arrival (AOA) in a 2D
scenario. at least two receivers should be present at a known separation distance. The transmitted signals from the mobile device are detected using directional antennas or an array of antennas that are able to measure the angles of arrival at each receiver. In a simple 2D scenario as shown in Fig.2.4. suppose that the transmitter is located at point P and the two receivers are located at points A and B. The receivers measure the angles of arrival of the transmitted signals. The position of the transmitter (P) is estimated based
on the intersection point of the two lines formed by the AOAs 81 and 82.
Figure 2-4 Localization based on the AOA
This method needs no synchronization but it requires more expensive antennas that need to be accurate in measuring the AOA. The precision of this localization technique depends on the environment and material used.
Localization based on the AOA is more applicable in open-space and in outdoor scenarios because the transmitted signals travel using the same path towards the receiver. However. in indoor scenarios signals are reflected and multipath components are formed. In the case of a reflected signal. the angle of arrival no longer represents the angle from which the signal was transmitted. These scattered signals arrive from different angles causing position estimation errors about the real position of the transmitter. The accuracy of this technique also depends on the precision of the antenna
in detecting the AOA because a small variation of the angle may cause a wide distance error.
2.3. Scene analysis or Fingerprinting
The fingerprinting technique is based on conducting a study campaign on the medium or environment where the localization system will work. This study collects information about how the transmitted signals are received at different positions away from the transmitter. At each position, the desired parameters of the received signals are extracted then they are saved in a database as signatures or fingerprints for their specific distances. Once the study is conducted for all the area of interest, the measurement campaign is over and the system would need a matching algorithm in order to find a
relationship between the set of fingerprints and their corresponding positions. In the
online stage, this matching algorithm uses the currently observed signal and previously collected information to figure out an estimated position of the transmitter.
The fingerprinting technique is mostly used in the scenarios where the channels cannot be easily modeled due to the distortions that the signals encounter before
reaching a specific position. In an indoor environment, for example, the signals are
reflected several times before reaching a measuring unit which weakens the signal and causes the RSS to decrease. The same thing applies for the other parameters such as AOA, TOA, or TDOA. Simple mathematical models will no longer hold for such scenarios, and a special investigation may be performed for such a channel using the fingerprinting technique. The main challenge facing this technique is its ability to match different recorded parameters at different positions and create a new mathematical model that can estimate any new received signal with low distance error. Several matching algorithms are present and used in the field of scene analysis such as
probabilistic methods, k-nearest-neighbor (kNN), artificial neural networks, support
vector machine (SVM), and smallest M-vertex polygon (SMP). A summary of each technique is presented below:
2.3.1. Probabilistic Methods
The probabilistic method 1s one of the algorithms that deal with position
estimation as a classification problem. Considering that there are several
locations Lv L2, L3 ... Ln, and pis the observed signal vector holding information about
the RSS, AOA and/or TOA of the received signal, a position is estimated based on the highest probability of the signal's vector as follows:
Choose Li if P(Li\p)
>
P(Lj\p)for i,j=t-j.
1,2,3 .. nand i
(2.14
Here P(L;\P) is the probability that a signal vector pis at a location L;. Given that the
signal vectors are recorded for all the locations in the area interest, once a signal is
received the vector p is extracted and classified giving the location with the highest
probability. Another method uses the Bayes' formula assuming that P(L;) = P(Lj ), the
decision rule becomes:
Choose Li if P(p\L;)
>
P(p\Lj )fori, j =t-j.1,2,3 .. nand i
(2.15
P(p\L;) is the probability that the signal vector pis received given that the mobile node
is located at L;.
Unlike the histogram approaches discussed above, other methods use the kernel approach assuming that the likelihood of each location has a Gaussian distribution with a calculated mean and standard deviation. If we consider that the measuring units in the medium are independent, we may calculate the overall likelihood of a location by directly multiplying the likelihoods of all measuring units. The estimated 2D location
(x, y) may interpolate the position coordinates and give more accurate results. It is a
n
(x,y)
=I
(PCL;Ip)Cxt,,YLJ)
(2.16i=l
Probabilistic methods also include issues such as memory, history and calibration where learning and assisted tracking takes place. This helps the localization system to be "smarter" avoiding any illogical estimation caused by mathematical errors.
2.3.2. K-Nearest-Neighbor (kNN)
Another way of matching the received signal to the set of signatures saved in the
database is based on the kNN. This technique searches for the k (positive integer) closest
matches or candidates in the saved set of measurements according to the root mean square principle. These nearest neighbors are averaged by adopting the distances in the
signal space as weights and the technique is called weighted kNN. The weights w, are
proportional normalized distances of the nearest neighborhood vectors as:
(lJ
J i = 1,2,3, ... k; n'\'w=l·
L ' ,
i=l (2.17 (2.18where d, is a distance to the
i'h
neighborhood vector, and k is the number of nearestneighbors. The sum of all weights equals to one in order to ensure that the nearest neighbors in the vector space get weighted more heavily. In a 2D space, the estimated
n
(x,y)
=,Lew,*
p;) (2.19i=l
where p, = (x,, y;) is the location of the nearest neighborhood vector.
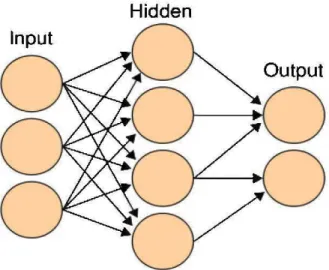
2.3.3. Artificial Neural Networks (ANNs)
Artificial neural networks are defined as computational models capable of approximating a function. Each neural network is made up of three layers, the input, hidden, and output layer. The main role of the ANN is to model the mathematical relations between the set of inputs and outputs that are under study. As shown in Fig.
2.5, each layer consists of neurons that are connected through weights and biases. In the
case of localization; the input layer would consist of a set of parameters extracted from the received signals such as the RSS, TOA, TDOA and/or the AOA, while the output is mostly the coordinates of the transmitter or the distances separating the transmitter from the measuring units.
Two phases are needed in every neural network technique; the first is the training phase while the second is the recall phase. In the training phase, the weights and biases are adjusted between the neurons in order to model the mathematical relationship between the set of inputs and outputs. After a specific number of iterations or when the performance reaches a desired value, the training phase stops saving the weights and biases at specific values. The neural network would be ready to perform the second phase which is the estimation of any input as a result of the computed model. The difference between the real value of the output and the estimated value is the estimation error.
Hidden
Figure 2-5 Sample Neural Network
Localization problems need nonlinear regression models, and there are two types
of neural networks that perform non linear regressions. The first is the multilayer perceptron (MLP) which represents the most prominent and well researched class of ANNs in classification, implementing a feedforward, supervised and hetero-associative paradigm. The second is the radial basis function (RBF) network which is also a multi-layer network that can be used for function approximation and classification, but it
works in a significantly different way. In perceptron-type networks, the activation of hidden units is based on the dot product between the input vector and a weight vector.
While in RBF networks, the activation of hidden units are based on the distance between the input vector and a prototype vector.
Measurement campaigns are always needed for such a technique in order to collect the fingerprints to be used for the training process. The merit of using neural networks is its ability to predict positions that are not introduced to the network before, which makes the localization system more fle xible with the simple variations of the signature values.
2.3.4. Support vector machine (SVM) and Smallest M-Vertex Polygon (SMP)
regressiOn. It is widely discussed in [26] and [27] and it has been proposed for localization using the fingerprinting technique. Support vector classification (SVC) is used to classify the location of the user between several locations based on the extracted parameters of the received signal. Other techniques use the support vector regression (SVR) which have been successful in position estimation using fingerprinting [28][29].
On the other hand, the Smallest M-Vertex Polygon (SMP) uses several measuring units in order to estimate the position of the transmitter. After estimating several locations at each receiver, one candidate is taken for each node forming vertices
in the shape of a polygon. M is considered to be the number of candidates whose
coordinates are averaged in order to estimate the location of the transmitter [30].
2.4. Modern Localization Systems
So far, we have discussed major localization techniques and algorithms that are proposed or used in the localization theory. In real time applications and products in the market, one can find different systems designed using different positioning techniques. There are advantages and disadvantages for each type of design based on its performance and compatibility with the medium where it functions. Before listing different systems, we will discuss a pattern of comparison by studying the major factors that increase or decrease the performance of each system.
2.4.1. Fundamentals of localization systems
For every localization system there are several measures to consider before using the system for any outdoor or indoor application [31]. The performance of a positioning system depends on several factors such as accuracy, precision, scalability, complexity, robustness, and cost.
2.4.1.1. ACCURACY
Accuracy is the most important factor of a positioning system. It is
the estimated location and the real location of the transmitter. In some applications such as military positioning systems, accuracy is the most important factor and it can be traded for complexity and cost, whereas in commercial positioning systems, accuracy and cost must balance in order to attract the attention of a consumer.
2,4, 1 ,2, PRECISION
The positioning system may be accurate but not all the time, this defines how precise the system is. Precision considers how consistently the system works in different scenarios and given different measurements and types of data. The accuracy of a positioning system may hold for a typical set of data. However, different accuracies may be recorded for other measurements at different positions. A study can be made to measure both the accuracy and precision of the system using the Cumulative Density Function (CDF) plot, which defines the probability that a system holds for a given accuracy.
2.4.1.3. COMPLEXITY
The complexity of the positioning system involves factors like computation time, memory, hardware structure, software design, energy
consumption, and implementation. If the localization system is installed at the
mobile unit, the factors of memory and battery life are to be considered in addition to the processing speed. Other localization systems may be perfect but lack the simplicity factor of software and hardware design. Complexity is mostly imposed with high accuracy and precision of positioning systems.
2.4.1.4. ROBUSTNESS
In real time scenarios, signals transmitted sometimes fade or scatter forming new sets of signatures, the more robust the localization system is, the more capable it is to predict these variations in the time and space domain. Robustness is the ability to keep the system stable once the received
information is corrupted. A robust system is capable of overcoming factors such as reflections, distortions and instability of wireless communications.
2.4.1.5.SCALABILITY
Scalability is an important factor to consider in localization techniques. The system is considered scalable in space once the variation of the distance separating the transmitter and receiver has no effect on the position
estimation. In crowded areas where there are several transmitters to be
localized, system's scalability may be measured based on its ability to localize several units throughout the whole lD, 2D or 3D space.
2.4.1.6. COST
The cost of the localization system depends on the complexity of its hardware and software designs, it also depends on the integration factor and time compensation. By integration we mean whether the system can be built using a ready infrastructure or whether it needs a new communications infrastructure. The time the system needs to be implemented increases the cost and so does the complication in hardware design. The margin of acceptable price of a localization system depends on whether the system is used by armies or individuals and whether the system is worth paying for or not.
2.4.2. Examples of modern positioning systems
The localization systems present nowadays are both for outdoor and indoor applications. On the same hand, we can differentiate between two different types of localization systems depending on whether the system works separately or combined with an existing technology. Systems that work separately need their infrastructure and their main application is to localize the mobile unit or transmitter using special hardware and software solutions. From those systems we can mention the GPS which needs at least three synchronized satellite systems in order to localize a 2D position and four
satellites to localize a 3D position. Other types of systems rely on existing technologies
such WLAN, UWB, or Bluetooth. In the following some indoor localization systems are
presented shedding the light on the algorithms of localization they use and their major performance attributes.
2.4.2.1. GPS- BASED
The most successful positioning system used for outdoor applications is the Global Positioning System (GPS) [32]. The main concept of GPS is the use of up to four satellite systems which are time synchronized. These satellites transmit signals at the same time to earth; these signals are received by a measuring unit that uses the time information to localize itself. Based on that technology, several companies started other localization systems in order to cover indoor environments too and increase the accuracy of G PS in indoor app li cations.
SnapTrack is one system; it is an assisted GPS (A-GPS) system that provides 5 to 50 meters accuracy in indoor environments. The concept of this technique is to use a location server with a reference GPS receiver that detects the satellite signals at the same time as the wireless mobile unit. The mobile unit collects both the satellite and location server signals in order to produce a position estimation.
Atmel and U-blox announced a new technology called SuperSense using a GPS software for indoor positioning. Another system was also produced by Locata Corporation and it was called Locata. This technology is based on the
time-synchronized pseudolite transceiver called a LocataLite [33]. Using
Locata, GPS-like signals are transmitted and used for position estimation based on the carrier-phase measurements.
2.4.2.2. RFID BASED
RFID is a technology based on transmission and reception of electromagnetic signals in order to retrieve certain information. An RFID system is made up of three major components which are the RFID tags. RFID receivers. and the RFID communication that connects the tags to the receivers [34]. The tags are supposed to emit data which is received by the RFID receivers through a communication link that is governed by a specific radio frequency and a defined protocol of communication. RFID tags may be active or passive. Passive tags are lighter and less complicated than active tags. They can operate without a battery and their major goal is to reflect the signals transmitted from the RFID receiver after adding information to that signal by modulating it. The range of passive tags is limited to I or 2 meters and a good
example of such systems are the RFID passive tags manufactured by Bewator.
On the other hand. active tags are more advanced because of their ability to transmit signals up to tens of meters (usually they transmit their IDs). They are ideally suited for the identification of high-unit-value products moving in
a harsh assembly process. One known manufacturer of Active RFID is Wave Trend Technologies and one of the known position sensing systems that use this technology is SpotON [35]. SpotON depends on the RSS in order to estimate the distance to the tags.
Another system that uses the RFID technology is LANDMARC [36]. This system also relies on the RSS from the tags and uses the kNN algorithm in order to estimate the position.
2.4.2.3. CELLULAR-BASED
In cellular networks such as GSM or CDMA. the position of the users is an important measure used for detecting fraud and emergency calls. Some
this technique remains inaccurate and dependant on the area of the cell itself and the error ranges between 50 to 200m [37].
Some work has been presented for indoor localization purposes using the GSM network and it uses the fingerprinting technique combined with the kNN matching technique [38]. The idea of this localization solution is to use the wide signal's strength from multiple base stations covering the area and different channels. These measurements form signatures that are matched using the kNN in order to estimate the position of the mobile phone with an accuracy as low as 2.5 meters [38]. Nevertheless, this technique is considered inaccurate in places where there is lack of coverage from different base stations at the same time.
2.4.2.4. ULTRA WIDE BAND (UWB)
Ultra wide band technology is one of the growing domains due to its special characteristic over the communication channels. UWB works by sending short pulses with low duty cycle over a wide band (even greater than 500Mhz). This technology has important advantages ranging from its low power consumption to its great propagation abilities. UWB tags need less duration to be transmitted than RFID tags and can operate across a board area of the radio spectrum. UWB is considered suitable for indoor environments due to the fact that the received signals may be easily filtered excluding the multi path components.
Some systems use UWB for indoor localization such as the Ubisense system which is a unidirectional UWB location platform with a conventional bidirectional time division multiple access (TDMA) control channel. This system works by creating sensor cells where each cell needs at least four sensors. The sensors use the TDOA combined with the AOA techniques in order to locate the tags that transmit the UWB signals. Another system is used
continuous wave radar principle (FMCW) which relies on the received time-of-flight (RTOF).
2.4.2.5. WIRELESS LAN (WLAN IEEE 802.11)
WLANs are the most growing communication networks m industries and enterprises. In the last couple of years, almost most applications including data transfer, communications, networking and voice applications were developed using the IEEE 802.11 standards. For that purpose, localization systems working under such standards would attract the attention of many people that would prefer to use the IEEE 802.11 infrastructure instead of installing a new one. The positioning systems that use the WLAN use the RSS as a parameter to build on and record an accuracy of 3 to 30m.
One of the systems was proposed by Bahl et al for in-building user
location and tracking system-RADAR using the kNN in signal-space technique. The accuracy of the RADAR system is about 2-3meters and it has two approaches. The first works on the empirical measurements of access point signal strength in offline phase while the second uses the signal propagation modeling.
Another system is called the Horus system and it is discussed in [39] [40]. This system uses the probabilistic method with an accuracy of2.1m for more than 90% of precision. Other systems use the neural network techniques with fingerprinting in order to estimate the position of the transmitter and report an error of less than 3 meters for 90% of precision [3]. One uses UWB technology [ 4] while others develop a grid-based Bayesian location sensing system [41].
There are several other localization systems that were designed to work under the WLAN technologies and it would be useful to check [42]-[55] for more approaches and designs.
2.4.2.6. BLUETOOTH
Bluetooth is a wireless technology based on the 2.4 GHz ISM band with a bit rate around lMbps and a typical range between 10 to 15 meters. Some localization systems used this technology to launch their approaches and designs such as Topaz local positioning solution which is based on Tadlys" Bluetooth infrastructure and accessory products. This system provides local accuracy of2 meters for 95% of precision. Another system is proposed in [56] as the Bluetooth Local Positioning Application (BLP A). This system uses a simple propagation model and Kalman filter to compute a 3D position estimate with a 3.76m distance error.
These are some of many localization systems and approaches present in the literature and in modern research laboratories. These systems along with their performance factors are summarized in Appendix B by referring to [ 1. Table 1].
CHAPTER
3-
LOCALIZATION IN MINES USING
FINGERPRINTING AND
NEURAL NETWORKS
Localization using the fingerprinting technique is based on collecting information about specific events and then matching the presence or absence of those events based on the pre-acquired data. Fingerprinting techniques can be used in indoor localization approaches in order to identify the channel at different parts of the covered
area [8], [ 1 0], [ 11]. It is similar by analogy to the human fingerprints and it is used here
to ensure uniqueness and precision to the indoor channel behaviour present in mines. In
this work, the fingerprinting technique is used to identify a position based on the channel impulse response (CIR). This technique consists of two phases: the offline phase which is the process of collecting several parameters from the impulse responses at several distances from the receiver and then storing the information in a database. The second phase of the fingerprinting technique is the real-time phase where in online scenarios the parameters are extracted from the CIR and then compared to the saved
database in order to match a specific position. In the following, the same approach in [3]
is discussed along with the different parameters that form the fingerprint of any position. A signature or a fingerprint is a set of seven parameters (discussed below) at a specific distance to the transmitter. The characteristics of the channel and the way to extract
those seven parameters out of the received signals are fully presented below. In the
second part of this chapter, the principle of using those fingerprints with the neural network technique is discussed and analyzed shedding the light on the major merits and drawback this technique may encounter when used in underground environments such as mmes
3.1. Fingerprinting and Wireless Signals
When a signal is transmitted wirelessly through a medium, it is affected by the nature of the environment where propagation is taking place. For wireless signals transmitted in underground mines, the signals are reflected and scattered several times
before being received, and these reflections create multiple copies of the same signal with different phase shifts and time delays. Multiple copies of the same signal are called the multi path components of that signal. So practically, at the receiver's end, one can record multiple versions of the same signal with different variations (or distortions) of its original characteristics. The mathematical model that represents how a transmitted signal is received at another end is called the transfer function of the medium and it can be in both the frequency and time domains as follows:
L(s,t)
H(s,t,f) =
I
Pi(s,t). ej8,(s,t). e-j2rr[T,(s,t).i=l L(s,t) h(s, t, T) =
I
Pi (s, t). ejB,(s,t). o(T- Ti (s, t)). i=l (3.1) (3.2)where Pi (s, t), Ti (s, t) and 8;(s, t) are random variables that represent the sequence
amplitude, time of arrival and the phase of arrival, respectively. L(s, t) is the total
number of multi path components defined at time t and spatial position s. 8 ( T - Ti (s, t ))
represents the Dirac distribution and i stands for the index of the multi path component.
In the following we will consider that the channel is time invariant, i.e. there is no spatial variation between the transmitter and receiver due to any human or natural activity. In such case the time can be eliminated from the above equations and a simple representation of the channel impulse response becomes:
L(s)
H(s,f)
=I
Pi(s). ej8,(s). e-j2rr[T,(s).i=l L(s) h(s,t) = IPi(s). ejBJsl.o(T-Ti(s)). i=l (3.3) (3.4)
where p1 (s), r1 (s) and 81 (s) are functions of space only. The received signal is a result
of convolution between the transmitted signal and the complex channel impulse response. After finding how the signals are affected by the medium by comparing the transmitted and received signals, the CIR.s are concluded in both the frequency and time domains.
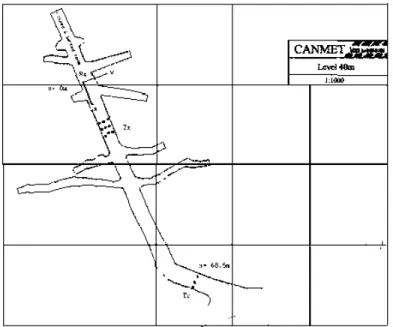
Real-time measurement campaigns were carried out 70 meters underground in the CANMEr gold mine in Val d'Or city [3], [4]. The measurements in [3] were used in this work and they were recorded at a central frequency of 2.4 GHz in order to have a compatibility with WLAN systems. They consist of 450 measurements taken along a gallery as shown in Fig. 3.1. The complex CIR of the wideband measurements has been obtained using the frequency channel sounding tedmique [3]. Once a signal is received, the channel impulse response is extracted and by applying the inverse fast Fourier transform (IFFT), the time impulse response is obtained.
~
--'.\..__.-)
c~~
~-*'~
..
.
~-,_
··c:
-~Y.A
\:
.
_;,.
~~~
\
·-~
....
.,
Using this impulse response, one can extract several parameters to form a specific signature. Seven parameters for each CIR guarantee uniqueness to the position of the transmitter. The parameters are as follows:
• The mean excess delay (f) that is the first moment of the power delay profile
measured at the first detectable signal that arrives at the receiver and is related to
the power of that profile. In other words it is related to the amplitudes akof the
multi path components k, and it is given by:
f= (3.5)
• The root mean square (Trms ), and it represents the square root of the second
central moment of the power delay profile and it is given by:
(3.6)
and (3.7)
• The maximum excess delay ( T rms) which is the time at which the signal drops
below X dB of the maximum power measured in the power delay profile. It can
be seen as the time that a signal stays above a given threshold based on the
highest received power in a profile. In the following, the value of 20 dB is taken
as a threshold.
• The total power of the received signal (P), it is measured in dam. It can be
calculated by combining the square of the amplitudes of all the multipath components as follows: