UNIVERSITE DU QuEBEC EN ABITIBI-TEMISCAMINGUE
LA ROLE DES BRYOPHYTES DANS LES MECANISMES D'ENTOURBEMENT DES FORETS D'EPINETTE NOIRE DE LA CEINTURE D' ARGILE
DU QuEBEC ET DE L'ONTARIO
THESE PRESENTEE
COMME EXIGENCE P ARTIELLE
DU DOCTORAT EN SCIENCES DE L'ENVIRONNEMENT
PAR NICOLE FENTON
Mise en garde
La bibliothèque du Cégep de l’Témiscamingue et de l’Université du Québec en Abitibi-Témiscamingue a obtenu l’autorisation de l’auteur de ce document afin de diffuser, dans un but non lucratif, une copie de son œuvre dans Depositum, site d’archives numériques, gratuit et accessible à tous.
L’auteur conserve néanmoins ses droits de propriété intellectuelle, dont son droit d’auteur, sur cette œuvre. Il est donc interdit de reproduire ou de publier en totalité ou en partie ce document sans l’autorisation de l’auteur.
REMER ClEMENTS
Le succes de ce projet repose, entre autre, sur un support financier adequat qui m'a permis de me concentrer sur mon travail. Le CRSNG, le reseau des coupes partielles, la fon~t modele du Lac Abitibi et la Chaire en amenagement forestier durable ont contribue a mon salaire et a mes depenses de terrain. Le Reseau sur Ia Gestion Durable des Fon~ts et le GREFi m'ont accorde des bourses qui m'ont permis d'aller a l'etranger afin d'y rencontrer d'autres idees et surtout d'autres bryologues, une espece rare au Canada.
J'ai beneficie d'un support technique continu. Herve Bescond etait mon guide pour le reseau de coupe partielle. Danielle Charron connait Ia reponse aux questions sans reponse. Le soutien moral et technique de Bruce Bagnell m'a permis de terminer }'identification de sphaignes sans perdre mon equilibre mental. Bernhard Denneler s' est charge de me fournir d'un microscope qui est plus qu'adequat pour l'etude des bryophytes. Marie-Helene Longpre a offert un soutien continua partir de rna premiere journee a UQAT, et elle continue a contribuer au succes de nombreux projets a Rouyn-Noranda.
Mercia Kim Taylor pour tout son soutien pour mon projet. Son niveau d'implication m'a touche et ses commentaires etaient toujours pertinents. Art Groot et David Pare ont taus les deux offerts leurs temps et leurs expertises etj'ai beaucoup appris pendant nos conversations. Ma directrice de memoire de maitrise, Kate Frega, continue a etre une source de bonnes critiques et d ' encouragement. Mon comite d'encadrement, Louis DeGrandpre et Denis Gignac, m ' a toujours offert des critiques constructives, qui m ' ont aidees a ameliorer mon travaille et rna reflexion.
J'ai profite de l' amitie et l'aide de beaucoup de personnes sur le terrain. Maude Beauregard, Suzie Rollin et Mylene Francoeur se sont impliquees dans le projet sans mefiance pour les bryophytes. Catherine Beland n'a pas juste ete une aide de terrain, elle est devenue une amie, en qui j ' ai autant confiance, sinon plus qu' en moi-meme pour recolter de bonnes donnees.
A
cause de son amitie, ces deux etes de terrain se sont deroules dans un plaisir continue!.J'ai ete chanceuse dans la cohorte d'etudiant avec quij'ai partage mon temps a UQAT. Les etudiants de la Chaire forment un groupe qui s 'entraide et prend un interet reel dans les projets et la vie des unset des autres. J'aimerais particulierement mentionner Elise Vincent et Delphin Ruche qui m'ont beaucoup aide a m'adapter ala culture quebecoise, malgre qu'ils soient franyais! Les plus beaux souvenirs demon projet sont les discussions animees a propos de la region au nord de La Sarre avec Annie Belleau, Nicolas Lecomte et Sonia Legare. Leur intelligence, dynarnisme et humour ont donne fruit a de riches collaborations et aussi a de grandes amities. J'espere qu'on va continuer de rire et de travailler ensemble dans le futur.
Mon directeur, Yves Bergeron, ne m'ajamais dit non quandj'ai propose un petit projet (en extra bien sur!) ou voyage. J'ai beaucoup apprecie sa confiance en moi, les opportunites qu'il m'a offertes et la liberte qu' il m'a accordee, autant sur le terrain que dans la redaction de mes articles. Ces commentaires sont toujours constructifs et tres pertinents. J'espere continuer a profiter de sa vision large et integratrice dans des projets futurs .
Je remercie mes arnis, geographiquement proches ou lointains, qui ont continue a m'aimer malgre que je ne leurs parlait pas souvent. Mes parents m'ont toujours encourage dans toutes mes entreprises, et ils ont accepte mes choix, parfois tres bizarres sur le coup ( comme demenager a Rouyn-Noranda). Je pense que c'est a cause de ce soutien que mes projets reussissent si bien.
I would also like to thank Pierre, for his patience and understanding. He never complained when I worked at night or on the weekend. But more than anything else, it's the balance and mental space that his continual support and our daily gave me that helped me through the difficult times and allowed me to succeed.
111
AVANT -PROPOS
Malgre que je sois la premiere auteure de tous les chapitres de cette these, tous les chapitres ont au moins un co-auteur. Selon la tradition academique, Yves Bergeron, mon directeur de these, est co-auteur de tousles chapitres. Le chapitre 1 est le fruit d'une collaboration intellectuelle entre Nicolas Lecomte, Sonia Legare et moi-meme. Par contre, la collecte des donnees et les analyses sont entierement de moi. J'ai ecrit le manuscrit avec des
commentaires et suggestions des co-auteurs. Le chapitre 2 resulte d'une etude en collaboration avec Sonia Legare. On a planifie l'etude, recolte les donnees, analyse les donnees et ecrit le manuscrit ensemble. Par contre, je suis premiere auteure parce que je me suis occupee du processus de publication, ainsi que de le plupart des corrections. Les analyses et le premier jet du texte eut le projet d'initiation ala recherche demon aide de terrain Catherine Beland. Sylvie DeBlois, de McGill, etait sa directrice pour cette entreprise. Par la suite j ' ai substantiellement change les analyses et le texte.
AVANT -PROPOS ... ... ... III TABLE DES MATIERES ... IV LISTE DES FIGURES ... IX LISTE DES TABLEAUX ... XIII RESUME DE LA THESE ... XVII
INTRODUCTION GENERALE ... 1
0.1 LA FORET BOREALE ... 1
0.1.1 Les feux de foret ... 1
0.1.2 Les bryophytes ... ... 2
0.2 L'ENTOURBEMENT ... 3
0.3 L'AMENAGEMENT FORESTIER ... 4
0.4 OBJECTIFS ... 4
CHAPITREI
PALUDIFICA TION IN BLACK SPRUCE (PICEA MARIANA) FORESTS OF EASTERN CANADA: POTENTIAL FACTORS AND MANAGEMENT IMPLICATIONS ... 61.1 ABSTRACT ... 7
1.2 INTRODUCTION ... 9
1.2.1 Study Area ... 10
1.3 MATERIALS AND METHODS ... 11
1.3.1 Data Collection ... 11
1.3.2 Statistical Analyses ... 12
1.4 RES.ULTS ... 12
1.5 DISCUSSION ... 18
1.5.1 Time since fire and fire severity ... 18
1.5.2 Forest floor thickness after high severity fires ... 19
1.5 .3 Management implications ... 20
1.5.4 Conclusions ... 21
v
CHAPITREII
SOIL OXYGEN WITHIN BOREAL FORESTS ACROSS AN AGE GRADIENT ... 22
2.1 ABSTRACT ... ... ... ... ... .... .. ... .. ... ... .. ... .. ... ... ... ... 23
2.2 INTRODUCTION ... .. ... .... ... .... .... ... .. ... ... . 24
2.3 STUDY AREA ... ... ... ... ... ... .... ... ... ... ... ... ... ... ... ... . 25
2.4 MATERIALS AND METHODS ... ... ... ... ... .... ... 25
2.4.1 Experimental design .... ... ... ... ... ... .. ... ... ... ... ... 25
2.4.2 Statistical analyses ... ... ... .... ... ... ... 28
2.5 RESU.LTS ... .... ... ... ... ... ... ... .... ... ... ... ... ... ... ... 29
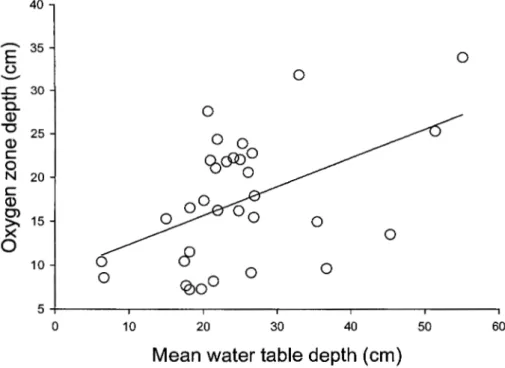
2.5 .1 Relationship between oxygen zone and water table ... ... ... .. .. ... .. ... 29
2.5 .2 Relationship between oxygen zone and age ... ... ... ... ... 32
2.6 DISCUSSION ... ... ... ... ... ... .... ... ... 35
2.6.1 Relation between oxygen zone and water table .. ... ... ... . 35
2.6.2 Factors influencing oxygen zone depth within a stand age ... ... .... .... ... .. ... 36
2.6.3 Changes in soil oxygen in association with time since fire .... ... ... .. ... 37
2.6.4 Rate of oxygen zone rise ... ... .... ... 38
2.6.5 Conclusions .. ... ... ... ... ... ... ... ... ... ... ... 39
2.7 ACKNOWLEDGMENTS ... ... ... ... ... ... ... ... 39
CHAPITRE III FACILITATIVE SUCCESSION IN A BOREAL BRYOPHYTE COMMUNITY DRIVEN BY CHANGES IN AVAILABLE MOISTURE AND LIGHT ... ... ... .. ... ... ... .40
3.1 ABSTRACT ... ... ... ... ... ... ... .. ... ... ... ... ... .... .... ... ... ... 41 3.2 INTRODUCTION ... ... ... ... .. .... ... 42 3.3 STUDY AREA ... ... ... ... ... ... ... 43 3.4 METHODS ... ... ... ... ... ... ... ... 44 3.4.1 Sampling ... ... .. ... ... ... ... ... ... ... ... ... ... ... 44 3.4.2 Analyses ... ... ... ... ... ... ... . 49 3.5 RESULTS ... ... ... ... ... ... 51
3.5.1 Variation in species composition ... .... ... ... ... ... ... ... ... ... 51
3.5.2 Relationship between community change and habitat variables ... ... ... 54
3.5.3 Species-habitat relationships ... ... .. ... ... ... 55
3.6 DISCUSSION .... ... ... ... ... ... ... ... ... .... ... ... .... ... 59
3.6.1 The role of the enviromnent in changes in community composition ... ... 59
3.6.3 Available moisture ... ... ... .. ... ... ... .... ... 60
3.6.4 Ericaceous species ... ... ... 61
3.6 .5 The role of non-equilibrium factors in changes in community composition ... 62
3.6.6 Succession and competition theory ... ... .... .. ... ... .. ... 62
3.7 ACKNOWLEDGMENTS ... ... ... ... ... ... ... ... 63
CHAPITREIV SUCCESSION IN A BOREAL BRYOPHYTE COMMUNITY: FACILITATION OR TOLERANCE ... ... ... ... ... ... ... ... ... ... .... .. 64 4.1 ABSTRACT .... ... ... ... ... 65 4.2 INTRODUCTION ... ... ... ... ... ... ... ... ... .. ... ... .. ... ... . 67 4.3 METHODS ... ... .. ... ... ... ... ... ... ... ... 70 4.3.1 Study site ... ... .. ... ... ... .... ... ... ... ... ... 70 4.3.2 Experimental design ... ... ... ... ... ... .... ... 72 4.3.3 Transplant method .... .. ... ... ... ... .... ... ... ... 73 4.3.4 Statistical analysis ... ... ... ... ... ... ... ... ... 74 4.4 RESULTS ... ... ... ... .. ... ... ... ... ... 75
4.4.1 Hypothesis 1: Facilitative succession ... ... ... ... ... ... ... . 75
4.4.2 Hypothesis 2: Competitive overtopping via differential growth rates ... ... 77
4.5 DISCUSSION ... .... ... ... ... ... ... 80
4 .5.1 Hypothesis 1: Facilitative succession .... ... .... ... ... ... 80
4.5.2 Hypothesis 2: Competitive overtopping via differential growth rates ... ... 81
4.5.3 Conclusions ... ... ... ... 83
4.6 ACKNOWLEDGEMENTS .. ... ... ... ... ... ... ... ... .. 84
CHAPITREV SPHAGNUM SPORE AVAILABILITY IN BOREAL FORESTS .. ... ... 85
5.1 ABSTRACT ... ... ... ... ... ... ... ... .... .. ... 86
5.2 INTRODU.CTION· ... ... ... .... ... .. ... .... ... 87
5.3 METHODS .. ... ... ... ... ... ... ... ... ... ... 89
5.3.1 Study site ... ... .... .. ... .... ... ... .... 89
5.3.2 Study design and data collection .. ... ... ... ... ... 90
5.3.3 Spore trapping and germination ... ... ... ... . 92
5.3.4 Sporophytes ... ... ... ... ... ... 92
5.3 .4 Analyses ... ... ... ... .. .... ... ... .... .. .. ... ... ... ... ... 93
5.4 RESULTS ... .... .... ... .. ... ... ... ... ... ... ... 94
vii
5.4.2 Sporophytes ... ... ... .... ... ... ... .... .. .. ... ... ... ... 96 5.5 DISCUSSION ... ... ... .... ... ... ... ... 97 5.5.1 Spores ... ... ... 97 5.5.2 Sporophytes ... ... ... ... .... ... ... .... ... .... .... ... ... ... .. ... 98 5.5.3 Conclusions .... ... ... ... ... ... ... ... ... .... ... ... 99 5.6 ACKNOWLEDGEMENTS ... ... ... . 100 CHAPITREVI SPHAGNUMESTABLISHMENT AND EXPANSION IN BLACK SPRUCE (PICEA MARIANA) BOREAL FORESTS ... ... ... . 1016.1 ABSTRACT .... ... ... ... ... ... ... ... ... ... ... .. ... ... 102
6.2 INTRODUCTION ... ... ... ... ... ... ... 103
6.3 MATERIALS AND METHODS .... ... .. ... ... ... ... .. .. ... .. ... ... 104
6.3.1 Study Area .... ... ... ... 104
6.3.2 Sampling ... ... ... ... ... ... .... ... 105
6.3.3 .Data analysis ... .... .. ... ... ... .... ... .. .. ... ... ... ... .. 107
6.4 RESULTS ... ... ... .... ... ... ... ... .. 107
6.4.1 Sphagnum colonies .. .... ... ... ... .... ... ... ... ... ... ... ... 107
6.4.2 Sphagnum capillifolium colony establishment ... ... ... ... ... 108
6.4.3 Sphagnum colony expansion ... ... ... ... ... ... ... ... ... ... ... ! 09
6.4.4 Sphagnum colony density ... ... ... ... ... ... 112
6.5 DISCUSSION ... ... ... .... ... ... ... .. ... 113 6.5.1 Colony establishment ... .... ... .. .... .. ... ... .. 113 6.5 .2 Colony expansion ... ... ... ... ... ... ... 114 6.5.3 Colony density ... ... ... ... ... ... .. ... 115 6.5.4 Conclusion ... ... ... ... ... ... ... ... 116 6.6 ACKNOWLEDGEMENTS ... ... .. ... ... ... .... 117 CHAPITRE VII SPHAGNUM COMMUNITY CHANGE AFTER PARTIAL HARVEST IN BLACK SPRUCE BOREAL FOREST ... ... .... .. .... ... ... ... ... ... 118
7.1 ABSTRACT ... ... .. .. ... ... ... ... 119
7.2 INTRODUCTION ... .... ... ... ... .... ... ... ... 121
7.3 STUDY AREA ... ... ... ... ... .... ... ... 123
7.4 METHODS ... ... ... ... ... .... 123
7.4.2 Analyses ... 125
7.5 RESULTS ... 126
7.5.1 Disturbance effect ... 126
7.5.2 Species composition ... 128
7.5.3 Relationship between Sphagnum cover, composition, disturbance, and habitat variables ... 131
7.5.3 Patch growth measurements ... 131
7.6. DISCUSSION ... 133
7.6.1 Disturbance effect. ... 133
7.6.2 Patch composition and disturbance and habitat variables ... 134
7.6.3 Patch growth ... 136 7.6.4 Conclusions ... 137 7.7 ACKNOWLEDGEMENTS ... 137 CONCLUSION GENERALE ... 138 REFERENCES ... 142 APPEND ICE A ... 157 APPEND ICE B ... 160
Figure
1.1
LISTE DES FIGURES
Page Development of forest floor with time since (A) high and (B) low severity fires as mean thickness with standard error. Each point represents the mean of 20 values for each site ... 14
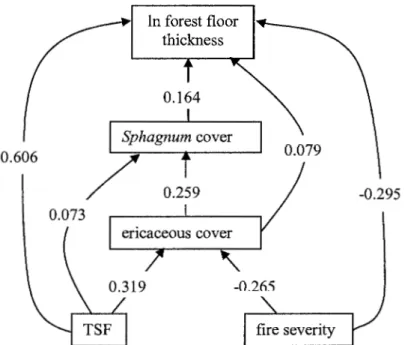
1 .2 Path analysis of factors affecting forest floor thickness after high and low
severity fires combined. The structure was not rejected by d-sep analysis (Shipley, 2000), p = 0.2989. Multiple regression indicated that 70% of the variability was explained by the included variables. An-ows and numbers
indicate the direction of causality and the path coefficient between two variables.16
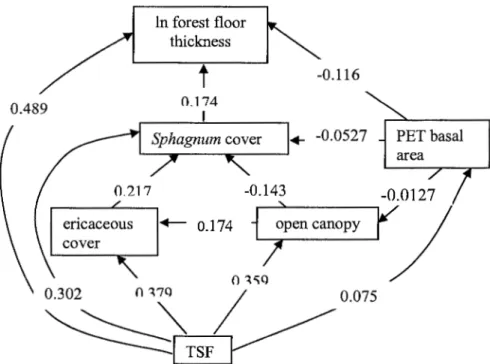
1.3 Path analysis of factors affecting forest floor thickness after high severity fires.
The structure was not rejected by d-sep analysis (Shipley, 2000), p = 0.725. Multiple regression indicated that 65% of the variability was explained by the included variables. An-ows and numbers indicate the direction of causality and the path coefficient between two variables ... 17
2.1 Water table depth (columns) and oxygen zone depth (dotted line) during the
sampling period. Mean water table depth was calculated using all 32 sampling units for each sampling days, bars indicate standard deviation ... 30
2.2 Relationship between oxygen zone depth and mean water table depth for the full
sampling period (oxygen zone depth= 9.10
+
0.33 (mean water table depth), R2= 0.2325, F value= 9.09, p = 0.0052, N = 32) ... 31
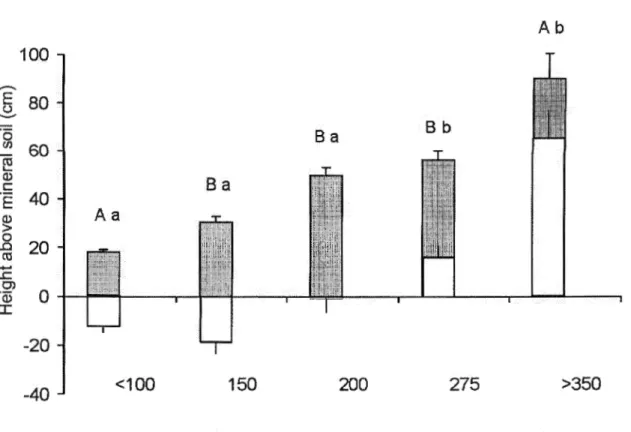
2.3 Changes in position of oxygen zone in soil profile with increasing tree age. Grey
bars indicate the thickness of the organic forest floor, while white bars indicate the position of the oxygen zone (i.e. oxygen index). Letters indicate statistical differences, capital letters differences in oxygen zone thickness (relative to the profile surface), and lower case letters differences in the position of the
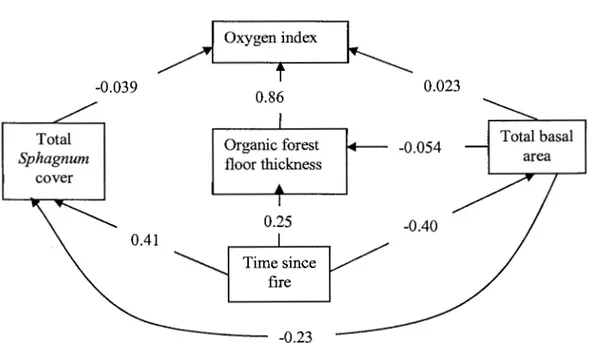
2.4 Path analysis of factors influencing oxygen index in black spruce
chronosequence. Values are path coefficients (partial correlations) of individual factors. The structure was tested with a D-Sep test based on Shipley (2000) and has a 0.86 probability ofbeing the correct structure ... 34
3.1 Location of study area within in the province of Quebec. The ecoregions where
the ClayBelt occurs is indicated, and may slightly overestimated the actual area.44
3.2 Detrended Correspondance Analysis of the total matrix of253 quadrats; axes 1
and 2. (A) Species plot. Only dominant species are indicated, position of other
species are indicated by*. For complete names see Appendix A. (B) Quadrat
plot with age classes indicated as follows: <1 00 TSF closed circles, 150TSF squares, 200 TSF diamonds, 275 TSF stars, >350 TSF open circles. Vectors for environmental variables were passively fit into the diagram. The arrows indicate strength of relationship with axes and direction of maximum change in the variable in question. Abbreviations are as follows : BAbF -basal area balsam fir, BAbS- basal area black spruce, BAjP- basal area jack pine, total BA- total basal area, LCR bF -live crown ratio balsam fir, LCR bS -live crown ratio black spruce, CWD 2 - coarse woody debris 2, CWD 4 - coarse woody debris 4. See Table 3.1 for a complete description of variables ... 53
3.3 Abundance of 6 species in response to canopy openness and water table index.
Circles indicate abundance and the Spearman correlation between species abundance and canopy operu1ess and water table index are indicated in the comers of the respective axes. Significant relationships are indicated with an *. The doted line indicates where the water table moves from the mineral soil to the organic forest floor ... ... ... 57
4.1 Location of study area within in the province of Quebec. The ecoregions where
the ClayBelt occurs is indicated, and may slightly overestimated the actual area. 70
4.2 Increases in length (in em; white) and mass (in g; black) of P. schreberi (top), S.
XI
each other's habitats, from June 2004 to September 2005. TheY axis indicates the habitat in which the stems were grown. Letters indicate statistical differences within variables; capital letters indicate differences between forest type (young vs old), and lower case letters indicate differences among habitat types. Values indicated A are smaller than those indicated B ... ... 76
4.3 Increases in length (in em; top) and mass (in g; bottom) of transplanted shoots in
the young forest from June 2004 to September 2005. TheY axis indicates the habitat in which the shoots were grown. Letters indicate statistical differences; capital letters indicate differences in habitats all species confounded while lower case letters indicated differences in species all habitats confounded. There were no differences in length among species or habitats. Values indicated A are smaller than those indicated B ... 78
4.4 Increases in length (in em; top) and mass (in% of initial mass; bottom) of
transplanted shoots in the old forest from June 2004 to September 2005. TheY axis indicates the habitat in which species were grown. Letters indicate statistical differences; capital letters indicate differences in habitats all species confounded while lower case letters indicated differences in species all habitats confounded. Values indicated A are smaller than those indicated B. The numbers above the bars in the % mass graph indicate the mean mass increase in grams for each species in its own habitat. ... ... 79
5.1 Precipitation (top) and degree-days (bottom) for Matagami, Quebec for 2002,
2003, 2004 and the mean of 1971-2000. Precipitation is the total for year in millimetres, and degree-days are the sum of the temperature of all days over 18°C. Data is compiled from the Environment Canada database ... 91
5.2 Mean and standard error of spore availability in three sites for each sampling
date in 2003 (top) and 2004 (bottom). Within a site, dates with a different letter are significantly different a<b<c ... 95
6.1 Observed and expected% frequencies of establishment substrates for S.
capillifolium colonies at different depths (em). Expected values were calculated based on percent cover of the substrate types observed on the forest floor ... 109
6.2 Relationships between colony area and (a) colony depth and (b) tree basal area.111
6.3 Relationships between Sphagnum colony density (g/cm3) and (a) Sphagnum
colony area (m\ (b) tree basal area (nl/ha), and (c) feather moss density
(g/cm3) •...•••.••.•....••••••...••...••.••..•... •••••...•.•...•••••.••...••... 113
7.1 Percent of cover of species in each patch per site and treatment type. Values are
means
+
standard error. Bars within a site with a different letter are significantlydifferent. Black, control; white, partial harvest; grey, low retention cut. ... 129
7.2 Area (m2) of species per site and treatment type. Values are means
+
standarderror. Bars within a site with a different letter are signitlcantly different. Black, control; white, partial harvest; grey, low retention cut. ... 130
7.3 Growth (em) of Sphagnum capillifolium among sites and treatments. Black,
control; white, partial harvest; grey, low retention cut. Letters indicated
differences in growth; capital letters indicated differences among treatments, and lower case letters indicated differences among sites ... 133
LISTE DES TABLEAUX
Tableau Page
1.1 Pearson correlation coefficients (Spearman for severity) among factors
influencing forest floor thickness, in all sites, and after high and low severity fires. Values in bold are significant at p 0.01 ... 13
1 .2 Direct effect, indirect effect and error terms for path analysis of forest floor
thickness in all sites, and after high and low severity fires. Total value represents the Pearson correlation coefficient (R 2) ... . . . ...•...•... 15
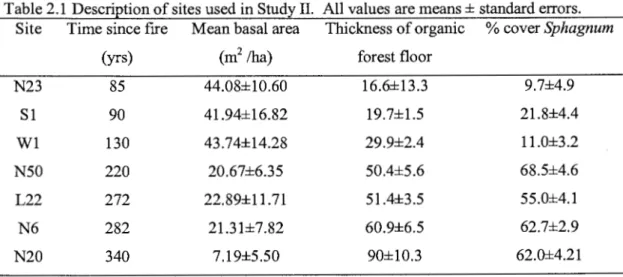
2.1 Description of sites used in Study II. All values are means± standard errors ... 26
2.2 Pearson's correlation coefficients between oxygen zone depth and water table
depth or mean water table depth for different intervals of time. Probabilities for
significance test are in parentheses, H0: Rho =0, N=32 ... .. ... 30
2.3 Pearson's correlations coefficients between oxygen zone depth and other
variables. Probabilities for significance test are in parentheses, H0 : Rho =0 ... 31
2.4 Correlation matrix of oxygen zone, oxygen index and potential explanatory
factors. Variables in bold are significant ... ... .. ... ... .. ... 34
2.5 Direct, indirect, error and total of explanatory factors used in path analysis to
explain variations in oxygenated index ... ... ... ... 35
3.1 Abiotic and biotic variables measured within 25 m2 quadrats in order to interpret
patterns in bryophyte species composition. Variables marked with an
*
weresignificant when tested individually in the partial canonical correspondence analysis. Classes of coarse woody debris decomposition were modified from Soderstrom (1987) ... .. ... ... .. .... ... .. ... ... .. ... ... 46
3.2 Mean and standard error of first and second axis scores from the DCA analysis
100m2 plot (from the four component quadrat scores), and then the mean was taken of the plot means and standard errors. A similar analysis was completed for individual sites and age groups ... 51
3.3 Correlation coefficients (Spearman's Rho) between DCA axes 1 and 2 and
environmental variables. Variables in italics indicate that they are significant.. 54
3.4 Cover of selected species in sites where the water table is present in the mineral
soil, compared to sites where it is present in the forest floor. Values are means and standard error, and letters indicate significant differences; a<b ... 56
3.5 Means and standard error for microclimatic variables in young (85 years) and
old (270 years) stands, for Sphagnum spp. and Pleurozium schreberi patches.
Significant differences (p<0.05) between species are indicated with capital letters, while differences between age classes are indicated with lower case letters (a<b). GLM model for rows in italics are significant, as is the interaction term between age and species, for more details on the model, see the methods section. TheN for high values indicates the number of times values exceeded the cut-off point. Values are means± standard error. ... 58
4.1 Mean (and standard error) values of open canopy over the habitat of each of the
species in young and old forests. Differences between species in each site were tested. The t-test of the young site had a p value of0.073, while the ANOVA for the old site was 0.054. Letters indicate differences order a>b ... 71
4.2 Reciprocal and control transplants performed in the young and the old stand.
Site indicates which forest age is described. Old-young indicates transplants that were between sites. Transplant species indicates the species that was
transplanted, while habitat species indicates the habitats into which it was transplanted ... 73
4.3 Number of low vigour transplants as indicated by colours with high value and
XV
5.1 Description of the three sites where studies were undertaken ... 90
5.2 Partial correlation (R2, p value) between spore abundance and habitat
characteristics for high (9 September) and low (23 September) abundance weeks in 2004. Distances between colonies were only measured at site 1, where discreet colonies were visible. Partial correlations are between spore abundance and the listed variable, while the other variables are held constant ... 96
5.3 Characteristics of patches with and without sporophytes in site 1. Values are
means and standard errors, and values followed by different letters are
significantly different, a<b ... ... 97
5.4 Habitat conditions of colonies with and without sporophytes in site 1. Values are
means and standard errors. Values followed by different letters are statistically different. ... 97
6.1 Description of survey sites. Time since fire is an estimation of the age of the
forest; basal area bS is the basal area of black spruce per hectare; basal area secondary species is the basal area of the second most prominent species per hectare, where bF = balsam f1r, La = larch, jP =jack pine, tA = trembling aspen; %CWD is the sum of the average coarse woody debris cover for all four decay
classes within each 25m2 quadrat; organic matter thickness as measured for each
25m2 quadrat; % exposed mineral soil for each 25m2 quadrat; % sphagnum
cover is the cover of all Sphagnum species within each 25m2 quadrat. All values
are means and standard errors ... 106
6.2 S. capillifolium expansion substrate frequency(%) and mean depth. Differences in mean depths, as determined by ANOVA (F 10.13, p<0.0001), are indicated by
letters a<b. Due to the small number of samples, Sphagnum was not included in
the ANOVA ... 110
7.1 Description of habitat tolerances of the species examined in detail in this study.
shaded and un-shaded habitats. Position relative to water table indicates is the habitat relative to the water table where the species are typically found. From Gignac, 1992; Mulligan and Gignac, 2001; Moore, 1989; Johnson and Damam, 1991; Fenton unpubl. data ... 125
7.2 Total Sphagnum (Spha.) area and mean Sphagnum patch characteristics by site
and treatment. The number in brackets indicates the number of patches found in each treatment per site. L.R. equals low retention. Values are means followed by standard error. Italics indicate significant differences within a site. The letters indicate statistical difference, a<b ... 127
7.3 Patch size and habitat variables by site and treatment. L.R. equals low retention.
Values are means of all patches per treatment per site followed by standard error. Italics indicate significant differences within a site. The letters indicate statistical difference, a<b ... 128
7.4 Direct (due only to the factor) and indirect (due to interactions with other
factors) coefficients (which indicate effect), error and total correlation for factors
as determined by path analysis for Ln total Sphagnum area, % S capill?folium, %
S fa !lax, and % Sfuscum. All included factors are significant. The likelihood that
the structure was correct is indicated by a p value for each model, and the % of
RESUME DE LA THESE
L'entourbement est le developpement d'une couche epaisse de matiere organique sur le sol en association avec la remontee de la nappe phreatique. L'entourbement est associe a une reduction du taux de croissance des arbres qui est potentiellement une consequence du milieu froid et humide dans lequel poussent les racines.
A
cause de leurs proprietes physiques (production, decomposition, capacite d'absorber l'eau), les sphaignes ont ete associeesa
1 'accumulation de la matiere organique sur le sol et a la remontee de la nappe phreatique, mais cette relation n'a pas encore ete demontree. La ceinture d'argile du Quebec et de }'Ontario est une grande region affectee par l'entourbement. Malgre !'importance de ce processus pour la region, il y a peu d'etudes qui examinent en detaill'entourbement. L'objectif global de cette these est de determiner les mecanismes d'entourbement et le role des bryophytes dans le processus d'entourbement des fon~ts d'epinettes noires de la ceinture d'argile du Quebec et de }'Ontario.
Des etudes dans une chronosequence de peuplements d'epinettes noires ont pu determiner que 1' accumulation avec le temps de materiel organique sur le sol mineral est causee par le climat regional, ainsi que la presence de sphaignes et de plantes ericacees. De plus, il a ete demontre que la remontee de la nappe phreatique n' est pas une cause de 1' accumulation de la matiere organique mais une consequence de cette derniere. Malgre des hypotheses emises il y a plus de 50 ans, la sphaigne n'a pas joue de role direct dans la remontee de la nappe phreatique mais plutot un role indirect via sa contribution a 1 'accumulation de la matiere organique.
Les etudes portant sur le phenomene de l'entourbement lui-meme ont illustre }'importance de la communaute des bryophytes sur le fonctionnement de l' ecosysteme. La communaute de bryophytes passe d'une communaute dominee par les mousses hypnacees, a une communaute dominee par des sphaignes formant des hummocks, a une communaute dominee par les sphaignes de milieux humides. Les changements en lumiere et en humidite disponible associes a l'entourbement ont ete identifies comme etant les facteurs qui causent les changements de communautes lors de la succession. La quantite de lumiere disponible pour les bryophytes augmente avec 1 'age du peuplement a cause de 1 'ouverture du couvert forestier suite ala senescence par pied d'arbre. Le taux d' humidite disponible augmente quanta lui avec !'accumulation de la matiere organique et la remontee eventuelle de la nappe phreatique. Puisque les mousses et les sphaignes sont en partie responsables de
1' accumulation de la matiere organique, ces resultats suggerent que la succession dans la communaute de bryophytes s' appuie sur le modele de facilitation.
Malgre que les changements de composition aient ete expliques par les changements dans 1' environnement, 1' etablissement initial des sphaignes dans les j eunes peuplements n'etait pas explique par des limitations d'habitat. La disponibilite des spores n'explique pas le manque de sphaignes dans les jeunes peuplements. Mais, les colonies de sphaignes se sont etablies a plus de 70% du temps sur le bois mort, ce qui potentiellement expliquerait une restriction dans le temps et l'espace de la colonisation. Ensemble, ces resultats nous permettent de voir que les changements dans la communaute de sphaignes sont influences
plutot par des processus stochastiques (la colonisation) au debut de la succession et par des processus dirige par 1 'habitat et les processus de competition a la fin de la succession.
Ces etudes mettent l'emphase sur deux lacunes dans l'amenagement forestier de peuplements et de paysages entourbes. Les fon~ts entourbees et les jeunes forets non
entourbees contiennent des communautes de bryophytes riches et distinctes. La coupe avec la protection des sols et de la regeneration (CPRS), qui est la norme dans la foret boreale au Quebec, ne recree pas la structure des j eunes forets quand c' est applique dans les vieilles forets. Egalement, la CPRS ne recreer pas la structure des vieilles forets entourbees et le manque de ces deux types d'habitat dans le futur pourrait mettre les especes associees avec ces stades en perils. Les coupes partielles ont le potentiel de recreer les communautes de bryophytes associees avec les vieilles forets maisjusqu'a maintenant, uniquement les sphaignes ont ete examinees, et cela a court terme.
En conclusion, une meilleure connaissance et comprehension de la communaute des bryophytes dans les forets d' epinette noire sur les depots fins nous permettra de formuler une meilleure strategie d'amenagement qui prend en compte la biodiversite des bryophytes de ces forets extraordinaires et leur productivite.
INTRODUCTION GENERALE
0.1 LAFORETBOREALE
La fon::t boreale est un des biomes le plus etendu au monde. Elle couvre 6. 7 millions km2, so it un tiers des fon~ts mondiales (Scott, 1995), et elle joue un role important dans le cycle planetaire du carbone (Goulden et al., 1998). Deux caracteristiques distinguent Ia foret boreale des autres biomes, la predominance des feux de foret comme agent de perturbation, et l'abondance des bryophytes terricoles.
0.1.1 Les feux de foret
Le feu est 1' agent de perturbation dominant dans le biome boreal (Payette, 1992; Johnson, 1992), mais son role varie beaucoup avec les essences presentes et le climat. Les essences presentes influencent davantage la severite des feux, tandis que le climat, lui, influence la frequence. Par exemple, en Europe 1' espece dominante, le pin sylvestre (Pinus sy lvestris), est resistante au feu. Lorsqu'un feu se produit dans des peuplements matures, il
est dit non-severe puisque la plupart des arbres ne sont pas tues et generalement uniquement le sous-bois est brule (Englemark et Hytteborn, 1999). Par contre, une interaction entre la severite et la frequence est possible. Quand la frequence est faible, des especes qui ne sont pas resistantes aux feux peuvent coloniser les sites (e.g. Pice a abies et Betula pendula ), ce qui resulte lors d'un prochain feu
a
une plus grande mortalite des arbres eta
unecaracterisation du feu comme etant plus severe (Englemark et Hytteborn, 1999). En Amerique du Nord les deux especes dominantes, l'epinette noire (Picea mariana) et le pin gris (Pinus banksiana) ne sont generalement pas resistantes au feu, ainsi lors d'un feu 1 'impact est severe, les arbres sont tous tues, le sous-bois est brule et la succession
recommence (Heinselman, 1981). Comme en Europe, une interaction entre la severite et la frequence des feux est possible en Amerique du Nord. Dans certain cas, quand les forets sont vieilles et tres humides, un feu peu severe peut survenir. Les arbres y sont tues, mais le sous-bois n'est pas completement brule (Lecomte et al. 2006). Ces exemples illustres que bien que le feu est une constante dans la foret boreale, son caractere et role varient enormement.
De meme, les variations dans la composition des forets et du climat a travers le biome influence aussi le cycle de feu. Dans les regions continentales ou l'aridite est extreme, les cycles de feu sont courts, de l'ordre de 70-80 ans (Heinselman, 1981). Dans ces systemes,
i1 y a tres peu de succession dans la strate arborescente (Dix et Swan, 1971; Black et Bliss, 1978; Heinsleman 1981 ). Le temps ecoule entre deux feux par rapport ala longevite des arbres est trop court. Par contre, dans les regions oceaniques l'humidite des masses d'air limite la frequence des feux, et les cycles de feu sont plus longs. Dans ces systemes, on assiste a une succession en especes et en structure dans la strate arborescente (Bergeron, 2000; Harper et al., 2002; Lesieur et al. , 2002; Lecomte et al. 2005). Cette succession est causee par l'effet cumule des processus naturels (e.g. entourbement, vieillissement des arbres) et des perturbations secondaires (epidemie d'insecte, chablis), qui avec le temps depuis le dernier evenement de feu modifient la structure et la composition de la foret.
0.1.2 Les bryophytes
Les bryophytes dominent le sous-bois de plusieurs forets boreales. Elles se retrouvent souvent en forme de tapis continu qui recouvre entierement le sol. Elles peuvent representer une proportion significative de la production primaire (Longton, 1992; Bisbee et al., 2001; O'Connell et al., 2003), peuvent reduire le temperature du sol et peuvent absorber les nutriments lessives des arbres par la precipitation (Van Cleve et Viereck, 1981).
La strate des bryophytes qu'on retrouve dans le biome boreal d' Amerique du Nord, subit une succession typique, ou les especes de debut de succession sont remplacees par d ' autres especes, et ultimement par les mousses hypnacees (Pleurozium schreberi, Hylocomium splendens, Ptilium crista-castrensis; Black et Bliss 1978; Heinselman 1981; Foster 1985). Dans les regions de l'est ou les cycles de feu sont plus longs, la succession continue et aboutit a une invasion eta une expansion des sphaignes (Foster 1985; Boudreault et al., 2002). Ce changement de composition de la strate muscinale, de mousses hypnacees a sphaignes, entraine des changements dans le fonctionnement de 1' ecosysteme. Compare aux mousses hypnacees, les sphaignes ont un taux de fixation du carbone eleve (Bisbee et al., 2001; Swanson and Flanagan 2001), un plus grand effet d'isolation sur le sol (Dioumaeva et al., 2002), et un taux de decomposition reduit (Swanson and Flanagan, 2001; Turetsky, 2003). Malgre l'ampleur des effets sur l'ecosysteme, les causes et les mecanismes
3
d'etablissement et d'expansion des sphaignes dans le tapis de mousses hypnacees ne sont pas encore bien compris.
0.2 L'ENTOURBEMENT
L'entourbement est le developpement d'une couche epaisse de matiere organique sur le sol en association avec la remontee de la nappe phreatique. La cause ultime de
1' entourbement est un taux de production de biomasse qui est superieur au taux de
decomposition. L'entourbement est associe a une reduction du taux de croissance des arbres (Bonan et Shugart, 1989; Glebov et Kurzukhin, 1992). Cette reduction est potentiellement une consequence du milieu froid et humide dans lequel poussent les racines. L'entourbement est un processus qui prend place globalement mais qui est limite a des regions distinctes, ou les conditions permettent un exces de production par rapport a la decomposition dans le sous-bois. Bien que la cause ultime soit commune a toutes les regions affectees par
1' entourbement, so it un exces de production de biomasse, la cause proximale varie entre les regions. Par exemple, en Alaska l'entourbement est une consequence du developpement du pergelisol sous les tapis de mousses hypnacees, et en Siberie 1 'entourbement est une consequence de !'expansion des tourbieres avoisinantes.
A
cause de leurs proprietes physiques (production, decomposition, capacite d'absorber l'eau), les sphaignes ont ete associees a !'accumulation de la matiere organique sur le sol, eta la remontee de la nappe phreatique (Heilman, 1966; Noble et al., 1984), mais cette relation n'a pas encore ete demontree.La ceinture d'argile de Quebec et de !'Ontario est une grande region (125 000 km2)
affectee par 1' entourbement. La presence, a la fois, de sols argileux deposes par les lacs proglaciaires Ojibway-Barlow et d'une topographie dominee par des pentes faibles favorise 1' entourbement dans la region. Le phenomene est aussi favorise par la dominance de 1 ' epinette noire, qui est une espece produisant une litiere resistante a la decomposition. Malgre !'importance de ce processus pour la region, il y a peu d'etudes qui examinent en detaill'entourbement (cf. Taylor et al., 1987; Boudreault et al., 2002; Jeglum et He, 1995; Groot, 2002; Lecomte et al., 2005).
0.3 L' AMENAGEMENT FORESTIER
Dans les forets amenagees pour !'extraction de matieres ligneuses, l'amenagement ecosystemique, ou les interventions forestieres s'inspirent des processus naturels de l'ecosysteme (McRae et al., 2001), est couramment vu comme la meilleure fayon de
conserver la diversite biologique et structurelle des forets
a
l'echelle du paysage. Cependant, afin de reussir un amenagement ecosystemique, i1 faut comprendre les processus regionaux. Couramment en foret boreale les coupes de faible retention ( ou tous les arbres de diametre commercial sont recoltes) qui ne perturbent pas le sol, sont !'intervention dominant. I1 y a deux lacunes dans cette vision de la foret boreale sur la ceinture d'argile: (1) les forets subissent un cycle de feu long (Bergeron et al., 2001), et par consequence developpent, avec le temps depuis feu, une diversite de structures horizontales et verticales qui n'est pas reproduite par des coupes totales, et (2) les coupes avec protection de la regeneration et des sols (CPRS), qui sont exigees par les normes au Quebec, n'imitent pas les feux, parce qu'elles ne perturbent pas le sol (Bergeron et al., 1999). Pour resoudre la premiere probleme, les coupes partielles ont ete suggerees comme un outil qui permettrait 1 'extraction de matieres ligneuses et la creation de structures associees avec les vieilles forets . Toutefois, on ne sait pas encore si ces techniques creent avec succes des structures acceptables pour les especes associees aux vieilles forets. Les consequences du deuxieme probleme ne sont pas encore documentees, et 1 'ultirne effet de la CPRS sur la succession des peuplements entourbes est aussi inconnu. De meme, les methodes pour mieux imiter les feux severes sont peu testees.0.4 OBJECTIFS
L'objectif global de cette these est de determiner les mecanismes d'entourbement, et le role des bryophytes dans le processus d'entourbement des forets d'epinettes noires de la ceinture d'argile du Quebec et de !'Ontario. La these est divisee en trois sections reparties sur sept chapitres au total. La premiere section examine les mecanismes de l'entourbement et la remontee de la nappe phreatique (chapitres I et II) . Les mecanismes de succession de la communaute des bryophytes sont traites dans la deuxieme section (chapitres III, IV, V, VI) et
finalement les consequences des coupes partielles sur la communaute de sphaignes sont examinees dans la troisieme section (chapitre VII).
5
Ces travaux ont ete realises dans la chronosequence principalement mise en place par Nicolas Lecomte, et le Reseau des Coupes Partielles.
CHAPITREI
PALUDIFICATION IN BLACK SPRUCE (PICEA MARIANA) FORESTS OF EASTERN CANADA: POTENTIAL FACTORS AND MANAGEMENT IMPLICATIONS
Nicole Fenton, Nicolas Lecomte, Sonia Legare, and Yves Bergeron
7
1.1 ABSTRACT
Over time boreal black spruce forests on fine-textured soils in western Quebec, Canada develop very thick forest floors composed of poorly decomposed litter created by the tree and understory layers. These paludified soils are typically waterlogged and cold, and in this fire-mediated landscape, are at least partially consumed by stand replacing fires, which facilitates the establishment of the next generation of trees. Within a context of ecosystem based management, forest harvest should mimic the dual effects of high severity fire on tree and forest floor biomass. This study was designed to investigate potential factors of forest floor thickness in order to determine the impact of removing only a tree layer, and to suggest strategies to limit paludification in this important forestry region. Forest floor thickness, fire severity, basal area, canopy closure, cover of Sphagnum spp. and ericaceous spp. were measured in black spruce stands across a chronosequence from 50 to 350 years after fire. Fire severity was determined to be a key factor in determining forest floor thickness by path analysis. After high severity fires forest floor thickness was primarily dependant on stand age, but was also positively influenced by Sphagnum spp. cover and negatively influenced by the presence of trembling aspen (Populus tremuloides). These results suggest that forest interventions that do not remove the organic layer may be mimicking low severity fires and promoting poor growth and regeneration. Forest floor thickness may be limited by avoiding interventions that open the canopy that promotes the presence of Sphagnum spp. and
ericaceous spp., or by practicing mixed silviculture of trembling aspen and black spruce. However, a balance needs to be maintained between the application of these techniques and the preservation of paludified forests to maintain natural landscape proportions.
Dans l'ouest du Quebec, Canada avec le temps depuis le dernier feu, les forets d'epinette noire sur sols fins developpent des couches epaisses de matiere organique formee de la litiere des arbres et du sous-bois. Ces sols entourbes sont typiquement froids et satures d'eau et, par consequent, leur combustion (totale ou partielle) par les feux de foret facilite l'etablissement d'un nouveau peuplement. Dans le contexte d'amenagement ecosystemique, la recolte d' arbre dans ces forets devrait imiter 1' effet double des feux de foret, soit la combustion des arbres et de la couche de matiere organique. Cette etude a pour but d'investiguer les facteurs qui influencent l'epaisseur de la matiere organique pour etre capable d'evaluer !'impact d'enlever uniquement les arbres et de finalement suggerer des strategies pour limiter 1' entourbement dans cette region forestiere. Dans une chronosequence de sites ages de 50
a
350 ans apres feu, l'epaisseur de la matiere organique, la severite du dernier feu, l'ouverture de la couronne et le recouvrement des sphaignes et des ericacees ont ete mesures. Une analyse par coefficient de direction a demontre que la severite du dernier feu est un facteur cle dans !'accumulation de la matiere organique. Apres un feu de haute severite, l'epaisseur de la matiere organique est principalement determinee par le temps depuis feu mais est aussi influencee positivement par le recouvrement des sphaignes et negativement par la presence des peupliers faux-tremble (Populus tremuloides). Ces resultats suggerent que lesinterventions forestieres qui ne reduisent pas la couche de matiere organique pourraient imiter les feux de faible severite et pourraient ainsi promouvoir la faible croissance et etablissement dans le nouveau peuplement. L' epaisseur de la matiere organique pourrait etre
limitee par des interventions qui gardent un maximum de recouvrement de couronne et par consequent limiter l'etalement des sphaignes et des ericacees ou par la sylviculture mixte des peupliers faux-tremble et des epinettes noires. Toutefois, au niveau du paysage, un equilibre entre la preservation des fon~ts entourbees et leur remise en production est necessaire.
9
1.2 INTRODUCTION
Boreal black spruce (Picea mariana Lamb.) forests develop thick forest floors composed of partially decomposed and un-decomposed plant matter that is a product of the understory and tree layers. The thickest forest floors occur in regions prone to paludification, such as the interior of Alaska (Viereck et al., 1993), old glacial Lake Agassiz (Heinselman, 1963), the Clay Belt of Quebec and Ontario (Taylor et al., 1987), and Labrador (Foster, 1984). In these regions decomposition is considerably slower than litter production, due to low temperatures, and the presence of poor decomposition substrates in the litter (Prescott et al., 2000). As a result, very thick forest floors accumulate, and forests may develop into peatlands (Crawford et al., 2003).
While paludification is frequently discussed, the local mechanisms that result in reduced decomposition are not clear. Cited causes include Sphagnum spp. invasion
(Lawrence, 1958), thick feather moss cover (Viereck et al., 1993), the presence of ericaceous species (DeLuca et al., 2002) and water table rise due to a variety of causes (Taylor et al., 1987; Bonan and Shugart, 1989). Regardless of the cause, the accumulation of deep forest floors has a profound negative effect on forest productivity (Bonan and Shugart, 1989;Glebov and Kurzukhin, 1992), as paludified soils tend to be water-logged, cold and have a significant proportion of nutrients locked up in the poorly decomposed organic matter that makes up the forest floor (Heinselman, 1963; Van Cleve and Viereck, 1981; Bonan and Shugart, 1989; Glebov and Kurzukhin, 1992). These changes are believed to cause a drop in the growth rate of trees (Van Cleve and Viereck, 1981 ), and inhibit the development of seedlings (Bonan and Shugart, 1989; Greene et al., 1999). As a result, regeneration is decreased without a stand replacing fire that bums through the forest floor.
Ecosystem based management includes the assumption that diversity (biological and structural) can be conserved when forestry interventions are modelled after natural
disturbances (McRae et al., 1999). Therefore, in a landscape where forestry is applied, it is important to understand how the disturbance regime affects ecosystem processes in order to accurately mimic them. Within the boreal forest it is frequently assumed that clearcuts mimic the stand replacing fires that are the dominant disturbance factor. However, it has been suggested that without site preparation to disturb the accumulated forest floor, clearcuts do
not resemble fires (Bergeron et al., 1999). Ultimately, without a better understanding of how forest floor biomass is accumulated after fire, and how this process is affected by fire
characteristics (e.g. severity or depth of bum in forest floor) the potential impacts of a lack of forest floor disturbance can only be speculated on.
The objectives ofthis study are to examine some of the factors that are believed to influence the accumulation of thick forest floors in boreal black spruce stands on fine textured soils on the Clay Belt of Quebec and Ontario. Factors included in the analyses are fire severity, stand density, degree of crown closure, density of trembling aspen, and Sphagnum spp., and ericaceous spp. cover. High fire severity, stand density and trembling aspen presence are expected to decrease forest floor thickness, while low canopy closure, and high cover of ericaceous and Sphagnum spp. are expected to increase forest floor thickness. With a better understanding of these factors, it may then be possible to suggest silvicultural solutions to either better mimic high severity, stand replacing fires, or to limit forest floor accumulation.
1.2.1 Study Area
The study was conducted in the western boreal forest of Quebec, within the black spruce (Picea mariana)-feather moss (Pleurozium schreberi) forest type (Grondin 1996). Specifically, the study took place within the Clay Belt of Quebec and Ontario, a major physiographic region created by the deposits left by Lakes Barlow and Ojibway after their maximum extension during the Wisconsonian (Vincent and Hardy 1977). The Clay Belt is an excellent area in which to study forest floor accumulation because it is prone to paludification (Boudreault et al. 2002), and supports a large forestry industry. Average annual temperature is 0.8°C with an average of 856.8 mm of precipitation annually, recorded at the closest weather station, La Sarre, Quebec (Environment Canada 1993). The dominant disturbance types are large fires that kill all above ground vegetation. Between 1850 and 1920 the fire cycle was ca 135 years, and it has since increased to ca 398 years; mean stand age is 148 years (Bergeron et al. 2004).
11
1.3 MATERIALS AND METHODS
1.3 .1 Data Collection
During the summer of 2003, 18 black spruce dominated sites ranging from 50 to 350 years since fire (see Appendix A for a full description) were sampled. A stand initiation map (Bergeron et al., 2004) and an ecoforestry map (Harper et al., 2002) were used to choose sites on a slight incline with fine-textured deposits. Slope and soil textured were both verified at the site, and time since fire was established by either dating of dominant trees, or verification of fire map dates by dating of a few dominant trees. The severity of the last fire on the forest floor was established by determining the position of the uppermost charcoal layer within numerous forest floor profiles. While strictly speaking more fuel may have been consumed in the low severity fires, severity of fire on the forest floor may be most accurately measured by the amount of forest floor not-consumed by fire (Alexander, 1982; Nguyen-Xuan, 2000). If the charcoal was situated at the interface between the forest floor and the mineral soil, the last fire was designated as high severity. If however, the charcoal layer was within the forest floor layer, the last fire was designated as low severity. For further details on the methods used, see Lecomte et al. (2006). Among the stands sampled, 13 sites were established after high severity fire and five sites after low severity fire.
Within each site, five quadrats of 100 m2 were installed, with four nested quadrats of 25 m2. Within each 25 m2 quadrat, forest floor thickness was determined by measuring the depth to mineral soil in a randomly chosen location, including therefore the entire organic layer. The clay A horizon provided a clear end point to forest floor depth. A densiometer reading was taken (a concave mirror scored with a grid to allow estimation of canopy cover), and the diameter at breast height ( dbh) of all trees greater than 8 em was measured. Basal area per hectare was calculated for all species together, and for trembling aspen alone. Both stand density and canopy openness were included as variables as stand density also includes the effect of the trees on the soil. Covers(%) of Sphagnum spp. and ericaceous spp.
(primarily Ledum groenlandicum, and Kalmia angustifolia) were estimated. The 25 m2 quadrats were assumed to be independent, as soil processes tend to vary on the scale of a few meters, therefore analyses were performed on the values for the 25 m2 quadrats.
1.3 .2 Statistical Analyses
Forest floor thickness was natural log transformed in all analyses for normality. All other variables were normally distributed.
Pearson correlations were calculated between transformed forest floor thickness and potential explanatory variables [basal area, open canopy, trembling aspen (PET) basal area,
Sphagnum spp. and ericaceous spp. cover] for each data set. Spearman's correlation coeffecient was used for fire severity. Because many of the potential explanatory factors examined were auto-correlated, partial correlation and path analysis, rather than multiple regression, were used to determine the potential structure (including direction) of the relationships among the variables. A d-sep test (Shipley, 2000) was used to determine the likelihood that an a-priori structure was correct. Partial correlation coefficients (or path coefficients) among the variables allowed the determination of the magnitude of direct and indirect effects among variables. The variables included in each path analysis were selected from the list of potential variables based on strong partial correlation with forest floor thickness, indicating they were related when the other variables were held constant. The percent of variation in forest floor thickness explained by the selected explanatory variables was calculated with linear regression using SPSS 1 0.0. A p of 0.05 was used in all analyses, except the Pearson correlations where ap of0.01 was used, due to the large number of correlations calculated.
1.4 RESULTS
Forest floor thickness was negatively correlated with fire severity (i.e. thinner forest floors after high severity fires), total basal area, and trembling aspen (PET) basal area, and positively correlated with cover of ericaceous spp. and Sphagnum spp., canopy openness, and time since fire (TSF; Table 1.1 ). The importance of fire severity is visible in the different curves for sites after high and low severity fires (Figure 1.1). After a high severity fire, a 50 year old site had only approximately 17 em of forest floor on average, while in a
neighbouring site, 50 years after a fire of low severity there was approximately 40 em of forest floor.
13
Table 1.1 Pearson correlation coefficients (Spearman for severity) among factors influencing forest floor thickness, in all sites, and after high and low severity fires. Values in bold are significant at p 0.01.
All sites Severity Basal Open Sphagnum Ericaceous PET basal TSF
area cano_Qy cover cover area
Forest floor -0.358 -0.547 0.573 0.584 0.640 -0.169 0.738 thickness Severity 0.309 -0.260 -0.201 -0.341 0.093 0.000 Basal area -0.577 -0.451 -0.607 0.249 -0.506 Open canopy 0.414 0.561 -0.108 0.580 Sphagnum cover 0.557 0.147 0.526 Ericaceous cover -0.145 0.605
PET basal area -0.099
High severity Basal Open Sphagnum Ericaceous PET basal TSF
area cano_Qy cover cover area
Forest floor thickness -0.489 0.565 0.661 0.634 -0.177 0.802
Basal area -0.551 -0.501 -0.585 0.261 -0.618
Open canopy 0.449 0.591 -0.103 0.685
Sphagnum cover 0.644 -0.150 0.724
Ericaceous cover -0.139 0.770
120 A 100
f
'E
-2- 80i
CJ) CJ) <ll c ~ (.)5
,_ 60f
0f
0 c;:: Ul 40 ~ 0 Li.. 20 .••
0 0 50 100 150 200 250 300 350 400Time since fire (years)
160
8
•
140'E
120 -2-CJ) CJ) <ll 100 c ~ .2 £ 80 ,_ 0 0f
c;:: Ul 60 ~ 0+
Li.. 40 20 0 0 50 100 150 200 250 300 350 400Time since fire (years)
Figure 1.1 Development of forest floor with time since (A) high and (B) low severity fires as mean thickness with standard error. Each point represents the mean of 20 values for each site.
15
As most of the potential factors were auto-correlated, partial correlations were calculated to determine which would be retained for path analysis. TSF, fire severity, cover of Sphagnum spp. and ericaceous spp. were retained, as they had a significant partial correlation, even when the other factors were taken into consideration (Table 1.2). The structure determined by path analysis (Figure 1.2), which was not rejected by d-sep analysis (p= 0.2989; Shipley, 2000), indicated that TSF and fire severity were the two dominant factors on forest floor thickness, with the largest direct effects, 0.606 and -0.295 respectively. The cover of Sphagnum spp. and ericaceous spp. also had statistically significant direct effects, although with less influence than TSF and fire severity. In fact the majority of the correlation between forest floor thickness and Sphagnum spp. and ericaceous spp. cover is due to shared correlation with TSF and fire severity. In tum, Sphagnum spp. cover was positively influenced by cover of ericaceous spp., and TSF. Cover of ericaceous species was influenced negatively by fire severity and positively by TSF.
Table 1.2 Direct effect, indirect effect and error terms for path analysis of forest floor
thickness in all sites, and after high and low severity fires. Total value represents the Pearson correlation coefficient (R2).
Variable Direct Indirect Error Total
All sites Time since fire 0.606 0.307 0.0711 0.738
Severity -0.295 -0.123 0.047 0.371
Sphagnum cover 0.164 0.324 0.0960 0.584
Ericaceous cover 0.079 0.513 0.0481 0.640
High severity Time since fire 0.489 0.284 0.0273 0.800
Sphagnum cover 0.198 0.288 0.174 0.659
PET basal area -0.116 0.0235 -0.0845 -0.177
Ericaceous cover 0 0.621 0.0100 0.631
0.606
-0.295 0.073
-0.211:'1
Figure 1.2 Path analysis of factors affecting forest floor thickness after high and low severity fires combined. The structure was not rejected by d-sep analysis (Shipley, 2000), p = 0.2989. Multiple regression indicated that 70% of the variability was explained by the included variables. Arrows and numbers indicate the direction of causality and the path coefficient between two variables.
As fire severity was a dominant factor, the high severity sites were analysed
separately. After severe fires, forest floor thickness was highly correlated with the amount of open canopy, cover of Sphagnum spp., cover of ericaceous spp., amount of trembling aspen and TSF, which were all also auto-correlated (Table 1.1).
TSF, amount of trembling aspen, cover of Sphagnum spp. and ericaceous spp., and canopy openness all had significant partial correlations when the other factors were
accounted for. The structure suggested by path analysis, indicated that only TSF, Sphagnum spp. cover and amount of trembling aspen had direct effects on forest floor thickness (Table 1.2; Figure 1.3). The cover of ericaceous spp. and the amount of open canopy had an indirect effect via Sphagnum spp. cover. The presented model explains 65% of the variability
(p<0.0001), as indicated by multiple regression, and the structure was not rejected by a d-sep test (Shipley, 2000) with a p of0.725.
0.489 ln forest floor thickness
t
0 .174 I . _ 0.174 17 -0.116 ... -0.0527 PET basal area 0.075Figure 1.3 Path analysis of factors affecting forest floor thickness after high severity fires. The structure was not rejected by d-sep analysis (Shipley, 2000), p
=
0.725. Multiple regression indicated that 65% of the variability was explained by the included variables. Arrows and numbers indicate the direction of causality and the path coefficient between two variables.1.5 DISCUSSION
1.5.1 Time since ftre and ftre severity
Time since ftre (TSF) was the most important factor influencing forest floor thickness within both the entire data set and the analyses restricted to the high severity ftre sites. This is only logical, as the matter within the forest floor takes time to accumulate. However the strong relationship with TSF also indicates that on fine-textured soils on the Clay Belt, no additional initiative process is required. This is in contrast to other geographical areas where a non-linear relationship exists, and thick forest floors are developed after the creation of an impermeable layer by an external factor such as the development of
permafrost, a chemical change in the soil, or the expansion of neighbouring peatlands (Bonan and Shugart, 1989; Glebov and Korzukhin, 1992; Viereck et al., 1993).
From TSF it is possible to calculate the rate of accumulation of forest floor matter. However, the true rate of accumulation in the oldest stands cannot yet be accurately determined, as these sites may be older than indicated by dendrochronological age alone. Carbon 14 tests on similar stands in the same region have indicated that the oldest trees currently found were actually established a long time after the last ftre (Cyr et al., 2005), resulting in an underestimation of stand age. While a change in stand age would affect the interpretation of the rate of forest floor accumulation and potentially the relative importance of each mechanism, it would not affect the mechanisms investigated here.
After TSF, ftre severity was the most important factor in explaining variation in forest floor thickness in the complete data set. This is reflected in the very different forest floor thicknesses in young stands after high and low severity ftres, and in the relationship between forest floor thickness and time (Figure 1.1 ). This may be due to two causes. The intuitive cause is that residual matter left by a low severity ftre gives the forest floor a head start. However, the presence of residual matter may also accelerate the rate of accumulation by affecting the function of factors suggested here, primarily Sphagnum spp. and ericaceous spp. For example, the residual layers of the forest floor left after non-severe ftres may facilitate Sphagnum spp. establishment, and growth (Dymess and Norum, 1983; Purdon et al., 2004). For this reason, a separate analysis was completed for the high severity ftre sites.
19
A similar detailed analysis of the low severity sites was not possible with the data from this study, as too few low severity fires were sampled. Therefore, future studies should focus on understanding the influence of low fire severity and residual matter on the factors influencing the development of forest floors proposed here. This may be of particular importance, as the long fire cycles found in the eastern boreal forests permit the accumulation of a significant forest floor. This may cause a self-perpetuating cycle as forests with a thicker forest floor are moister and lose less organic matter during subsequent fires (Foster, 1985; Kasischke et al., 2000).
1.5.2 Forest floor thickness after high severity fires
While TSF was overwhelmingly the most important factor influencing forest floor thickness, there was variation in the thickness of the forest floor within and among sites, particularly at later stages in the chronosequence (Figure 1.1 ). Within this analysis, the factors explaining this variation were the cover of Sphagnum spp., the amount of trembling aspen, the openness of the canopy and the cover of ericaceous spp.
The presence of Sphagnum spp. in the understory has frequently been implicated as a key factor in the development of thick forest floors. They are believed to have a negative effect on decomposition through the development of a cold, wet and acidic environment for decomposers (Turetsky, 2003). In addition they also affect decomposition rates through their rapid production of biomass, which has a high C:N ration, and is resistant to decomposition (Hobbie, 1996; Turetsky, 2003). However, while our results indicate that they are a direct factor in determining forest floor thickness, the magnitude of effect is comparatively weak.
The direct negative effect of the presence of trembling aspen on forest floor
thickness is inferred to be due to the presence of a high quality litter on the forest floor, which results in higher decomposition rates overall. Legare et al. (2005) found increasing
decomposition rates of popsickle sticks, in the forest floor with increasing presence of trembling aspen in the forest composition. In addition to this direct effect, the presence of trembling aspen diminished the cover of Sphagnum spp. This effect is particularly interesting when canopy openness is accounted for and implies that there is a relationship that is not directly related to shade. It has been suggested that deciduous leaves have a negative effect
on the growth of forest floor mosses, either through a chemical interaction or through shading (Frego and Carleton, 1995; Saetre et al., 1997).
Canopy openness had only an indirect effect on forest floor depth, via Sphagnum spp. cover. The negative interaction between these two factors is surprising, as Sphagnum spp. is generally considered to be shade intolerant, and dependent on full sunlight for maximum growth (Bisbee et al., 2001; Ohlson et al., 2001). However, Sphagnum capillifolium, a highly shade tolerant species (Hayward and Clymo, 1983), dominates in young stands (Fenton and Bergeron, 2006). As a result, total Sphagnum cover does not display the expected relationship with canopy openness. The negative relationship may be due to improved growth of
Sphagnum spp. in the less illuminated sites in the older sites, which allows them to avoid desiccation and photoinhibition.
The cover of ericaceous species had only an indirect effect on forest floor depth, via Sphagnum spp. However, in Europe Empetrum nigrum, has been shown to have a strong direct impact on ecosystemic processes (Wardle et al., 1997, 2003) through the production of phenols that retard decomposition (DeLuca et al., 2002). In this study, while Kalmia
angustifolia and Ledum groenlandicum litter have been shown to produce phenols (Inderjit and Malik 1997, 2002), their effect on forest floor thickness after high severity fires was solely through their effect on the abundance of Sphagnum spp., and probably not a direct effect on decomposition rate. Ericaceous species, and vascular plants in general, may stimulate Sphagnum spp. growth through a "scaffolding" effect, where the Sphagnum spp. use vascular plants to physically support fast vertical growth (Maimer et al., 2003). The high level of variability in forest floor depth within sites, particularly in the older sites (Figure 1.1A), indicates the importance of very local factors, such as small canopy openings, and Sphagnum spp. and ericaceous spp. cover.
1.5.3 Management implications
Ecosystem based management requires an understanding of regional disturbance and stand dynamics in order to be successfully applied. The development of thick forest floors on the Clay Belt of Quebec and Ontario is an excellent example. Because on the Clay Belt black spruce stands on fine textured soils accumulate thick forest floors over time, which have a negative effect on tree growth (Heinsleman, 1981; Glebov and Kurzhkin, 1992), any