HAL Id: inserm-00383358
https://www.hal.inserm.fr/inserm-00383358
Submitted on 13 May 2009HAL is a multi-disciplinary open access archive for the deposit and dissemination of sci-entific research documents, whether they are pub-lished or not. The documents may come from teaching and research institutions in France or abroad, or from public or private research centers.
L’archive ouverte pluridisciplinaire HAL, est destinée au dépôt et à la diffusion de documents scientifiques de niveau recherche, publiés ou non, émanant des établissements d’enseignement et de recherche français ou étrangers, des laboratoires publics ou privés.
The rheological properties of silated
hydroxypropylmethylcellulose tissue engineering
matrices
Ahmed Fatimi, Jean-François Tassin, Sophie Quillard, Monique Axelos, Pierre
Weiss
To cite this version:
Ahmed Fatimi, Jean-François Tassin, Sophie Quillard, Monique Axelos, Pierre Weiss. The rheological properties of silated hydroxypropylmethylcellulose tissue engineering matrices. Biomaterials, Elsevier, 2008, 29 (5), pp.533-43. �10.1016/j.biomaterials.2007.10.032�. �inserm-00383358�
The rheological properties of silated hydroxypropylmethylcellulose tissue
engineering matrices
Ahmed Fatimia,b, Jean François Tassinc , Sophie Quillarda,b, Monique A. V. Axelosd, Pierre Weissa,b,*
aINSERM, U791, Laboratoire d'Ingénierie Ostéo-Articulaire et Dentaire, 1 place Alexis
Ricordeau, 44042 Nantes, France.
bUniv Nantes, Université de Nantes, Laboratoire d'Ingénierie Ostéo-Articulaire et Dentaire, 1 place Alexis Ricordeau, 44042 Nantes, France.
cCNRS, UMR 6120, Polymères, Colloïdes, Interfaces, Université du Maine, Avenue Olivier
Messiaen, 72085 Le Mans, Cedex 9, France.
dINRA, UR1268 Biopolymères Interactions Assemblages, F-44300 Nantes, France.
*Corresponding author:
Pierre Weiss, DDS, PhD; Inserm U791, Faculté de chirurgie dentaire, 1 place Alexis Ricordeau, BP 84215, 44042 Nantes, France.
Tel: +33 2 40412916; Fax: +33 2 40083712; Email: [email protected] * Title Page
Abstract
This paper describes the rheological properties of silated hydroxypropylmethylcellulose (HPMC-Si) used in biomaterials domain as a three-dimensional synthetic matrix for tissue engineering. The HPMC-Si is an HPMC grafted with 3-glycidoxypropyltrimethoxysilane (GPTMS). HPMC and HPMC-Si were studied. It is shown that although silanisation reduces the hydrodynamic volume in dilute solution, it does not affect significantly the rheological behavior of the concentrated solutions. The HPMC-Si viscous solution (pH 12.8) crosslinks by decreasing the pH using an acid buffer, since HPMC-Si solution transforms into an elastic state. The kinetics of crosslinking and final elastic properties is influenced by several parameters such as polymer concentration, pH, and temperature. pH and temperature played an important role in the silanol condensation, mainly responsible for network formation. The study of the gelation process revealed the dependence of the final concentration of HPMC-Si hydrogel on crosslinking kinetics and viscoelastic properties. The percolation theory was applied to determine gel point and to discuss the dependence of storage (G’) and loss (G”) moduli on frequency. Results showed that both G’ and G” exhibit a power-law behavior with an exponent (0.68) which extends over the entire frequency range. This method is the only one to characterize the time where a liquid viscous phase shifts to hydrogel with elastic properties. In this case it was about 23 minutes for a final pH of 7.4
Keywords: Biomaterials; Tissue engineering; Cellulosic derivative; Silanol; Rheological properties, Gelation.
1. Introduction
Cellulose ethers are water-soluble polymers derived from cellulose, the most abundant
polymer in nature. They have been used for a long time in pharmaceutical and food industries, due to their ability to behave as emulsifiers, colloidal stabilizers, and flow controllers, but also owing to their non-toxic nature. Moreover, cellulose ethers exhibit appropriate biological properties which make them suitable for biomedical applications [1]. Hydroxypropylmethylcellulose (HPMC) is a cellulose derivative polymer. HPMC is a methylcellulose modified with a small amount of propylene glycol ether groups attached to the anhydroglucose of the cellulose (Fig. 1).
In biomedical applications, this polysaccharide is used for preparation of biomaterial matrices and injectable calcium phosphate ceramics suspension (ICPCS) [2-5]. Weiss et al. developed a first generation of ICPCS [3, 6]. It was composed of a mixture of HPMC solution and biphasic calcium phosphate (BCP) granules [3]. These ICPCS showed good biocompatibility and had convenient rheological properties for injection, but the viscous suspension showed a tendency to flow after implantation in vivo. In 1997, a second generation of ICPCS was developed [7]. The long term flow was suppressed by using a silated HPMC (HPMC-Si) which crosslinks under easily controllable conditions without use of a toxic chemical catalyst. Crosslinking is obtained through a decrease of the pH by a buffer solution [8, 9]. After the second generation of ICPCS, a new concept of an injectable and self-setting hydrogel was developed. HPMC-Si appeared as a potential scaffold for three-dimensional amplification and transfer of chondrocytes in cartilage tissue engineering [10].
The self-hardening principle of the HPMC-Si hydrogel is based on the silanes grafted by an epoxy function along the HPMC chains (HPMC-Si). The silane used in this study was 3-glycidoxypropyltrimethoxysilane (GPTMS). The grafted silane percentage on HPMC was determined from silicon content, as validated with silated hydroxyethylcellulose (HEC-Si) * Manuscript
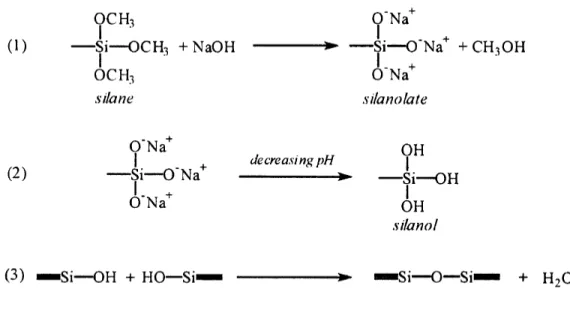
[9]. Dissolution of HPMC-Si takes place in a strong basic medium (NaOH at pH 13.2) which leads to the silane's ionization into sodium silanolate (−SiO-Na+) [9]. The limiting pH of sodium silanolate stabilization is approximately 12.1~12.2, below which sodium silanolates transform into silanols (–SiOH) [8]. These lasts can undergo condensation reactions, forming a three-dimensional network of the HPMC-Si chains (Fig. 2). The first synthesis of silated polysaccharides was described in 1990 [11, 12] and Turczyn et al. [13] were the first to propose biomedical applications. The principle of synthesis and kinetics of crosslinking of HPMC-Si were largely described by Bourges et al. [8].
The aim of this work was to characterize the influence of silanisation of HPMC on the rheological properties of the solution and to study the kinetics of gelation of HPMC-Si using oscillatory shear rheometry. Studies were conducted first to determine the difference between nongrafted HPMC and silated HPMC under different forms: (i) powders using vibrational spectroscopy (Fourier transform infrared and Fourier transform Raman) (ii) dilute solutions using intrinsic viscosity measurements, and (iii) concentrated solutions using rheological measurements (flow curves and oscillatory frequency sweeps). The second step was to determine the gelation properties of HPMC-Si. The self-hardening of hydrogel was studied as a function of time by oscillatory time sweeps and oscillatory frequency sweeps and the gel point was determined.
2. Materials and methods 2.1. Synthesis of HPMC-Si
The natural water-soluble cellulose ethers HPMC (Methocel® E4M) used in this study were
supplied by Colorcon (England). The average degree of substitution (D.S.), molecular weight (Mw) and percentage of methoxyl (–OCH3) and hydroxypropyl (–OCH2CHOHCH3) groups of
The principle of HPMC-Si synthesis was largely described by Bourges et al. [8]. 1.9 l of n-heptane (Acros, Belgium) were stirred with 420 ml of 1-Propanol (Acros, Belgium). 12 g of NaOH (Prolabo, France) and 240 g of dry HPMC were added to the mixture under stirring. The mixture was kept at room temperature for 50 min under a nitrogen bubbling. 36 ml of 3-GPTMS (Aldrich, Germany) which is the group to be grafted were added dropwise and temperature was increased until 85°C in 35 min. The boiling was kept for 3.5 h. Heating was closed and at 40°C, 30 ml of glacial acetic acid was poured for the reaction neutralization. After 30 min, the mixture was filtered on a buschner. The powder was washed successively 4 times with 3 l of an acetone/water mixture (85:15 v/v) to eliminate unreacted GPTMS and HPMC-Si powder was dried at 37°C.
The silane percentage was determined by inductively coupled plasma atomic emission spectroscopy (ICP-AES). This analysis method allows us to calculate the silane percentage grafted on HPMC using the following formula (Eq. (1)):
Silane grafted: Si GPTMS HPMC Si HPMC grafted Mw Mw Si Si Si (%) ( ) (1)
where SiHPMC-Si (%) is the measured silane in HPMC-Si; SiHPMC (%) is the silane traces in
HPMC; with MwGPTMS=236.34 g.mol-1 and MwSi=28.08 g.mol-1.
2.2. Vibrational (FT-IR and FT-Raman) studies
The infrared spectra were collected with a Magna IR 550 spectrometer (Nicolet) equipped with a DTGS detector. The powders were pressed in KBr pellets and the spectra were recorded with 100 scans at 4 cm-1 resolution. All the spectra were corrected from H2O and
CO2 absorptions, using OMNIC software (ThermoFisherScientific). Raman spectra were
obtained using a FT-Raman Bruker RFS 100 spectrometer with the near-IR excitation line (1064 nm).
2.3. Intrinsic viscosity determination
The intrinsic viscosity is a measure of the hydrodynamic volume occupied by a
macromolecule, which is closely related to the size and conformation of the macromolecular chains in a given solvent [14]. The intrinsic viscosity ([η]) was determined using a Couette type rheometer (Contraves Low Shear 40) at 25°C, by measuring viscosities of very dilute solutions and using equation (2):
c sp c 0 lim ] [ (2)
With the specific viscosity:
solvent solvent solution sp (3)
where solution is the solution viscosity ; solvent is the solvent viscosity ; c is the polymer
concentration (g.ml-1). The data were plotted using the Huggings [15] and Kraemer [16]
graphical representations (Eqs. (4) and (5)).
c K c h sp ]² [ ] [ (4) c K c k rel [ ] [ ]² ln (5)
where Kh is the Huggings coefficient, Kk is the Kraemer coefficient.
2.4. Preparation of HPMC and HPMC-Si solutions
Aqueous solutions of HPMC and HPMC-Si were prepared at different concentrations (from 1 to 5% w/w). The powders were dissolved in sodium hydroxide solution (0.2 M NaOH) at 25°C during 48 h. Aqueous solutions were refrigerated subsequently at 4°C to insure a complete solubilization. HPMC and HPMC-Si solutions were dialyzed in dialysis bag (Spectra-por 6000-8000) against 3.8 l (each one) of NaOH solution (0.09 M) during 16 h and
with 4 l (each one) of NaOH solution (0.09 M) during 2 h. Two days after their preparation, polymer solutions were sterilized by steam at 121°C during 20 min.
2.5. Steady shear and dynamic oscillatory measurements
Rheological measurements were performed at 25°C using a RheoStress 300 (ThermoHaake®, Germany) rheometer equipped with a titanium cone-plate geometry (60 mm diameter, 1° cone angle). The rheometer was equipped with a circulating water bath to control the temperature.
The flow curves (viscosity (η) against shear rate ( )) were established for HPMC and HPMC-Si solutions at different concentrations. The experiment was carried out during 60 s in the rate-controlled mode from 0.01 to 9000 s-1 at 25°C. The flow curves were fitted using the simplified Cross equation (Eq. (6)) [17]:
n ) ( 1 0 (6)
where η0 is the limiting Newtonian viscosity at low shear; λ is the relaxation time (the inverse
of a critical shear rate ); n is the exponent of the power-law. Dynamic frequency sweep c experiments were carried out to determine the storage (G’) and loss (G”) moduli as a function of frequency () at 25°C for HPMC and HPMC-Si solutions at different concentrations. A fixed shear stress (1 Pa) was convenient to maintain the linear viscoelastic regime. G’ quantifies the elastic component, it is a measure of the magnitude of the energy stored in the materials. G”, on the other hand, quantifies the viscous property, it is a measure of the energy lost as viscous dissipation [18].
2.6. Self-hardening study of HPMC-Si
The HPMC-Si concentration was set at 3% (w/w). A buffer solution at pH 3.2 based on 4-(2-hydroxyethyl)-1-piperazineethanesulfonic acid sodium salt 99% (HEPES) (Aldrich,
Germany) was used in this study. To investigate the influence of the final polymer concentration on the viscoelastic properties of HPMC-Si hydrogel at pH 7.4, one volume of the HPMC-Si solution was mixed with 0.5 volume of buffer to reach a final polymer concentration of 2% (w/v) (1v0.5) or with one volume of buffer (1v1) to reach a final polymer concentration of 1.5 % (w/v). The evolution of the storage (G’) and loss (G”) moduli during gelation was recorded as a function of time for three different frequencies (1, 3.2 and 10Hz) using the multiwave facility. A total shear stress of 1 Pa were applied.
In order to study the frequency dependence of the dynamic moduli during gelation, frequency sweeps between 60 and 0.1 Hz were repeatedly carried out. Since the data for the different frequencies are not collected at the same time, interpolation of the dynamic moduli at a given time was carried out to obtain the frequency dependence of the moduli below, at and above the gelation transition. Such a procedure is valid to take into account slow linear changes of the material during the measurement time, which was indeed the case here.
3. Results
3.1. Studies on HPMC and HPMC-Si powders
The ICP-AES method was used to determine the amount grafted silane. The silane content in HPMC and HPMC-Si were 0.07% and 0.66%, respectively. The grafted silane percentage (w/w) was calculated as 0.59%.
The infrared spectra of HPMC and silated HPMC in their powder forms are presented in Fig. 3a. No significant changes are observed between these two polymers, indicating that the grafting synthesis does not degrade significantly the chemical structure of the polymer. Fig. 3b shows the FT-Raman spectra of powders of HPMC and HPMC-Si. Here again, no pronounced change between the spectra can be detected.
3.2. Intrinsic viscosity
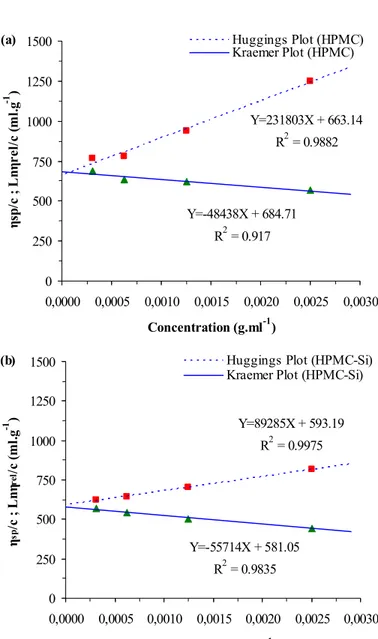
For HPMC and HPMC-Si, the Huggins and Kraemer plots (Fig. 4) yield consistent results and
were selected as the best methods for intrinsic viscosity determination. The [η] value for HPMC ([]~674 ml.g-1) was slightly higher than [η] value for HPMC-Si ([]~587 ml.g-1).
These intrinsic viscosity values allow us to determine the overlap concentration c* as c*=1/[η] [14]. c* is equal to 1.48 10-3 g.ml-1 for HPMC and 1.7 10-3 g.ml-1 for HPMC-Si.
Kh values were determined as 0.53 and 0.26 for HPMC and HPMC-Si, respectively. The
Huggins constant (Kh) lies usually between 0.3 and 0.8 for flexible macromolecules and
values larger than 1 imply strong polymer-polymer aggregation [19].
3.3. Flow curves of HPMC and HPMC-Si solutions
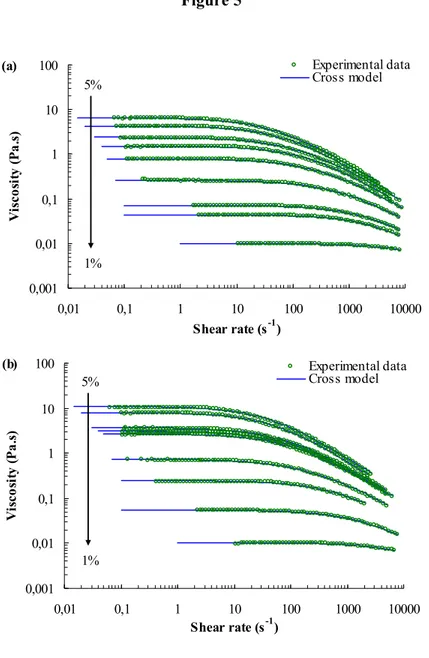
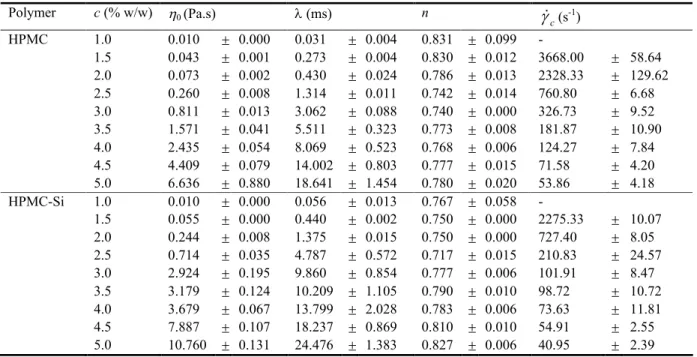
The dependence of the steady shear viscosity on the shear rate of HPMC and HPMC-Si in the range of concentration from 1 to 5% in NaOH (0.2 M) at 25°C is given in Fig. 5. Clearly, a Newtonian plateau observed at low shear rates is followed by a shear-thinning behavior. At high shear rate the viscosity shows a power-law dependence with the shear rate. The flow curves could be conveniently fitted by the simplified Cross model [17] (correlation coefficient of 0.99). The values of the parameters at different concentrations for the HPMC and HPMC-Si solutions are shown in Table 2. The limiting Newtonian viscosity (η0) increases with the
polymer concentration, and at the same time the Newtonian plateau limit shifts to a lower shear rate region, as commonly observed for entangled polymer solutions [20, 21].
Reduced dimensionless variables are often used to produce master curves in such systems.
The reduced viscosity is defined as η/η0and the reduced shear rate as , where η0 and have
been obtained by fitting the flow curves (Table 2). Master curves for HPMC and HPMC-Si have been obtained (Fig. 6), covering a larger shear rate window than for a single concentration and are (of course) well described using the Cross model. For both polymers the
exponent value (n) is close to 0.8 (0.78 and 0.81 for HPMC and HPMC-Si, respectively) which is typical of a flexible polymer [22].
3.4. Concentration dependence of limiting Newtonian viscosity and relaxation time
Fig. 7a shows the concentration dependence of η0 for the HPMC and the HPMC-Si in NaOH
(0.2 M) at 25°C. Clearly, only the concentrated domain was investigated. η0 follows a
power-law dependence on concentration with exponents of 4.20 and 4.41 for HPMC and HPMC-Si respectively. Despite higher viscosity values for HPMC-Si compared to HPMC (Table 2), it can be concluded that silane grafting does not change the concentration dependence on viscosity.
The relaxation time () defined as the typical time for macromolecules to return to equilibrium, is the inverse of the critical shear rate ( ), which corresponds to the transition c
from Newtonian to viscoelastic behavior. As shown in Fig. 7b, the relaxation time scales with
HPMC concentration with an exponent larger than 3 (i.e. ~c3.91). A similar power-law
exponent is obtained for the HPMC-Si (~c3.72).
3.5. Viscoelastic properties
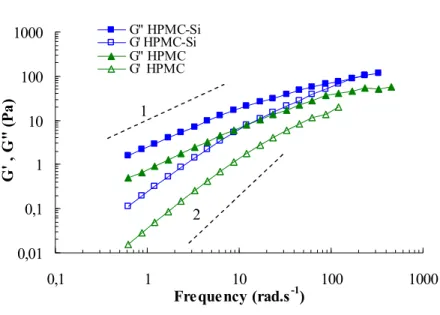
The frequency dependence of the dynamic storage (G’) and loss (G”) moduli of the HPMC and HPMC-Si samples at 3% (w/w) are shown in Fig. 8.
From Fig. 8, it is readily apparent that the synthesis of grafting silane increases the viscoelastic properties of the polymer. In the frequency range studied, the G” values were found to be higher than G’ values. Such results indicate that HPMC and HPMC-Si at 3% (w/w) can be classified as solutions [23]. In the low frequency zone (<10 rad.s-1), for HPMC
and HPMC-Si, the storage modulus G’ increases like 2 whereas the loss modulus G”
The similarity of the various curves has been used to obtain master curves (Fig. 9). Master curves were generated by shifting both the storage (G’) and loss (G”) moduli data of HPMC and HPMC-Si with the 3% (w/w) concentration as reference to obtain an overlap of the various concentrations. The vertical and horizontal shift factors were the same for both G’ and G” curves. The existence of a master curve shows that the behavior of the G’ and G” moduli is identical for all concentrations and characteristics of entangled polymer solutions. Both HPMC and HPMC-Si solutions show a viscous behavior, the values of G” are higher than those of the G’.
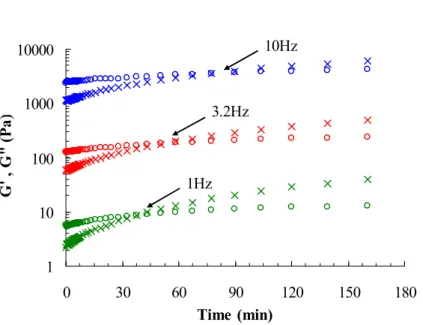
3.6. Self-hardening study of HPMC-Si
Fig.10 shows the time evolution of the dynamic moduli obtained from multiwave tests during self-hardening of a 2% (w/v) HPMC-Si hydrogel. During the first stages of the gelation process G” is higher than G’. Both moduli increase with time, however, the faster increase with time of G’ compared to G” leads to a crossover point before reaching a pseudo plateau for the two moduli. Fig. 10 indicates clearly that the crossover point depends on frequency, therefore it is inappropriate to define the gel time (tg) from the crossing point. The often used
criterion to determine the gel point, due to Winter and Chambon [25, 26], defines tg as the
unique point where the curves of tan(δ) (i.e. G”/G’) cross for all frequencies.
Fig. 11a shows an example of the mechanical spectra obtained at given times during the crosslinking of 3% (w/w) HPMC-Si solution with buffer (1v0.5). Data series for G’ and G” below, at and above the gelation transition are shown. The first spectrum was taken at the beginning of the crosslinking process (t=0min). G’ and G” are those of a macromolecular solution [23, 24]. The next spectrum reported in these series was taken at the gel point (t=23min). As predicted by percolation theory, both G’ and G” exhibit a power-law behavior with an exponent (~0.68) which extends over the entire frequency range (G’~G”~). This
agrees with the exponent already found for other weak gels [27-29]. The two spectra at the top of the figure are characteristic of a gel. The data qualitatively confirms the behavior expected from theory [27]. At low frequency, the material behaves like an elastic medium with a storage modulus G’ which is frequency independent and a loss modulus G” which decreases with decreasing frequency. In Fig. 11b the data have been plotted in a different way designed to test whether the asymptotic low frequency range has been reached where the scaling theory applies and consequently the gel point determination by the crossing of tan(δ) is valid [28].
According to theory, at sufficiently low frequency G”/G’ vs should be frequency independent at the gel point, it should decrease with increasing frequency below the gel point and increase above the gel point. This is exactly what is observed in Fig 12b. It allows one to accurately determine the gel point and furthermore to assert that one is in the scaling regime.
An additional confirmation of the validity of the theory is the measured low frequency plateau value of G”/G’, G”/G’=tan(δ)=tan(/2) which yields =0.68 ± 0.02 for the critical exponent , consistent with the expected universal value =0.71 ± 0.02 [28].
The influence of the concentration on the rheological behavior of HPMC-Si hydrogels has been studied by varying the quantity of the buffer added. In Fig. 12, the storage (G’) and loss modulus (G”) are plotted as a function of time at 1 Hz for two different buffer volumes. A dilution effect is observed, as expected. The kinetics of crosslinking is faster and the values of the G’ and G” moduli are higher with 1v0.5 buffer in comparison with 1v1 buffer. The gel point tg, according to the tan(δ) criterion, was 23 and 32 min for HPMC-Si hydrogel with
1v0.5 of buffer and 1v1of buffer, respectively. In general, the crosslinking kinetics depend on temperature and pH [8]. In this study we showed, at a fixed pH and temperature, the influence of dilution. A dependence of final concentration of HPMC-Si hydrogel on crosslinking kinetics and viscoelastic properties was observed. The higher the polymer concentration, the more rapid are the crosslinking kinetics.
4. Discussion
FT-IR analyses did not shown any difference between silated HPMC and non grafted HPMC. No significant changes are observed between these two polymers, indicating that the grafting synthesis does not degrade the chemical structure of the polymer. Three broad and intense bands are observed around 3500, 2900 and 1060 cm-1, associated respectively to O−H, C−H
and C−O/C−C stretching modes. These features are characteristic of HPMC and consistent with previous results [8, 30, 31]. Previous similar studies on chitosan showed that silane grafting induces new infrared absorptions related to Si−OH, Si−O−C, Si−O−Si bonds at 920, 1000-1100, and 1020-1150 cm-1 respectively [32, 33]. In our results, none of these bands can be observed in the spectrum of HPMC-Si. This could be due to the fact that HPMC possesses strong absorptions in this frequency range or to a low ratio of silanisation of our polymer. The silane grafting was neither detected by FT-Raman. As no particular symmetry effect is expected, the frequencies of the Raman modes are the same as the infrared ones. However, significant changes can be noticed in their relative intensity compares to the infrared bands. The OH stretching is not observed in the FT-Raman spectra, while the C−O/C−C stretching
modes lose intensity with regards to the CH methyl and methylene groups bending mode (1455 cm-1). The effect of silanisation is neither detectable in Raman spectra [30, 34].
In dilute solutions, the [] value for HPMC (674 ml.g-1) is higher than the HPMC-Si one (587
ml.g-1). This higher value for HPMC suggests that HPMC macromolecular chains occupy a
larger hydrodynamic volume and thus that HPMC-Si chains are more compact. This change can be due to the modification of the macromolecular conformation due to specific interactions or to a decrease of the molecular weight arising from degradation during the silane grafting synthesis. The first assumption leads to an increase of the viscosity of concentrated solution as compared to the unmodified polymer, as it is commonly observed in associating polymers. The second one, on the contrary, leads to a decrease of the viscosity.
The study of entangled solutions has shown that the viscosity increases after chemical modifications, showing that specific interactions (probably between Si-grafted groups) lead to some kind of association between macromolecular chains. Going from dilute to concentrated solutions induces a change between intramolecular and intermolecular associations, explaining the decrease of the intrinsic viscosity and the increase of the viscosity of concentrated solutions. A decrease of the molecular weight can not be totally excluded, since both effects might partially compensate each other.
The value of Huggins constant (Kh) lies between 0.3 and 0.8 for flexible polymer chains in
good solvents and values larger than 1 imply strong polymer-polymer aggregation [19]. Kh
values from this study are 0.53 and 0.26 for HPMC and HPMC-Si, respectively [35, 36]. The Kraemer constant Kk obtained for HPMC (0.1) was slightly lower than that obtained for
HPMC-Si (0.17). The sum of the Huggins constant Kh and Kraemer constant Kk should equal
0.5 ± 10% and larger or smaller values are attributed to molecular association [19]. Values from this study do not fall far from this range, meaning the presence of light molecular association.
A large dependence of limiting viscosity on polymer concentration was observed with η0~c4.20
and η0~c4.41 for HPMC and HPMC-Si, respectively. Such values of the exponent are expected
for entangled solutions in good to moderately good solvents. The same type of dependence was obtained for chitosan solution (η0~c4.1) [37].
The relaxation time is proportional to HPMC and HPMC-Si concentration with an exponent
larger than 3 (i.e. ~c3.91 and ~c3.72, respectively). This relaxation time dependence on
polymer concentration has been reported for the chitosan solution (~c3.1 ) [37]. It is however
larger than expected for entangled polymer chains in a good solvent.
The exponent value (n) of the Cross model obtained from the master curves for HPMC and HPMC-Si was 0.78 and 0.81, respectively, which is typical of a flexible polymer [22]. A
similar exponent value (0.82) has been reported for polysaccharide which adopts semi flexible conformation [22, 38].
In the crosslinking experiments characterized in the linear viscoelastic domain, the behavior of HPMC-Si hydrogel reflects a classical liquid-gel transition for polysaccharides, as already reported in the literature. The gel point (tg), on the basis of the percolation theory [28],
appears when G’ and G” show the same power-law dependence with frequency [39] and where tan(δ) is thus independent of frequency [25, 26] (Fig. 11b). At tg theory predicts that
both G’ and G” versus frequency exhibit a power-law behavior with an exponent of Δ~0.68 which extends over the entire frequency range. In this study, the data qualitatively confirm the behavior predicted by the percolation theory [27].
For the same final pH, the effect of polymer concentration was clearly observed. The HPMC-Si hydrogel obtained with a 1v0.5 buffer shows faster kinetics of crosslinking as compared with a 1v1 buffer. In the same time, the G’ and G” values with 1v0.5 buffer are higher than those with 1v1 buffer.
The effect of pH neutralization and silanol condensation temperature was also studied in a previous work on HPMC-Si [8]. The HPMC-Si dilution plays an important role in determining of the self-hardening properties. This parameter can be used, together with the neutralization pH and temperature, to control the kinetics of crosslinking and the viscoelastic properties of the gel.
tg is an interesting parameter in tissue engineering applications. It is the time needed to
manipulate the cells and inject them without a flow character [40]. The time for crosslinking after injection of our hydrogel was a first issue of concern, but viscoelastic properties could also be interesting. HPMC-Si is a convenient three-dimensional network able to support the development of differentiated chondrocytes [10]. By adapting the gel parameters one could
propose hydrogels with crosslinking properties adapted to clinical applications by controlling the amount of grafted silanol, pH of neutralization, temperature and buffer volume.
5. Conclusion
An HPMC-Si aqueous solution is able to crosslink by decreasing the pH. It is shown here that a slight chemical modification (0.6% w/w of silane) which cannot be detected by spectroscopic techniques (FT-IR and FT-Raman) can induce large changes in the macroscopic behavior. The presence of Si-grafted groups along the polymer backbone induces interaction between these groups which lead to a decrease of the size of the coils in dilute solution and increase (by about a factor 2) the viscosity of concentrated solutions as compared to native HPMC. Despite this change, the rheological behavior of the HPMC-Si solutions is typical of that of concentrated polymer solution and essentially determined by entanglements.
In the present work HPMC-Si self-hardening hydrogel was prepared. The hydrogel was obtained by condensation of silanol using an acid buffer as a neutralizing agent. No toxic initiators or organic solvents are required. The gelation time depends on temperature, polymer concentration, silanol grafting, buffer volume and pH. Rheological techniques were used to determine the gel point and the percolation theory was applied to discuss the dependence of G’ and G” on frequency. This method is the only one to characterize the time where a liquid viscous phase shifts to hydrogel with elastic properties.
Acknowledgements
This research was supported by the regional program “Biorégos, Région Pays de la Loire”. Authors wish to express their gratitude to “Région Pays de la Loire” and “INSERM” for the PhD grant of A. Fatimi and also extend their sincere thanks to Colorcon Limited for the supply of the polymer Methocel® E4M.
Notation
: viscosity (Pa.s) sp : specific viscosity
rel : relative viscosity
solvent : solvent viscosity (Pa.s)
solution: solution viscosity (Pa.s)
Kh : Huggings coefficient
Kk : Kraemer coefficient
[η] : intrinsic viscosity (ml.g-1)
0 : limiting Newtonian viscosity (Pa.s)
: shear rate (s-1)
c
: critical shear rate (s-1)
: relaxation time (s)
n : exponent of the power-law G’ : loss modulus (Pa)
G” : storage modulus (Pa) : frequency (rad.s-1 or Hz) C or c : concentration (g.ml-1 or %) c* : overlap concentration (g.ml-1) tg : gel point (min)
References
[1] Bohic S, Weiss P, Roger P, Daculsi G. Light scattering experiments on aqueous solutions of selected cellulose ethers: contribution to the study of polymer-mineral interactions in a new injectable biomaterial. J Mater Sci Mater Med 2001;12(3):201-205. [2] Amouriq Y, Bourges X, Weiss P, Bosco J, Bouler JM, Daculsi G. Skin sensitization study of two hydroxypropyl methylcellulose components (Benecel and E4M) of an injectable bone substitute in guinea pigs. J Mater Sci Mater Med 2002;13(2):149-154.
[3] Weiss P, Gauthier O, Bouler JM, Grimandi G, Daculsi G. Injectable bone substitute using a hydrophilic polymer. Bone 1999;25(2 Suppl):67S-70S.
[4] Gauthier O, Boix D, Grimandi G, Aguado E, Bouler JM, Weiss P, et al. A new injectable calcium phosphate biomaterial for immediate bone filling of extraction sockets: a preliminary study in dogs. J Periodontol 1999;70(4):375-383.
[5] Weiss P, Layrolle P, Clergeau LP, Enckel B, Pilet P, Amouriq Y, et al. The safety and efficacy of an injectable bone substitute in dental sockets demonstrated in a human clinical trial. Biomaterials 2007;28(22):3295-3305.
[6] Weiss P, Daculsi G, Delecrin J, Grimandi G, Passuti N, inventors. International Patent WO 95/21634, 1995.
[7] Weiss P, Lapkowski M, Daculsi G, Dupraz A, inventors. International Patent WO 97/05911, 1997.
[8] Bourges X, Weiss P, Daculsi G, Legeay G. Synthesis and general properties of silated-hydroxypropyl methylcellulose in prospect of biomedical use. Adv Colloid Interface Sci 2002;99(3):215-228.
[9] Bourges X, Weiss P, Coudreuse A, Daculsi G, Legeay G. General properties of silated hydroxyethylcellulose for potential biomedical applications. Biopolymers 2002;63(4):232-238.
[10] Vinatier C, Magne D, Weiss P, Trojani C, Rochet N, Carle GF, et al. A silanized hydroxypropyl methylcellulose hydrogel for the three-dimensional culture of chondrocytes. Biomaterials 2005;26(33):6643-6651.
[11] Sau AC, Majewicz TG. Cellulose ethers: self-cross-linking mixed ether silyl derivates ACS Symp Ser 1992;476:265-272.
[12] Sau AC. Self-crosslinkable silated polysaccharides. American Chemical Society, Polymer Preprints, Division of Polymer Chemistry 1990;31(1):636-637.
[13] Turczyn R, Weiss P, Lapkowski M, Daculsi G. In situ self hardening bioactive composite for bone and dental surgery. J Biomater Sci Polym Ed 2000;11(2):217-223.
[14] Lapasin R, Pricl S. Rheology of polysaccharide systems. Rheology of industrial polysaccharides: Theory and applications. Glasgow: Blackie, 1995. p. 250-494.
[15] Huggins ML. The viscosity of dilute solutions of long-chain molecules. IV. Dependence on concentration. Journal of the American Chemical Society 1942;64:2716-2718.
[16] Kraemer EO. Molecular weights of celluloses and cellulose derivatives. Industrial and Engineering Chemistry 1938;30:1200-1203.
[17] Cross MM. Rheology of non-Newtonian fluids: a new flow equation for pseudoplastic systems. J Colloid Sci 1965;20:417-426.
[18] Rao MA. Rheology of fluid and semisolid foods. Principles and applications. Gaithersburg Aspen Publishers, 1999.
[19] Morris ER, Cutler AN, Ross-Murphy SB, Rees DA. Concentration and shear rate dependence of viscosity in random coil polysaccharide solutions Carbohydrate Polymers 1981;1(1):5-21
[20] Chauvelon G, Doublier JL, Buleon A, Thibault JF, Saulnier L. Rheological properties of sulfoacetate derivatives of cellulose. Carbohydr Res 2003;338(8):751-759.
[21] Kapoor VP, Taravel FR, Joseleau JP, Milas M, Chanzy H, Rinaudo M. Cassia spectabilis DC seed galactomannan: structural, crystallographical and rheological studies. Carbohydr Res 1998;306(1-2):231-241.
[22] Goh KKT, Haisman DR, Singh H. Characterisation of a high acyl gellan polysaccharide using light scattering and rheological techniques. Food Hydrocolloids 2006;20:176-183. [23] Clark AH, Ross-Murphy SB. Structure and mechanical properties of biopolymer gels. Advanced Polymer Science 1987;83:57-192.
[24] Desbrières J, Hirrien M, Ross-Murphy SB. Thermogelation of methylcellulose: rheological considerations. Polymer 2000; 41 2451-2461.
[25] Winter HH, Mours M. Rheology of polymers near liquid-solid transitions. Advances in Polymer Science 1997;134:165.
[26] Chambon F, Winter HH. Stopping of crosslinking reaction in a PDMS polymer at the gelpoint. Polymer Bulletin 1985;13(6):499.
[27] Audebrand M, Kolb M, Axelos MA. Combined rheological and ultrasonic study of alginate and pectin gels near the sol-gel transition. Biomacromolecules 2006;7(10):2811-2817.
[28] Axelos MA, Kolb M. Crosslinked biopolymers: Experimental evidence for scalar percolation theory. Physical Review Letters 1990;64(12):1457-1460.
[29] Lu L, Liu X, Dai L, Tong Z. Difference in concentration dependence of relaxation critical exponent N for alginate solutions at sol-gel transition induced by calcium cations. Biomacromolecules 2005;6(4):2150-2156.
[30] Langkilde FW, Svantesson A. Identification of celluloses with Fourier-transform (FT) mid-infrared, FT-Raman and near-infrared spectrometry. J Pharm Biomed Anal 1995;13(4-5):409-414.
[31] Zaccaron C, Oliveira R, Guiotoku M, Pires A, Soldi V. Blends of hydroxypropyl methylcellulose and poly(1-vinylpyrrolidone-co-vinyl acetate): Miscibility and thermal stability. Polymer Degradation and Stability 2005;90:21-27.
[32] Liu L, Su YH, Lai JY. In situ crosslinking of chitosan and formation of chitosan-silica hybrid membranes with using γ-glycidoxypropyltrimethoxysilane as a crosslinking agent. Polymer 2004;45:6831-6837.
33] Shirosaki Y, Kubo M, Takashima S, Tsuru K, Hayakawa S, Osaka A. In vitro apatite formation on organic polymers modified with a silane coupling reagent. J R Soc Interface 2005;2(4):335-340.
[34] Alvarez-Lorenzo C, Lorenzo-Ferreira RA, Gomez-Amoza JL, Martinez-Pacheco R, Souto C, Concheiro A. A comparison of gas-liquid chromatography, NMR spectroscopy and Raman spectroscopy for determination of the substituent content of general non-ionic cellulose ethers. J Pharm Biomed Anal 1999;20(1-2):373-383.
[35] Higiro J, Herald TJ, Alavi S. Rheological study of xanthan and locust bean gum interaction in dilute solution. Food Research International 2006;39(2):165-175.
[36] Higiro J, Herald TJ, Alavi S, Bean S. Rheological study of xanthan and locust bean gum interaction in dilute solution: Effect of salt Food Research International 2007;40(4):435-447
[37] Cho J, Heuzey MC, Begin A, Carreau PJ. Viscoelastic properties of chitosannext term solutions: Effect of concentration and ionic strength. Journal of Food Engineering 2006;74(4):50-515.
[38] Hember MWN, Morris ER. Solubility, solution rheology and salt-induced gelation of welan polysaccharide in organic solvents. Carbohydrate Polymers 1995;27(1):23-36.
[39] Loiseau A, Tassin JF. Model Nanocomposites Based on Laponite and Poly(ethylene oxide): Preparation and Rheology. Macromolecules 2006;39(26):9185 -9191.
[40] Vinatier C, Magne D, Moreau A, Gauthier O, Malard O, Vignes-Colombeix C, et al. Engineering cartilage with human nasal chondrocytes and a silanized hydroxypropyl methylcellulose hydrogel. J Biomed Mater Res A 2007;80(1):66-74.
Figures and Tables
Fig. 1: Typical chemical structure of hydroxypropylmethylcellulose (Technical Handbook of Methocel® cellulose ethers, Dow Chemical Company).
Fig. 2: Silane behaviors grafted on the HPMC: (1) dissolution in basic middle with silanolate function formation; (2) decrease pH generates silanolate transformation into silanol; (3) silanol condensation.
Fig. 3: (a) FT-IR spectra and (b) FT-Raman spectra of powders of (1) HPMC and (2) HPMC-Si.
Fig. 4: Intrinsic viscosity: Kraemer and Huggins plots of (a) HPMC and (b) HPMC-Si in dilute solutions.
Fig. 5: Flow curves of (a) HPMC and (b) HMPC-Si dispersed in NaOH (0.2M) at different concentrations (1, 1.5, 2, 2.5, 3, 3.5, 4, 4.5, and 5%) at 25°C.
Fig. 6: Master curves for reduced shear rate ( λ) dependence of reduced viscosity (η/η0) of
(a) HPMC solutions (1 to 5% in concentration) exponent value n ~0.78 and (b) HPMC-Si solutions (1 to 5% in concentration) exponent value n ~0.81.
Fig. 7: Concentration dependence of (a) limiting Newtonian viscosity (η0) and (b) relaxation
time (λ) of HPMC and HPMC-Si dispersed in NaOH (0.2M).
Fig. 8: Storage modulus (G’) and loss modulus (G”) vs frequency at 25°C, for 3% (w/w) HPMC and HPMC-Si solutions. A stress of 1Pa was applied.
Fig. 9: Master curves for HPMC and HPMC-Si solutions at 25°C (1 to 5% in concentration). Normalized G’ and G” vs normalized frequency. The concentration reference was 3%.
Fig. 10: Multiwave test of HPMC-Si hydrogel (1v0.5) at 25°C. Time dependence of the storage (G’: x) and loss (G”: ○) moduli. For better visualization, each spectrum has been Captions
shifted upward vertically by one decade with respect to the previous one. The frequencies were 1, 3.2 and 10Hz and a total shear stress of 1Pa was applied.
Fig. 11: (a) Frequency dependence of the storage (G’: ○) and loss (G”: ●) moduli at several stages during the crosslinking of HPMC-Si at 25°C. The bottom spectrum, at t = 0 min, is below the gel point; the next one at t = 23 min, is at the gel point; and the following two, at t = 60 and 1200 min, are above the transition. For better visualization, each spectrum has been shifted upward vertically by one decade with respect to the previous one. (b) tan(δ) (G”/G’) as a function of frequency of the same data.
Fig. 12: The storage modulus (G’) and loss modulus (G”) of HPMC-Si hydrogel at different volume of buffer (1v0.5 and 1v1). A total shear stress of 1Pa at 25°C was applied.
Table 1: Composition and characteristics of HPMC sample used in the present worka.
Table 2: Values of Cross parameters at different concentrations for the HPMC and HPMC-Si solutions at 25°C.
Figure 1 Figure 1
Figure 2 Figure 2
Figure 3
(a)
400 0 3500 3000 2 500 2000 150 0 1000 500 580 1068 1378 1460 1649 2936 3472 2) 1) a b so rb a n c e ( a .u .) wavenumbers (cm-1 )(b)
400 0 3500 3000 2500 2000 1500 1000 500 945 1123 1370 1455 2891 2) 1) R a m a n I nt e n s ity ( a .u .) wavenumbers (cm-1) Figure 3Figure 4 Y=231803X + 663.14 R2 = 0.9882 Y=-48438X + 684.71 R2 = 0.917 0 250 500 750 1000 1250 1500 0,0000 0,0005 0,0010 0,0015 0,0020 0,0025 0,0030 Concentration (g.ml-1) ηs p/ c ; L nη re l/ c (m l.g -1 ) Huggings Plot (HPMC) Kraemer Plot (HPMC) (a) Y=89285X + 593.19 R2 = 0.9975 Y=-55714X + 581.05 R2 = 0.9835 0 250 500 750 1000 1250 1500 0,0000 0,0005 0,0010 0,0015 0,0020 0,0025 0,0030 Concentration (g.ml-1) η sp/c ; L nη re l/c (m l.g -1 )
Huggings Plot (HPMC-Si) Kraemer Plot (HPMC-Si)
(b) Figure 4
Figure 5 (a) 0,001 0,01 0,1 1 10 100 0,01 0,1 1 10 100 1000 10000 Shear rate (s-1) V is co si ty (P a. s) Experimental data Cross model 5% 1% (b) 0,001 0,01 0,1 1 10 100 0,01 0,1 1 10 100 1000 10000 Shear rate (s-1) V is co si ty (P a. s) Experimental data Cross model 5% 1% Figure 5
Figure 6 (a) 0,01 0,1 1 10 0,0001 0,001 0,01 0,1 1 10 100
Reduced shear rate
R ed u ce d v is co si ty Experimental data Cross model (b) 0,01 0,1 1 10 0,0001 0,001 0,01 0,1 1 10 100
Reduced shear rate
R ed u ce d v is co si ty Experimental data Cross model Figure 6
Figure 7 (a) h0=0.0072C4.20 (±0.032) R2=0.9863 h0=0.0113C4.41 (±0.014) R2=0.9834 0,001 0,01 0,1 1 10 100 0,1 1 10 C (%) h0 (P a. s) HPMC HPMC-Si Linear Fit (HPMC) Linear Fit (HPMC-Si)
(b) l=0.037C3.91 (±0.074) R2=0.9917 l=0.092C3.72 (±0.058) R2=0.9639 0,01 0,1 1 10 100 0,1 1 10 C (%) l ( m s) HPMC HPMC-Si Linear Fit (HPMC) Linear Fit (HPMC-Si)
Figure 8 0,01 0,1 1 10 100 1000 0,1 1 10 100 1000 Frequency (rad.s-1) G ' , G " (P a) G" HPMC-Si G' HPMC-Si G" HPMC G' HPMC 2 1 Figure 8
Figure 9 (a) 0,001 0,01 0,1 1 10 100 1000 0,01 0,1 1 10 100 1000 10000
Normalized frequency (rad.s-1)
N or m al iz ed m od u li ( P a) (b) 0,001 0,01 0,1 1 10 100 1000 0,01 0,1 1 10 100 1000 10000
Normalized frequency (rad.s-1)
N or m al iz ed m od u li ( P a) Figure 9
Figure 10 1 10 100 1000 10000 0 30 60 90 120 150 180 Time (min) G ' , G " (P a) 10Hz 3.2Hz 1Hz Figure 10
Figure 11 (a) 0,1 1 10 100 1000 10000 100000 1000000 0,1 1 10 100 1000 Frequency (rad.s-1) G ' , G " ( P a) (b) 0,01 0,1 1 10 0,1 1 10 100 1000 Frequency (rad.s-1) ta n (d) t=0min t=23min t=60min t=1200min Figure 11
Figure 12 0,1 1 10 100 0 30 60 90 120 150 180 Time (min) G ' , G " (P a) G' 1v0.5 G" 1v0.5 G' 1v1 G" 1v1 Figure 12
Table 1
Sample Product Metoxyl degree
of substitution Methoxyl (%) Hydroxypropyl molar substitution Hydroxypropyl (%) molecular weight b (g.mol-1)
HPMC Methocel® E4M 1.9 29.0 0.23 9.7 290 000
afrom certificate of analysis Dow Chemical Company bas determined by light scattering (Bourges et al., 2002).
Table 2 Polymer c (% w/w) 0 (Pa.s) (ms) n c(s-1) HPMC 1.0 0.010 0.000 0.031 0.004 0.831 0.099 -1.5 0.043 0.001 0.273 0.004 0.830 0.012 3668.00 58.64 2.0 0.073 0.002 0.430 0.024 0.786 0.013 2328.33 129.62 2.5 0.260 0.008 1.314 0.011 0.742 0.014 760.80 6.68 3.0 0.811 0.013 3.062 0.088 0.740 0.000 326.73 9.52 3.5 1.571 0.041 5.511 0.323 0.773 0.008 181.87 10.90 4.0 2.435 0.054 8.069 0.523 0.768 0.006 124.27 7.84 4.5 4.409 0.079 14.002 0.803 0.777 0.015 71.58 4.20 5.0 6.636 0.880 18.641 1.454 0.780 0.020 53.86 4.18 HPMC-Si 1.0 0.010 0.000 0.056 0.013 0.767 0.058 -1.5 0.055 0.000 0.440 0.002 0.750 0.000 2275.33 10.07 2.0 0.244 0.008 1.375 0.015 0.750 0.000 727.40 8.05 2.5 0.714 0.035 4.787 0.572 0.717 0.015 210.83 24.57 3.0 2.924 0.195 9.860 0.854 0.777 0.006 101.91 8.47 3.5 3.179 0.124 10.209 1.105 0.790 0.010 98.72 10.72 4.0 3.679 0.067 13.799 2.028 0.783 0.006 73.63 11.81 4.5 7.887 0.107 18.237 0.869 0.810 0.010 54.91 2.55 5.0 10.760 0.131 24.476 1.383 0.827 0.006 40.95 2.39 Table 2