HAL Id: hal-02676723
https://hal.inrae.fr/hal-02676723
Submitted on 31 May 2020
HAL is a multi-disciplinary open access
archive for the deposit and dissemination of
sci-entific research documents, whether they are
pub-lished or not. The documents may come from
teaching and research institutions in France or
abroad, or from public or private research centers.
L’archive ouverte pluridisciplinaire HAL, est
destinée au dépôt et à la diffusion de documents
scientifiques de niveau recherche, publiés ou non,
émanant des établissements d’enseignement et de
recherche français ou étrangers, des laboratoires
publics ou privés.
Only fibres promoting a stable butyrate producing
colonic ecosystem decrease the rate of aberrant crypt
foci in rats
P. Perrin, Fabrice H.F. Pierre, Y. Patry, Martine Champ, M. Berreur, G.
Pradal, Frédéric Bornet, K. Meflah, Jean Menanteau
To cite this version:
P. Perrin, Fabrice H.F. Pierre, Y. Patry, Martine Champ, M. Berreur, et al.. Only fibres promoting
a stable butyrate producing colonic ecosystem decrease the rate of aberrant crypt foci in rats. Gut,
BMJ Publishing Group, 2001, 48 (1), pp.53-61. �hal-02676723�
Only fibres promoting a stable butyrate producing
colonic ecosystem decrease the rate of aberrant
crypt foci in rats
P Perrin, F Pierre, Y Patry, M Champ, M Berreur, G Pradal, F Bornet, K Meflah, J Menanteau
Abstract
Background—Dietary fibres have been
proposed as protective agents against colon cancer but results of both epidemio-logical and experimental studies are in-conclusive.
Aims—Hypothesising that protection against colon cancer may be restricted to butyrate producing fibres, we investigated the factors needed for long term stable butyrate production and its relation to susceptibility to colon cancer.
Methods—A two part randomised blinded
study in rats, mimicking a prospective study in humans, was performed using a low fibre control diet (CD) and three high fibre diets: starch free wheat bran (WB), type III resistant starch (RS), and short
chain fructo-oligosaccharides (FOS).
Using a randomised block design, 96 inbred rats were fed for two, 16, 30, or 44 days to determine the period of adaptation to the diets, fermentation profiles, and eVects on the colon, including mucosal proliferation on day 44. Subsequently, 36 rats fed the same diets for 44 days were injected with azoxymethane and checked for aberrant crypt foci 30 days later.
Results—After fermentation had
stabi-lised (44 days), only RS and FOS produced large amounts of butyrate, with a trophic eVect in the large intestine. No diVerence in mucosal proliferation between the diets was noted at this time. In the subsequent experiment one month later, fewer aber-rant crypt foci were present in rats fed
high butyrate producing diets (RS,
p=0.022; FOS, p=0.043).
Conclusion—A stable butyrate producing
colonic ecosystem related to selected fi-bres appears to be less conducive to colon carcinogenesis.
(Gut 2001;48:53–61)
Keywords: fibre; fermentation; butyrate; colon carcinogenesis; aberrant crypt foci; rat
Although it had been suggested that dietary fibres can protect against colon cancer,1–4
the results are debatable and prevention pro-grammes have been limited to general lifestyle guidelines.5
Classically defined as non-starch polysaccharides, fibres now include other sources of fermentable substrate for micro-flora, such as resistant starches, oligosaccha-rides, and endogenous substrates.6
According to the origin of their partial resistance to á
amylase, resistant starches have been classified into type I (physically inaccessible), type II (semicrystalline structure), and type III (retro-graded starch).7
Among fibres, carbohydrates producing large amounts of butyrate appear to be of greatest interest as butyrate is an energy yielding substrate for colonocytes, aVects cellular function, is an antineoplastic agent in vitro, and has been implicated in the protective eVect of fibre in rodents.3 8 9
However, some in vivo studies have shown no protection, even with known butyrate producing fibres. These conflicting results may relate to the heterogen-eity of the fibre and basal diet, feeding protocol, animal model, chosen biomarker, and/or stage of colon carcinogenesis.
To clarify this issue, we focused on the butyrate hypothesis and the initiation stage. To control factors other than butyrate, the study was planned both for fibre source and in vivo parameters. Sources were wheat bran, resistant starch, and fructo-oligosaccharides. Wheat bran produces high concentrations of bu-tyrate10 11
and was protective in animal stud-ies.3 4
However, it is a mixture of proteins, lignin, cellulose, hemicelluloses, and entrapped starch.12
As starch produces butyrate,13 14 wheat bran was rendered starch free. The eVect of starch itself was monitored by type III resistant starch, and the eVects of butyrate were distinguished from those related to the physico-chemical characteristics of starch by use of another butyrate producing fibre, short chain fructo-oligosaccharides.6 15
An 8% level of fibre was chosen, suYcient to produce a physiologi-cal eVect without inhibiting growth16
and approximating the highest level found in West-ern diets.3
Moreover, 8% wheat bran was pro-tective against carcinogenesis in rats.4
The control diet was low fibre to allow normal intestinal transit and avoid mucosal atrophy.17 The basal diet was not high fat to avoid a pro-moting eVect not within the scope of the study. We did not use sucrose but digestible starch to balance the diets, as sucrose increases colono-cyte proliferation and susceptibility to initia-tion.18
Although studies characterising their fermentation have shown that the colonic eco-system needs time to adapt to fibres,19–21
most experiments on carcinogenesis have involved a
Abbreviations used in this paper: AC, aberrant crypt; ACF, aberrant crypt foci; AOM, azoxymethane; CD, low fibre control diet; FOS, short chain fructo-oligosaccharide enriched diet; PCNA, proliferating cell nuclear antigen; RS, type III resistant starch enriched diet; SCFA, short chain fatty acid; WB, starch free wheat bran enriched diet. Human Nutrition Research Centre of Nantes, INSERM U419, Institut de Biologie, 9 quai Moncousu, 44035 Nantes Cedex 01, France P Perrin F Pierre Y Patry K Meflah J Menanteau Laboratoire d’Histologie, Faculté de Médecine, Nantes, France M Berreur G Pradal Human Nutrition Research Centre of Nantes, INRA, Laboratoire des Fonctions Digestives et de Nutrition Humaine, Nantes, France M Champ Eridania Béghin-Say, Vilvoorde Research and Development Centre, Nutrition and Health Service, Vilvoorde, Belgium F Bornet
Correspondence to: Dr P Perrin, INSERM U419, Institut de Biologie, 9 quai Moncousu, 44035 Nantes Cedex 01, France. [email protected] Accepted for publication 4 April 2000
very short (if any) period of adaptation before injection of the carcinogen. Thus we deter-mined the time needed to achieve stabilisation before evaluating the protective eVect of fibres with aberrant crypt foci (ACF), one of the most reliable intermediate biomarkers of colon cancer.4 22–30
ACF were induced by azoxymeth-ane (AOM), which cannot be adsorbed by fibres,31
which would have interfered with the study of the eVects of butyrate alone.
Materials and methods
STUDY DESIGN
This two part study was carried out on 10 week old rats. The first set of experiments estimated the time needed for adaptation to fibre and sta-bilisation of the colonic ecosystem. Samples of large intestine were harvested on day 44 to check the proliferation status at the time chosen for induction of ACF. In the second set of experiments, rats fed the same diets were injected with AOM on day 44. All analyses were performed blind: only the person in charge of animal care knew the diet allocations. Codes were broken only for statistical analysis.
EXPERIMENTAL DIETS(TABLE1)
Diets used before rats were fed experimental diets were from UAR (Villemoisson-sur-Orge, France). Cellulose was Arbocel type B00 (Durieux, Marne-la-Vallée, France). Wheat bran was rendered starch free using an enzymatic method.32
Type III resistant starch (Cerestar) was a retrograded high amylose corn starch. Short chain fructo-oligosaccharides (glucose-fructosen, n=4) were produced from sucrose using a fungal fructo-syltransferase (Actilight P, Béghin-Meiji Indus-tries, Neuilly-sur-Seine, France). Indigestible carbohydrate was analysed as total dietary fibre33
in wheat bran, and as resistant starch34 in corn starch.
ANIMALS
Inbred BDIX rats (IVa-Credo, L’Arbresle, France) were chosen to minimise interanimal variance. Rats bred in our facilities were used
for the first experiment, allowing randomisa-tion of the animals with blocking factors and their staggered inclusion. Rats were housed in suspended stainless steel wired cages. Diet and tap water were provided ad libitum. All animal handling procedures were done in accordance with the rules of the French Ministry of Agriculture (agreement No A44565).
PROTOCOL FOR THE FIRST EXPERIMENT:STUDY
OF FIBRE FERMENTATION(FIG1)
The 96 rats were randomised in blocks of four rats, controlling the variability related to age, sex, parents, and ante/perinatal epigenetic fac-tors. At 8–10 weeks of age, rats received the experimental diets. All subsequent procedures (except feeding) were performed blind. Animal growth was estimated from relative weights, that is weight gain from week 1, calculated as follows: weight gain at week x = (weight at week
x−weight at week 1)/weight at week 1.
SAMPLE HARVESTING FOR THE FIRST EXPERIMENT
The large intestine was isolated by tying the ileocecal and anorectal junctions and then removed and weighed. The length of the full large intestine was measured from the caecal apex to the anorectal junction, using a vertical measure with a constant 10 g tension. The three large intestine segments (caecum, and proximal and distal colon) were tied to isolate the contents. The middle of the colon roughly defined the junction between the proximal and distal colon. The full segments were separated, weighed, and put on ice. Three aliquots of content per segment were isolated in the following order of priority: short chain fatty acid (SCFA), residual starch, and lactate assays. Mucosal samples were harvested for immunohistochemical studies.
ASSAY OF FERMENTATION PRODUCTS
SCFA concentrations were measured by gas chromatography (Delsi 300, Argenteuil, France) using a Chromosorb W-AW 60-80 mesh column (Saint-Quentin Fallavier, France).35
Residual starch was analysed using an enzymatic method.34
Lactic acid was quan-tified by a UV enzymatic method (Boehringer, Mannheim, Germany).
IMMUNOHISTOCHEMISTRY AND PROLIFERATION INDEXES
Samples were labelled with peroxidase labelled monoclonal mouse antiproliferating cell nu-clear antigen (PCNA) antibody (Dako, Carpinteria, California, USA). Measurements were performed with the AxioHome system (Zeiss, Jena, Germany).
PROTOCOL FOR THE SECOND EXPERIMENT:
INDUCTION OF ACF WITH AOM
Thirty six rats were fed powdered experimental diets for 44 days and were then injected subcu-taneously with AOM (Sigma, St Quentin, France) using the standard procedure.21
Diets were continued until sacrifice to avoid any uncontrolled disturbance of the colonic ecosys-tem. Rats were weighed once a week from D0 until sacrifice one month later.
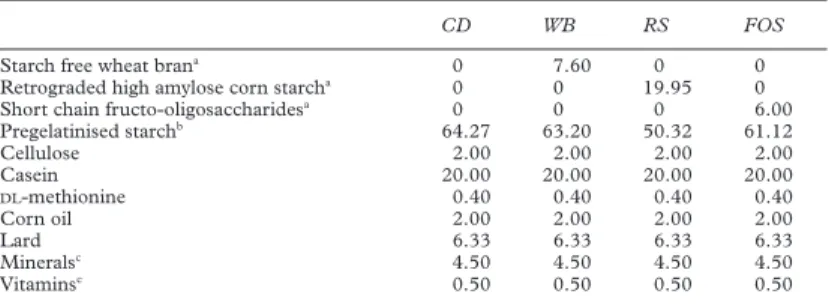
Table 1 Composition (g) of the experimental powdered diets (low fibre control diet (CD), starch free wheat bran enriched diet (WB), type III resistant starch enriched diet (RS), and short chain fructo-oligosaccharide enriched diet (FOS))
CD WB RS FOS
Starch free wheat brana 0 7.60 0 0
Retrograded high amylose corn starcha 0 0 19.95 0
Short chain fructo-oligosaccharidesa 0 0 0 6.00
Pregelatinised starchb 64.27 63.20 50.32 61.12 Cellulose 2.00 2.00 2.00 2.00 Casein 20.00 20.00 20.00 20.00 DL-methionine 0.40 0.40 0.40 0.40 Corn oil 2.00 2.00 2.00 2.00 Lard 6.33 6.33 6.33 6.33 Mineralsc 4.50 4.50 4.50 4.50 Vitaminsc 0.50 0.50 0.50 0.50
The control diet was a low fibre diet containing 2% cellulose.
a
Each fibre source provided 5.8% (dry matter) indigestible carbohydrates in addition to cellulose. Starch free wheat bran contained 78.93% total fibre (digestibility 34.33%) and 0.51% remaining starch. Type III resistant starch provided 30.07% indigestible starch. FOS consisted only of
indi-gestible carbohydrates, the diVerence between the amount of FOS and indigestible carbohydrates
provided corresponding to the moisture of the fibre.
b
The amount of pregelatinised digestible starch was calculated so that the sum of the fibre source plus digestible starch provided 257.1 kcal/g dry matter, as did the 64.27 g pregelatinised starch of the control diet. The energy contribution of the fibre sources was determined as 0.56 kcal/g dry matter for starch free wheat bran, 4 kcal/g dry matter for digestible starch, and 2.1 kcal/g dry matter for FOS.
c
INRA formula No 102.
COUNTING OF ABERRANT CRYPT FOCI
ACF were scored blindly twice, by two observ-ers, using the classical procedure, aberrant crypts (AC) being distinguished by their slit-like opening, increased staining, size, peri-cryptal zone, and slight elevation compared with normal crypts.25 36
Homogeneity of records from both observers was controlled using Pearson’s correlation. ACs are rare, and a single AC is not always easily distinguishable from a normal crypt. To favour specificity, AC and ACF values for each segment of rat colon (proximal colon, and upper and lower distal colon) were the minimum count, regardless of the observer, thereby reducing the risk of false positives. The total numbers of AC and ACF per rat were calculated as the sum of these con-structed values from each segment.
STATISTICAL ANALYSES
Data were studied in the context of the general linear model, either ranked or transformed values being used when needed.37–39
Interac-tions were included in the models, except when the block factor was used. For analyses of vari-ance (ANOVA), comparisons of means were performed with Fisher’s least significant di Ver-ence test with Bonferroni’s correction or, for repeated measures analyses, with orthogonal contrasts comparing each of the fibre enriched diets to the low fibre diet. As fermentation was considered as a whole, with tightly correlated data relating to the metabolism of one fibre by a unique microflora throughout the large intes-tine of a single rat, mixed models of ANOVA with repeated measures were applied to the spatially correlated data40
of fermentation from each rat (referred to as the vector of one given
SCFA), that is SCFA concentrations from the caecum, and proximal and distal colon. The models used are given close to the results, or with their illustration. All tests were two tailed, and statistical significance was assigned at p<0.05. Analyses were done with Systat 5.2.1 for the Macintosh (Evanston, Illinois, USA).
Results
CHANGES OVER TIME IN THE FERMENTATION OF
EACH EXPERIMENTAL DIET(FIGS2,3)
Analyses were performed on ranked data as variances diVered considerably according to the feeding period and block. As the sex eVect was not significant, it was not included in the models. When the time eVect was significant, orthogonal contrasts were run to compare D2 with later times (coded D>16). When this test was non-significant, changes along the four time periods were explored using linear con-trasts (monotonic relationship). Global trends emerged from statistical analyses. First, vari-ances were high at D16 and D30, probably because of the transition period in adapting to diets, and then decreased at D44. Secondly, changes in fermentation of a given diet over time were especially qualitative.
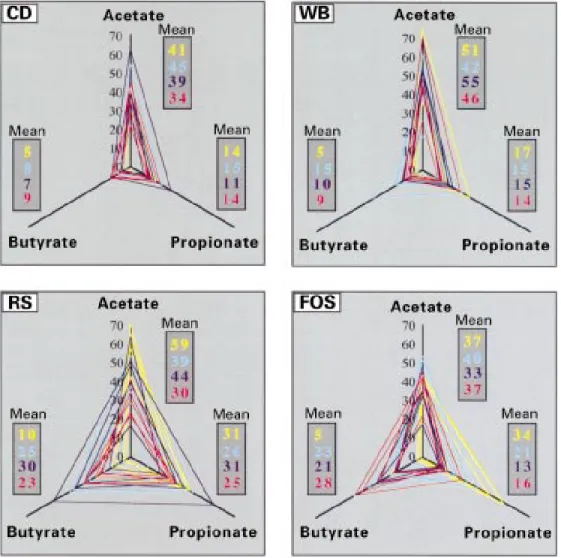
Fermentation of the low fibre control diet (CD) was homogeneous over time. A mono-tonic decrease in acetate (p=0.005) and a monotonic increase in butyrate (p=0.03) was observed only in the caecum. Fermentation of the starch free wheat bran enriched diet (WB) led to an increase in butyrate from D2 to D16 in the caecum (p=0.01) and proximal colon (p=0.03), and then a progressive decrease to a level on D44 close to that on D2. In rats fed the type III resistant starch enriched diet (RS), the
Figure 1 Protocol for the study of experimental diet fermentation. Rats (n=96) were randomised before the start of the experiment into 24 blocks (six blocks for each feeding period), one block representing a group of four rats of the same litter and sex. Staggered inclusion of blocks allowed the processing of only one block per sacrifice day, within a period (about one hour) short enough to ensure that all contents could be considered as at the same stage of fermentation. As a possible “experimenter eVect” related to the long study period could not be eliminated, inclusion of the 24 blocks was randomised so that all sacrifice days were determined before the experiment began. Blocks were included (median age 46 days) after sex determination and according to these criteria. The four rats of each block, housed in a single cage, were fed successively A03 breeding diet and A04 maintenance diet (UAR). Two weeks before day 0 (D0), rats were housed one per cage and fed powdered maintenance diet. At D0 (median age 72 days), each animal from a block received one of the four experimental diets (table of permutated randomised blocks) and underwent the feeding period allocated by randomisation. Animals were weighed weekly throughout the experiment, from week 1 (at D2) to the day of sacrifice: D16, D30, or D44. Previous studies showed that short chain fatty acid concentrations increased following consumption of the meal and then stabilised during the 8–12 hour postprandial period. Even fed at libitum, rats had the highest consumption of food at the beginning of the dark period. Rats were thus sacrificed 10 hours later, one block at a time, in the order of their codes.
3 blocks of males 3 blocks of females Feeding time: 2 days 3 blocks of males 3 blocks of females Feeding time: 16 days 3 blocks of males 3 blocks of females Feeding time: 30 days 3 blocks of males 3 blocks of females Feeding time: 44 days D0-1 4 D0 S ex determination: inclusion of bloc ks Period 1 UAR A04 pellets 1 cage = 1 block Period 2 UAR A04 powder 1 cage = 1 block Period 3 Experimental diet powder 1 cage = 1 rat Diet
main modifications occurred between D2 and D>16: compared with D2, acetate decreased in the caecum (p=0.001) and proximal colon (p=0.003), while butyrate increased in the cae-cum (p=0.02), and proximal (p=0.007) and distal colon (p=0.009), leading to an equilib-rium between the three major SCFAs after D16. Only caecal acetate was modified further, decreasing monotonically from D16 to D44 (p=0.03). Total SCFAs decreased monotoni-cally over time in the caecum (p=0.01) and proximal colon (p=0.02), paralleling the de-crease in acetate. No modifications were noted for propionate. These major qualitative changes suggested that an adaptive period was needed which was defined by measuring residual starch in the caecum. Throughout the experiment, butyrate was negatively correlated with residual starch (p<0.001) which de-creased over time (fig 4). The variance in
residual starch for RS was similar to that of other diets only at D44. Fermentation of the short chain fructo-oligosaccharide enriched diet (FOS) produced a large amount of propi-onate, and then progressively of butyrate. There were no modifications in total SCFAs but only qualitative ones concerning propion-ate and butyrpropion-ate. A monotonic decrease in pro-pionate was observed from D2 to D30 in all segments (p values 0.03–0.06), whereas it was stable from D30 to D44. From D2 to D44, butyrate increased monotonically in all seg-ments (p values from 0.001 to 0.02), the main changes between D16 and D44 concerning the caecum (fig 5). Lactate accumulation diVered in the short and long term (table 2). Changes in fermentation over time were thus associated with all fibre enriched diets. WB showed a transient increase in butyrate concentration in the upper large intestine, RS produced high
Figure 2 Changes over time in the fermentation of the four diets (low fibre control diet (CD), starch free wheat bran enriched diet (WB), type III resistant starch enriched diet (RS), and short chain fructo-oligosaccharide enriched diet (FOS)) along the large intestine. Twenty one blocks (84 rats) instead of 24 were used for this part of the study as some samples were lost. On the y axis are the concentrations of short chain fatty acids (acetate, propionate, and butyrate), expressed in µmol/g wet content. Values from the caecum (C), and proximal (P) and distal (D) colon of each rat are linked together, each line thus representing the individual fermentation pattern along the large intestine of one rat. When there were missing values for proximal colon concentrations (low content), points were plotted to mark the concentrations in the caecum and distal colon, but not linked.
80 70 60 50 40 30 20 10 0 D02 WB 80 70 60 50 40 30 20 10 0 D14 80 70 60 50 40 30 20 10 0 D30 80 70 60 50 40 30 20 10 0 D44 C P Acetate D C P Propionate D C P Butyrate D 80 70 60 50 40 30 20 10 0 D02 CD 80 70 60 50 40 30 20 10 0 D14 80 70 60 50 40 30 20 10 0 D30 80 70 60 50 40 30 20 10 0 D44 C P Acetate D C P Propionate D C P Butyrate D 80 70 60 50 40 30 20 10 0 D02 FOS 80 70 60 50 40 30 20 10 0 D14 80 70 60 50 40 30 20 10 0 D30 80 70 60 50 40 30 20 10 0 D44 C P Acetate D C P Propionate D C P Butyrate D 80 70 60 50 40 30 20 10 0 D02 RS 80 70 60 50 40 30 20 10 0 D14 80 70 60 50 40 30 20 10 0 D30 80 70 60 50 40 30 20 10 0 D44 C P Acetate D C P Propionate D C P Butyrate D
concentrations of butyrate throughout the large intestine after D16, and FOS led to high concentrations of propionate and lactate in the short term, and of butyrate in the long term (fig 5).
COMPARISON OF FIBRE ENRICHED DIETS WITH THE LOW FIBRE DIET FOR EACH FEEDING PERIOD
The model vector=diet+block was used, with a variance stabilising transformation (Y=log (SCFA concentration+1)). Fermentation of WB produced more acetate (p=0.007) and propionate (p=0.01) in the distal colon at D2, and more butyrate in the caecum at D16 (NS) and D30 (p=0.05). On D44 however, WB fer-mentation was similar to that of CD. Fermen-tation of RS was qualitatively similar (relative concentrations) to that of CD at D2. Both acetate and propionate were higher in the proximal (p=0.01) and distal (p=0.007) colon. The higher concentration of butyrate was not significant. For longer feeding periods, RS pro-duced more butyrate (p values 0.5–0.005 depending on the segment and feeding period)
and propionate (only on D30 and D44; p values 0.03–0.004). Fermentation of FOS was
Figure 3 Changes over time in the relationships between the major short chain fatty acids (SCFAs) issued from fermentation of the four diets (low fibre control diet (CD), starch free wheat bran enriched diet (WB), type III resistant starch enriched diet (RS), and short chain fructo-oligosaccharide enriched diet (FOS)). The axes indicate individual mean large intestine concentrations (an average of caecum, and proximal and distal colon concentrations, expressed in µmol/g wet content) of acetate, propionate, and butyrate for each rat. These values are linked to form a triangle representing the mean fermentation pattern of the rat. The triangle area is proportional to global SCFA production, and the ratio (relative concentration) of each SCFA can be determined from the shape of the triangle, regardless of its size: the more acute the angle, the higher the ratio. Each dark gray box indicates the mean values of one SCFA concentration for a given time and diet. Colour coding for feeding periods is yellow for D2, blue for D16, dark blue for D30, and red for D44.
Figure 4 Residual starch concentration in the caecum of rats fed the resistant starch enriched diet (RS) for 2, 16, 30, or 44 days. Each point represents one rat.
60 50 40 30 20 10 0 2 R esidual starc h (mg/g wet content) 16 30 Time (days) 44
also diVerent from that of CD, with more pro-pionate on D2 (p values 0.03–0.002), and more butyrate from D16. On D16, butyrate was higher only in the caecum (p=0.03), and on D30 and D44 in all segments (p values 0.008–0.003).
Although inbred rats were used, production of butyrate within the blocks did not become homogeneous before D44 (fig 4). Further-more, some yet undetermined factors in individual rats influenced the intensity of the response to diets: on D44, diVerences between high and low butyrate producing diets were proportional to the “basal” level of butyrate production (CD) within a given block (fig 4). Because of this observation, and because variances were lowest on D44 (time-eVect on fermentation, residual starch concentration), D44 was chosen to study the eVects of diet on the colon mucosa (proliferation and suscepti-bility to carcinogen).
EFFECT OF DIETS ON MORPHOMETRICS AND MUCOSA PROLIFERATION
Regardless of sex and duration of diet, weight gain (repeated measures analyses) and weight at sacrifice (model: weight=diet+time) showed no dependence on diet. On D2 there were no diVerences according to diets for either large intestine length (model: length=diet+sex) or wet weight (model: weight=diet+sex+large intestine
length, mainly reflecting the eVect of diet on the
weight of content). As the time eVect was found to be non-significant in rats fed for at least 16 days, we used two way models. In rats fed for at least 16 days, large intestine length was related both to sex and diet: the large intestine was longer when rats were fed one of the butyrate producing diets (RS, p<0.001; FOS, p=0.01). Although the caecum was the most aVected, the colon was also longer, espe-cially with the RS diet. Wet weights were linked to diet, sex, and large intestine length (p<0.001). The weight of the large intestine content was greater with all fibre enriched diets (RS and FOS, p<0.001; WB, p=0.08, NS). The contents were not distributed in the same way. In the caecum, RS (p=0.002) and FOS (p=0.04) showed heavier contents than CD. In the colon, however, all fibre enriched diets showed heavier contents (males, 1.3-fold; females, 1.5-fold) than CD (WB, p<0.001; RS, p=0.004; FOS, p=0.07, NS). The trophic eVect of RS and FOS, which led to a macroscopically longer large intestine and larger caecum, was confirmed microscopically for the caecum (table 3). Neither the number of PCNA positive cells nor the height of the proliferative zone was diet related for any segment.
EFFECT OF DIET ON AZOXYMETHANE INDUCED
ABERRANT CRYPT FOCI(TABLE4)
As there was no eVect of sex on fermentation, and colon morphometrics depend on sex, only male rats were used. Neither weight gain nor weight at sacrifice diVered among diets. Counts by both observers were very similar (ACF,
r=0.92, p<0.001; AC, r=0.95, p<0.001), and
discrepancies concerned mainly single ACFs.
Figure 5 Time and interindividual eVects on the mean butyrate large intestine concentration (µmol/g wet content) in rats from the 21 blocks (four rats of the same litter, sex, and feeding period) in this part of the study. The four rats of one block are on the same vertical. To facilitate interpretation, lines have been drawn linking the butyrate
concentrations of animals fed the same diet for a given period. On D44, mean butyrate concentrations were higher for the short chain fructo-oligosaccharide enriched diet (FOS) than for the type III resistant starch enriched diet (RS), but this was only due to higher caecal concentrations. 50 40 30 20 10 0
C4 mean concentration in the large
intestine ( µ mol/wet content) 1 2 3 4 D2 5 6 7 8 9 10 D16 11 12 13 14 15 16 D30
24 blocks of 4 homogeneous rats (same sex and litter)
17 18 19 20 21 22 D44 23 24 CD WB RS FOS
Table 2 Lactate concentration in rats fed experimental diets (low fibre control diet (CD), starch free wheat bran enriched diet (WB), type III resistant starch enriched diet (RS), and short chain fructo-oligosaccharide enriched diet (FOS)) for 2 (D2) or 44 (D44) days
CD WB RS FOS D2 Caecum 16.3 (8.4–24.3) 12.6 (8.7–15.5) 9.3 (4.5–21.6) 76.1 (25.6–77.2) n=5 n=5 n=5 n=5 Colon 5.7 (ND) 9.4 (3.3–15.6) 8.0 (5.1–28.3) 39.1 (33.8–44.8) n=1 n=4 n=3 n=3 D44 Caecum 11.9 (8.5–28.4) 21.4 (11.3–28.4) 11.1 (4.9–20.9) 22.4 (19.5–34.6) n=5 n=5 n=4 n=5 Colon 7.1 (ND) 8.7 (8.2–10.1) 7.5 (3.2–21.9) 21.2 (9.6–39.2) n=1 n=3 n=4 n=4
Results are expressed as median (min–max) of the sum ofD-lactate andL-lactate concentrations
(µmol/g wet content) measured in contents of rats for which a suYcient amount remained after
aliquoting for short chain fatty acid and residual starch assays. As concentrations ofD- and
L-lactate isomers were similar, only total concentrations are indicated.
Statistical analyses (ANOVAs on ranked data followed by Bonferroni’s test) were only performed for the caecum, using the model: Y=diet+block. At D2, FOS was significantly diVerent from CD
(p =0.017); at D44, the diet eVect was not significant.
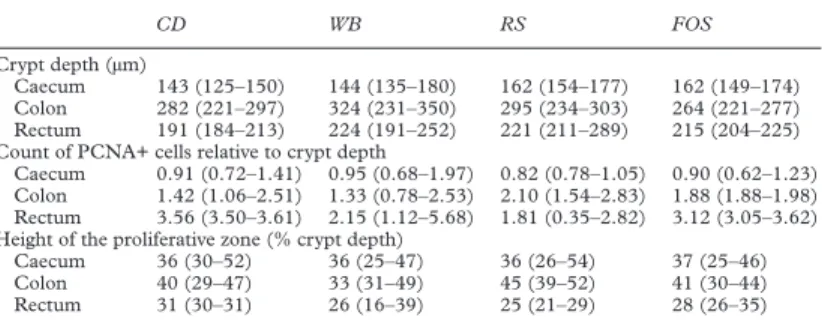
Table 3 Crypt depth and proliferation status in rats fed the experimental diets (low fibre control diet (CD), starch free wheat bran enriched diet (WB), type III resistant starch enriched diet (RS), and short chain fructo-oligosaccharide enriched diet (FOS)) for 44 days (median (min–max))
CD WB RS FOS
Crypt depth (µm)
Caecum 143 (125–150) 144 (135–180) 162 (154–177) 162 (149–174)
Colon 282 (221–297) 324 (231–350) 295 (234–303) 264 (221–277)
Rectum 191 (184–213) 224 (191–252) 221 (211–289) 215 (204–225)
Count of PCNA+ cells relative to crypt depth
Caecum 0.91 (0.72–1.41) 0.95 (0.68–1.97) 0.82 (0.78–1.05) 0.90 (0.62–1.23)
Colon 1.42 (1.06–2.51) 1.33 (0.78–2.53) 2.10 (1.54–2.83) 1.88 (1.88–1.98)
Rectum 3.56 (3.50–3.61) 2.15 (1.12–5.68) 1.81 (0.35–2.82) 3.12 (3.05–3.62)
Height of the proliferative zone (% crypt depth)
Caecum 36 (30–52) 36 (25–47) 36 (26–54) 37 (25–46)
Colon 40 (29–47) 33 (31–49) 45 (39–52) 41 (30–44)
Rectum 31 (30–31) 26 (16–39) 25 (21–29) 28 (26–35)
For each rat (n=16, four blocks), samples labelled with antiproliferating cell nuclear antigen (PCNA) were issued from the caecum (caecal apex), colon (upper part of the distal colon), and rectum (end of the distal colon). Only crypts with a lumen visible from bottom to top were taken into account, and 30–50 crypts per large intestine segment were analysed. All observations were performed blind. The measurements were the depth of the crypt (upper limit: just under the sur-face epithelium), the number of PCNA positive cells per crypt, and the height of the proliferative zone (upper limit: top of the highest labelled cell). Two proliferation indexes were constructed: ratio of positive cells to crypt depth, and height of the proliferative zone relative to crypt depth. For each rat, the mean values for observed crypts were determined per segment.
Analyses of the eVect of diet were performed independently for the caecum, colon, and rectum.
Ranked data were analysed using the ANOVA model: Y=diet+block, followed by Bonferroni’s test. In the caecum, crypts were deeper with RS (p =0.048) and FOS (p =0.078, NS) than with CD.
No proliferation index was statistically diVerent between fibre enriched diets and CD. The
prolif-erative zone was always limited to the lowest 60% of crypts (maximum height 54%).
Rats fed either butyrate producing fibre diets had a lower amount of ACF in the colon than those fed CD (RS, p=0.022; FOS, p=0.043). Crypt multiplicity (AC/ACF ratio) did not dif-fer among diets.
Discussion
Our study has shown that for stable high butyrate production throughout the colon, both the substrate and time are critical factors in adult rats. At least two weeks are needed for adaptation to resistant starch,19
and four weeks to stabilise faecal weight and pH.21
In our study, butyrate increased unexpectedly over time with CD, maybe because starch, present in a larger amount than in the previous maintenance diet, partially escapes digestion in the small intestine.7 13 41
In contrast with other studies, WB was not a good long term butyrate producer. Entrapped starch may have been fer-mented to butyrate in these studies.20 42
In a four week experiment it was found that coarse (but not fine) wheat bran produced a high butyrate faecal concentration,21
with similar butyrate and propionate ratios, a classical fermentation profile for starch41 43 44
observed in our study. The transient butyrate production by WB could not be due to the fermentation of the fibre itself as the remaining indigestible components are readily fermentable, but rather produce acetate (hemicelluloses, mainly xy-lans)43
or poorly fermentables (cellulose and lignin). The substrate(s) leading to butyrate production could be wheat bran proteins12 45
or partially protected available starch escaping digestion.46
Endogenous substrates such as mucus or exfoliated cells could not be ex-cluded6
as wheat bran particles that could abrade the mucosa were observed macroscopi-cally as far as the proximal colon. Thus changes in WB fermentation may involve a host adapta-tion (increased secreadapta-tion with time of proteo-lytic enzymes orá amylase, modifications of the mucosa) rather than a microflora adaptation. Although RS and FOS were ultimately high butyrate producers, diVerences were observed along the adaptive period. Adaptation of the microflora can be quantitative (bacterial
growth) and/or qualitative, involving bacteria cooperation41 47
and induction of specific activi-ties.48
Both RS and FOS ultimately induced bacterial growth, as indicated by caecal en-largement and increased weight.19 21 49 DiVer-ences between diets on D2 (our baseline) could only have been due to induction of specific activities of the microflora then present, and which were adapted to the previous mainte-nance diet. Fibres were fermented towards acetate (starch, and to a lower extent wheat bran), or propionate and lactate (FOS). This accumulation of lactate suggested that bacte-rial glycolysis to lactate was more rapid than its further metabolism to SCFA.43 50
The forma-tion of propionate from lactate through the alternative acrylate pathway could explain its high concentration.41 47
From D16, butyrate concentration increased, as shown when rats were fed 5% cellulose+6% fructo-oligosaccharides for 14 days.49
For RS, the typical fermentative pattern was apparent as early as D16, subsequent adaptation leading to a more complete breakdown of the fibre, until stabilisation on D44.
At the end of the adaptive period, we classi-fied the diets as high butyrate (RS and FOS) and low butyrate (WB and CD) producers, the other SCFAs and the physicochemical charac-teristics of the fibres being diVerent. As determination of SCFA was crucial, labelling of PCNA, a validated proliferation marker,15 51 52
was chosen to avoid the need to handle rats before sacrifice. It was important to control mucosal proliferation at the time chosen for induction as this could have modified the response to the carcinogen. The fact that no diVerences were observed between low and high fibre diets, or between low and high butyrate producing diets is not particu-larly surprising. When fibres stimulated prolif-eration, it was linked to SCFAs, especially butyrate, as also observed with colonic explants.15 53–55
However, as in our study, the proliferating cells remained in the lower 60% of the crypt.56 57
In contrast, in the context of high fat diets, which induce hyperproliferation with upward shift of the proliferative compartment, proliferation was decreased with starch.58 However, as slow release pellets of sodium butyrate had no eVect in the same context,59
the decrease may be linked to the ability of starch to bind bile acids.60
Most stimulatory eVects of fibres and/or SCFAs were observed after short term ingestion of isolated fibres compared with fibre free diets, or during post-starvation recovery.17
Increasing butyrate concentration to more than 10 mmol/l in human caecal biop-sies did not result in a further increase in cell labelling.15
Such a plateau could explain our results as the control diet produced butyrate. However, the duration of the experiment was probably the main reason. In other long term studies, no (or a very modest) increase in proliferation21 56–57 61
occurred with high fibre diets, and SCFAs did not correlate with various mucosal growth characteristics.21 56 62 63
In rats fed a high fibre diet (guar gum), proliferation of distal colonic mucosa returned to the level of the control diet after a transient increase over a
Table 4 Susceptibility to azoxymethane (AOM) of rats fed experimental diets (low fibre control diet (CD), starch free wheat bran enriched diet (WB), type III resistant starch enriched diet (RS), and short chain fructo-oligosaccharide enriched diet (FOS)) for 44 days
CD WB RS FOS
ACF count (mean (SEM))
A 75.00 (3.24) 68.25 (12.97) 51.25 (10.14) 48.00 (6.74)
B 40.20 (2.73) 47.60 (7.98) 21.80 (7.81) 28.20 (6.72)
AC/ACF (mean (SEM))
A 1.51 (0.02) 1.65 (0.04) 1.98 (0.18) 1.55 (0.10)
B 1.17 (0.10) 1.19 (0.06) 1.03 (0.07) 1.24 (0.11)
Two batches of six week old rats (A, n=16; B, n=20) were successively included in the study within a two week period. Rats were housed four per cage (randomly constituted blocks) until the begin-ning of the nutrition study, and then one per cage. They were first fed UAR A04 (pellets then powder), and then from D0 (10 weeks old) the powdered experimental diet allocated by randomi-sation. On D44, rats were injected twice subcutaneously, one week apart, with 15 mg/kg AOM. For each batch, rats were sacrificed one month later, at a rate of one or two blocks a day, that is, aber-rant crypt foci (ACF) were scored 30–32 days after the first injection. The colon was separated longitudinally into two parts, only one was used for ACF count. The part kept for ACF count was divided into proximal and distal colon (according to the orientation of the mucosal folds), the lat-ter being subdivided into two equal parts (upper and lower). ACF and individual crypts inside were scored, and then the total number of aberrant crypts (AC) were calculated. The AC/ACF ratio is indicative of crypt multiplicity.
Results were analysed using the ANOVA model Y=diet+batch, followed by Bonferroni’s test. The batch eVect was always significant (p <0.001) whereas the diet eVect was significant only for ACF.
period of 9–21 days.52
The mucosa can also alter its growth characteristics by crypt duplication, increasing the number of crypts per unit length and total length in response to diet.16 17 63 64
Such an increase in length was apparent in our study with high butyrate producing diets, as well as deeper crypts in the caecum where fermentation was the most intensive.
In this study, both RS and FOS were protec-tive against the first stages of carcinogenesis whereas WB was not. The protective eVects had been related to a lower energy contribution, to dilution or adsorption of the carcinogen or to fermentation. Less weight gain, observed with high amounts of fibre, was avoided as was any adsorption of the carcinogen, because of the use of AOM.31
As all fibres led to a heavier content, any protective eVect linked to dilution of the carcinogen would have been the same. As carcinogenesis was induced in homogeneous inbred rats, with stable colonic ecosystems and the same proliferation status, the remaining dif-ferences related to fibre and its modifications of luminal factors (for example, the microflora and its activity) and mucosal physiology (for exam-ple, the colonocyte phenotype). A short term study was preferred, focusing on the initiation and post-initiation stages alone, as AOM alters the microflora (reducing SCFAs) and colono-cyte metabolism, and in the long term, interac-tions occur between the fibre source and the carcinogen.65
Furthermore, in nutrition studies, ACF count was a predictor of tumour incidence whereas the size of a focus (multiplicity) that could increase in time was not.28
In studies where resistant starch was not protective,28 66 type II instead of type III resistant starches were used, the period of adaptation to diets was very short, and rats were injected once a week for 10 or 20 weeks. Furthermore, as faecal starch con-tent and output (when reported) were very high,28
adaptation does not seem to have occurred in spite of the long course of the experiment, possibly because of modifications that the carcinogen induced in the colonic eco-system. However, we cannot exclude the fact that starch may be protective in the initiation stage, due to butyrate, and promotive in later stages, due to propionate, as observed with pro-pionate producing fibres.3 28 67 68
In the studies that showed a protective eVect against colon tumours in rats, the source of butyrate was unprocessed wheat bran, generally in the context of high fat diets that involve the release of a large amount of biliary acids. The deleteri-ous eVect of the associated propionate could have been oVset by other protective mecha-nisms such as trapping of luminal promot-ers.3 4 28
Our study indicates that butyrate is associ-ated with protection against the initial stages of colon carcinogenesis, regardless of the fibre source. Although fibre induced modifications of the microflora may be involved, it is more likely that butyrate itself is the eVector. Indeed, results similar to ours were obtained with slow release pellets of sodium butyrate, that is, no eVect on proliferation, and a lower count of ACF (albeit non-significant, may be due to the low number of rats) with no eVect on
multiplicity.59
That oral butyrate was not protective69 70
is probably due to its absorption before it reached the colon. The action of butyrate in situ is mediated by its capacity to modulate the colonocyte phenotype.9 15 71 72 However, it is likely that the colonic mucosa would not stabilise, thus colonocytes were of a given susceptibility to carcinogenesis, until the colonic ecosystem itself became stable. Hence long term adaptation to a diet may not only concern the microflora. The colonocyte is involved in complex tissue homeostatic inter-relationships with other mucosal cells, includ-ing immune cells. We have previously shown that butyrate modulates the phenotype and immunogenicity of rat colon cancer cells, allowing a specific immune response in the context of immunotherapy against intraperito-neal carcinomatosis.71 72
One possible mech-anism for the protective eVect of butyrate pro-ducing fibres could be stimulation of colonocyte immunogenicity as elevated im-mune cytotoxicity may contribute to inhibition of AOM induced ACF in rats.73
This hypoth-esis is supported by our results in another colon cancer model.74
From a preventive viewpoint, butyrate pro-ducing fibres seem very promising, although the nature and processing of the fibre need to be carefully controlled to provide suYcient production throughout the colon. Naturally occurring fibres such as wheat bran could be selected as several of their compounds provide synergic protective eVects. However, as the composition and processing of this fibre would interfere with its protective capacities, it may be preferable to use combinations of chemically well defined carbohydrates. This study may help define the carbohydrates of interest.
The authors are grateful to Paulette Fichet for animal care, to Françoise Kozlowski and Anne Riet for expert technical assist-ance, and to Pr Jean-Paul Galmiche for fruitful discussions. This work was supported by grants from the French Ministry of Research, Technology and Space, the Regional Council of the Pays de la Loire, and Eridania Béghin-Say (Nutrition and Health Service, Vilvoorde, Belgium).
1 Fuchs C, Giovannucci EL, Colditz GA, et al. Dietary fiber and the risk of colorectal cancer and adenoma in women. N
Engl J Med 1999;340:169–76.
2 Cummings JH, Bingham SA. Dietary fibre, fermentation and large bowel cancer. Cancer Surv 1987;6:601–21. 3 McIntyre A, Gibson PR, Young GP. Butyrate production
from dietary fibre and protection against large bowel cancer in a rat model. Gut 1993;34:386–91.
4 Alabaster O, Tang Z, Shivapurkar N. Inhibition by wheat bran cereals of the development of aberrant crypt foci and colon tumor. Food Chem Toxicol 1997;35:517–22. 5 Wasan HS, Goodlad RA. Fibre-supplemented foods may
damage your health. Lancet 1996;348:319–20.
6 Gibson GR, Willems A, Reading S, et al. Fermentation of non-digestible oligosaccharides by human colonic bacteria.
Proc Nutr Soc 1996;55:899–912.
7 Englyst HN, Kingman SM, Cummings JH. Classification and measurement of nutritionally important starch frac-tions. Eur J Clin Nutr 1992;46(suppl 2):S33–50. 8 Scheppach W, Barthram HP, Richter F. Role of short-chain
fatty acids in the prevention of colorectal cancer. Eur J
Cancer 1995;31A:1077–80.
9 Young GP, Gibson PR. Butyrate and the colorectal cancer cell. In: Binder HJ, Cummings J, Soergel K, eds. Short chain
fatty acids. Lancaster: Kluwer, 1994:148–59.
10 McBurney MI, Thompson LU. Fermentative characteristics of cereal brans and vegetable fibers. Nutr Cancer 1990;13: 271–80.
11 Champ M, Barry JL, Hoebler C, et al. Digestion and fermentation pattern of various fiber sources in the rat.
Animal Feed Sci Technol 1989;23:195–204.
12 Bourquin LD, Titmeyer EC, Garleb KA, et al. Short-chain fatty acid production and fiber degradation by human
colonic bacteria: eVects of substrate and cell wall
fractiona-tion procedure. J Nutr 1992;122:1508–20.
13 Scheppach W, Fabian C, Sachs M, et al. The eVect of starch malabsorption on fecal short chain fatty acid excretion in man. Scand J Gastroenterol 1988;23:755–9.
14 Weaver GA, Krause JA, Miller TL, et al. Cornstarch fermentation by the colonic microbial community yields more butyrate than does cabbage fiber fermentation; corn-starch fermentation rates correlates negatively with metha-nogenesis. Am J Clin Nutr 1992;55:70–7.
15 Scheppach W, Barthram P, Richter A, et al. EVects of short-chain fatty acids on the human colonic mucosa in vitro. J
Parent Enteral Nutr 1992;16:43–8.
16 Lupton JR, Kurtz PP. Relationship of colonic luminal short-chain fatty acids and pH to in vivo cell proliferation in rats.
J Nutr 1993;123:1522–30.
17 Goodlad RA, RatcliVe B, Fordham JP, et al. Does dietary fibre stimulate intestinal epithelial cell proliferation in germ-free rats? Gut 1989;30:820–5.
18 Bruce WR, Archer MC, Corpet DE, et al. Diet, aberrant crypt foci and colorectal cancer. Mutat Res 1993;290:111– 18.
19 Gee JM, Faulks RM, Johnson IT. Physiological eVects of
retrogradedá-amylase-resistant cornstarch in rats. J Nutr
1991;121:44–9.
20 Goodlad RA, Mathers JC. Large bowel fermentation in rats given diets containing raw peas (Pisum sativum). Br J Nutr 1990;64:569–87.
21 Folino M, McIntyre A, Young GP. Dietary fibers diVer in
their eVects on large bowel epithelial proliferation and fecal fermentation-dependent events in rats. J Nutr 1995;125: 1521–8.
22 Reddy BS, Maruyama H. EVect of fish oil on
azoxymethane-induced colon carcinogenesis in male F344 rats. Cancer Res 1986;46:3367–70.
23 Konstantakos AK, Siu I, Pretlow TG, et al. Human aberrant crypt foci with carcinoma in situ from a patient with sporadic colon cancer. Gastroenterology 1996;111:772–7. 24 Pretlow TP, Barrow BJ, Ashton WS, et al. Aberrant crypts:
putative preneoplastic foci in human colonic mucosa.
Can-cer Res 1991;51:1564–7.
25 Bird RP. Observation and quantification of aberrant crypts in the murine colon treated with a colon carcinogen: preliminary findings. Cancer Lett 1987;37:147–51. 26 Shivapurkar N, Tang ZC, Alabaster O. The eVects of
high-risk and low-high-risk diets on aberrant crypt and colonic tumour formation in F344 rats. Carcinogenesis 1997;13: 887–90.
27 Pretlow TP, O’Riordan MA, Somich GA, et al. Aberrant crypts correlate with tumour incidence in F344 rats treated with azoxymethane and phytate. Carcinogenesis 1992;13: 1509–12.
28 Young GP, McIntyre A, Albert V, et al. Wheat bran suppresses potato starch-potentiated colorectal tumorigen-esis at the aberrant crypt stage in a rat model.
Gastroenter-ology 1996;110:508–14.
29 Pories SE, Ramchurren N, Summerhayes I, et al. Animal models for colon carcinogenesis. Arch Surg 1993;128:647– 53.
30 Alabaster O, Tang Z, Shivapurkar N. Dietary fiber and the chemopreventive modelation of colon carcinogenesis.
Mutat Res 1996;350:185–97.
31 Ferguson LR, Harris PJ. Studies on the role of specific dietary fibres in protection against colorectal cancer. Mutat
Res 1996;350:173–84.
32 Hoebler C, Barry JL, David A, et al Enzymatic preparation and analysis of dietary fibre residues, suitable for in vitro fermentation studies. Food Hydrocolloids 1991;5:35–40. 33 Prosky L, Asp NG, Schweizer TF, et al Determination
of insoluble and soluble dietary fiber in foods and food products: collaborative study. J AOAC Int 1992;75: 360–7.
34 Faisant N, Planchot V, Kozlowski F, et al. Resistant starch determination adapted to products contening high level of resistant starch. Sci Alim 1995;15:83–9.
35 Jouany JP. Dosage des acides gras volatils et des alcools dans les contenus digestifs, le jus d’ensilage, les cultures bactéri-ennes et les contenus de fermenteurs anaérobies. Sci Alim 1982;2:131–44.
36 Tudek B, Bird RJ, Bruce WR. Foci of aberrant crypts in the colons of mice and rats exposed to carcinogens associated with foods. Cancer Res 1989;49:1236–40.
37 Kirby KN. Advanced data analysis with SYSTAT. New York: Van Nostrand Reinhold, 1993.
38 Mosteller F, Tuckey JW. Data analysis and regression: a second
course in statistics. Reading: Addison-Wesley, 1977.
39 Iman RL, Conover WJ. The use of rank transformation in regression. Technometrics 1979;21:499–506.
40 Barsoum GH, Thompson H, Neoptolemos JP, et al. Dietary calcium does not reduce experimental colorectal carcino-genesis after small bowel resection despite reducing cellular proliferation. Gut 1992;33:1515–20.
41 Edwards CA, Rowland IR. Bacterial fermentation in the colon and its measurement. In: Schweizer TF, Edwards CA, eds. Dietary fibre—A component of food. Nutritional
function in health and disease. London: Springer-Verlag,
1992:120–34.
42 McIntyre A, Young GP, Taranto T, et al. DiVerent fibers have diVerent regional eVects on luminal contents of rat colon. Gastroenterology 1991;101:1274–81.
43 MacFarlane GT, MacFarlane S. Factors aVecting fermenta-tion in the large bowel. Proc Nutr Soc 1993;52:367–73. 44 Cummings JH, Englyst HN. Fermentation in the human
large intestine and the available substrate. Am J Clin Nutr 1987;45:1243–55.
45 MacFarlane GT, Cummings JH. The colonic flora, fermen-tation, and large bowel digestive function. In: Phillips SF, Pemberton JH, Shorter RG, eds. The large intestine:
physiol-ogy, pathophysiolphysiol-ogy, and disease. New York: Raven Press,
1991:51–92.
46 Stephen AM. Starch and dietary fibre: their physiological and epidemiological interrelationships. Can J Physiol
Phar-macol 1991;69:116–20.
47 Cummings JH. Quantitating short chain fatty acid produc-tion in humans. In: Binder HJ, Cummings J, Soergel K, eds. Short chain fatty acids/Falk symposium 73. Dorbrecht: Kluwer Academic Publishers, 1994:11–19.
48 Salyers AA. Breakdown of polysaccharides by human bacte-ria. J Environment Pathol Toxicol Oncol 1985;5:211–31. 49 Campbell JM, Fahey GC, Wolf BW. Selected indigestible
oligosaccharides aVect large bowel mass, cecal and fecal short-chain fatty acids, pH and microflora in rats. J Nutr 1997;127:130–6.
50 Mortensen PB, Hove H, Clausen MR, et al. Fermentation to short-chain fatty acids and lactate in human faecal batch cultures. Scand J Gastroenterol 1991;26:1285–94. 51 Yamada K, Yoshitake K, Sato M, et al. Proliferating cell
nuclear antigen expression in normal, preneoplastic, and neoplastic colonic epithelium of the rat. Gastroenterology 1992;103:160–7.
52 Wilcox DK, Higgins J, Bertram TA. Colonic epithelial cell proliferation in a rat model of nongenotoxic induced colonic neoplasia. Lab Invest 1992;67:405–11.
53 Sakata T. EVect of indigestible dietary bulk and short-chain fatty acids on the tissue weight and epithelial cell prolifera-tion rate of the digestive tract in rats. J Nutr Sci Vitaminol 1986;32:355–62.
54 Sakata T. Stimulatory eVect of short-chain fatty acids on
epithelial cell proliferation in the rat intestine: a possible explanation for trophic eVects of fermentable fiber, gut microbes and luminal trophic factors. Br J Nutr 1987;58: 95–103.
55 Sakata T. Short-chain fatty acids as the luminal trophic fac-tor. Can J Anim Sci 1984;64(suppl):189–90.
56 Hara H, Suzuki K, Kobayashi S, et al. Fermentable property of dietary fiber may not determine cecal and colonic mucosal growth in fiber-fed rats. J Nutr Biochem 1996;7: 549–54.
57 Edwards CA, Wilson RG, Hanlon L, et al. EVect of the dietary fibre content of lifelong diet on colonic cellular pro-liferation in the rat. Gut 1992;33:1076–9.
58 Caderni G, Stuart EW, Bruce WR. Dietary factors aVecting
the proliferation of epithelial cells in the mouse colon. Nutr
Cancer 1988;11:147–53.
59 Caderni G, Luceri C, Lancioni L, et al Slow-release pellets of sodium butyrate increase apoptosis in the colon of rats
treated with azoxymethane, without aVecting aberrrant crypt
foci and colonic proliferation. Nutr Cancer 1998;30:175–81. 60 Kritchevsky D. In vitro binding properties of dietary fibre.
Eur J Clin Nutr 1995;49(suppl):S113–15.
61 Lajvardi A, Mazarin GI, Gillespie MB, et al. Starches of var-ied digestibilities diVerentially modify intestinal function in rats. J Nutr 1993;123:2059–66.
62 Fleming SE, Fitch MD, De Vries S. The influence of dietary fiber on proliferation of intestinal mucosal cells in miniature swine may not be mediated primarily by fermen-tation. J Nutr 1992;122:906–16.
63 Whiteley LO, Purdon MP, Ridder GM, et al. The interactions of diet and colonic microflora in regulating colonic mucosal growth. Toxicol Pathol 1996;24:305–14. 64 Frankel WL, Zhang W, Singh A, et al. Mediation of the
trophic eVects of short-chain fatty acids on the rat jejunum
and colon. Gastroenterology 1994;106:375–80.
65 Maciorowski KG, Turner ND, Lupton JR, et al. Diet and carcinogen alter the fecal microbial populations of rats. J
Nutr 1997;127:449–57.
66 Sakamoto J, Nakaji S, Sugawara K, et al. Comparison of
resistant starch with cellullose diet on
1.2-dimethylhydrazine-induced colonic carcinogenesis in rats.
Gastroenterology 1996;110:116–20.
67 Weaver GA, Tangel CT, Krause JA, et al. Dietary guar gum alters colonic microbial fermentation in azoxymethane-treated rats. J Nutr 1996;126:1979–91.
68 Jacobs LR. Relationship between dietary fiber and cancer: metabolic, physiologic, and cellular mechanisms. Proc Soc
Exp Biol Med 1986;183:299–310.
69 Freeman HJ. EVects of diVering concentrations of sodium
butyrate on 1,2-dimethylhydrazine-induced rat intestinal neoplasia. Gastroenterology 1986;91:796–802.
70 Deschner EE, Ruperto JF, Lupton JR, et al. Dietary butyrate (tributyrin) does not enhance AOM-induced colon tumori-genesis. Cancer Lett 1990;52:79–82.
71 Boisteau O, Gautier F, Cordel S, et al. Apoptosis induced by sodium butyrate treatment increases immunogenicity of a rat colon tumor cell line. Apoptosis 1997;2:403–12. 72 Perrin P, Cassagnau E, Burg C, et al. An interleukin
2/sodium butyrate combination as immunotherapy for rat colon cancer peritoneal carcinomatosis. Gastroenterology 1994;107:1697–708.
73 Sekine K, Ushida Y, Kahura T, et al. Inhibition of initiation and early stage development of aberrant crypt foci and enhanced natural killer activity in male rats administered bovine lactoferrin concomitantly with azoxymethane.
Can-cer Lett 1997;121:211–16.
74 Pierre F, Perrin P, Bassonga E, et al. T-cell status influences colon tumors occurence in Min mice fed short-chain fructo-oligosaccharides as a diet supplement. Carcinogenesis 1999;20:1953–6.