HAL Id: hal-02368203
https://hal.archives-ouvertes.fr/hal-02368203
Submitted on 18 Nov 2019
HAL is a multi-disciplinary open access
archive for the deposit and dissemination of
sci-entific research documents, whether they are
pub-lished or not. The documents may come from
teaching and research institutions in France or
abroad, or from public or private research centers.
L’archive ouverte pluridisciplinaire HAL, est
destinée au dépôt et à la diffusion de documents
scientifiques de niveau recherche, publiés ou non,
émanant des établissements d’enseignement et de
recherche français ou étrangers, des laboratoires
publics ou privés.
Different Active Measurement Systems
Jaeyoung Choi, Géraldine Texier, Yongho Seok, Taekyoun Kwon, Laurent
Toutain, Yanghee Choi
To cite this version:
Jaeyoung Choi, Géraldine Texier, Yongho Seok, Taekyoun Kwon, Laurent Toutain, et al..
Interoper-ability Experience on Integrating between Different Active Measurement Systems. Lecture Notes of
the Institute for Computer Sciences, Social Informatics and Telecommunications Engineering, 2006,
3961, pp.630 - 638. �hal-02368203�
Interoperability Experiences on Integrating
between Different Active Measurement Systems
?
Jaeyoung Choi1, Geraldine TEXIER2, Yongho Seok1, Taekyoung Kwon1,
Laurent TOUTAIN2, and Yanghee Choi1
1 School of Computer Science and Engineering
Seoul National University, Seoul, Korea
{jychoi, yhseok, tkkwon, yhchoi}@mmlab.snu.ac.kr
2 RSM Department
ENST Bretagne, Rennes, France
{geraldine.texier, laurent.toutain}@enst-bretagne.fr
Abstract. Traffic measurement is an important issue in IP networks for both internet service providers and users. Over the past decade, a number of active measurement tools have been implemented to measure and analyze IP networks. By making these tools interoperable, we can measure a wide network that encompasses different administrative do-mains.
In this paper, we present the accumulated observation from our project, which integrates two different traffic measurement systems : Active Mea-surement Tool (AMT) and Saturne. The integrated meaMea-surement infras-tructure, STAR, can measures one-way delay, one-way delay jitter, and packet loss rate metrics, as defined at the IETF. By using STAR, we have measured the network between Korea and France. As a result, we found that the network between Korea and France connected by TEIN link is stable and has low loss rate.
Key words: Active Measurement, Traffic Measurement, System Integration, In-teroperability
1
Introduction
As the Internet is getting more and more complex and larger, measurement in-frastructures and methodologies become essential to characterize network traf-fic. The Internet Protocol Performance Metrics (IPPM) working group of the Internet Engineering Task Force (IETF) has developed several metrics for this purpose, such as one-way delay [1], one-way packet loss [2], instantaneous packet delay variation [3]. With measurement data obtained, we can effectively perform the network management and can understand the characteristics of network
well. For these purposes, there have been proposed many measurement tools like RIPE [4], Surveyor [5], Active Measurement Tool (AMT) [6], Saturne [7], PingER [8], AMP [9].
We can classify these tools into two categories. In Active measurement category, a measurement machine will explicitly inject measurement packets called probe packets in a path. Also, the sending machine and the receiving machine have to agree on the format of probe packets. On the other hand, the passive methodol-ogy doesn’t use an explicit measurement packet. Passive measurement is a means of tracking the performance and behaviour of packet streams by monitoring the traffic without creating or modifying it.
Most of active measurement infrastructures have developed its own measurement daemons. However, the characteristics of a specific network along the measured path is often limited by the scope of the path [10]. To measure a long network, there can be a lot of problems like economic cost or human resource unavailabil-ity. Alternatively, it can be a good solution to make multiple active measurement infrastructures interoperable.
When different active measurement infrastructures have been integrated, what to measure and how to measure have to be resolved before integration. What to measure is mainly related to metrics that will be provided by integrated measurement infrastructure. How to measure represents the functionalities of a measurement system. Even though several measurement systems provide the same metric, the detailed implementation of measurement can be quite different. There can be many issues int integrating different measurement infrastructures in the above two aspects. Examples of the most important issues are a method of time synchronization, a format of a probe packet, how to timestamp, a way to gather results, and generation of probe packets. We will describe each of these issues in Section 2.
The basic objective of our paper is to describe our experiences on integrating two different active measurement infrastructures, AMT of Korea and Saturne of France. To understand the network link between Korea and France, we make our infrastructures interoperable and perform measurements with Trans-Eurasia Information Network (TEIN) link. This paper is organized as follow; Section 2 presents general issues in integrating and compares the conventional active mea-surement tools. In Section 3, we describe our active meamea-surement infrastructure, AMT and Saturne, respectively. Then, we explain detailed issues on interoper-ability and how to solve those issues in Section 4. We also show the result of one-way delay measurement in real network (TEIN) in Section 5. Finally, we conclude this paper.
2
Issues in integration
In this section, we will talk about design issues in integrating two different mea-surement systems. As mentioned before, we consider five consideration points in integration.
Interoperability between Different Active Measurement Systems 3 Table 1. Comparison of Characteristics of Active Measurement Tools
AMT Saturne RIPE PingER AMP Time synchronization GPS GPS + NTP GPS NTP NTP Time-stamping location data link data link data link IP layer IP layer Measured delay one-way one-way one-way two-way two-way Result processing socket RPC rcp local N/A
Flow generation poisson linear poisson bursty linear random
– In the view point of interoperability, it will be recommendable to syn-chronize different measurement machines with same method. It is be-cause the accuracy of metric measured seperately along two asymmetric paths can be fully guaranteed only when the resolution of each emission point is same.
2. The format of probe packet
– Before providing interoperability between two different systems, it has to be decided what to measure with the integrated system. There can be some systems that cannot be integrated together. For example, one system measures some metrics in an end-to-end manner while another system does hop-by-hop. Between these systems, it is impossible to pro-vide interoperability.
– After the agreement on measuring metrics, the format of a probe packet has to be decided. We recommend to keep the probe packet format same among interoperating systems to easily make the infrastructures inte-grated.
3. Timestamping
– This issue is related to the policy where the stamping is done. When the timestamp field is filled at an application layer, layering delay can occur. From the one-way delay metric definition of IPPM, the layering delay has to be removed in active measurements.
– In integrating different systems, time-stamping has to be done at least the same layer to minimize the error bound of accuracy.
4. Result processing
– Each interoperable system must provide an interface to gather the mea-sured data. When a machine calculates result metrics from probe packets emitted by peer, it transmits them to its peer or a central database for storage. Therefore each measurement machine must provide an interface for this functionality.
5. Flow generation
– Flow generation means how often an measurement system generates probe packets. RIPE [4] schedules in proportion to poisson distribution which total average arrival rate is 1, PingER [8] uses the bursty form as flow distribution and AMP [9] generates according to linear random function for first 15 seconds per minutes. There is a trade-off between the accuracy of measurement and network overhead. And the flow of
probe packets itself can even affect the network characteristics in some extreme cases.
Table 1 summarizes comparison with the characteristics of some active measure-ment tools in the point of issues described above.
3
Two Active Measurement Systems
Start Time Stamp (seconds) Start Time Stamp (seconds) Start Time Stamp (seconds) Start Time Stamp (seconds)
Sequence Number Sequence Number Sequence Number Sequence Number
End Time Stamp (seconds) End Time Stamp (seconds) End Time Stamp (seconds) End Time Stamp (seconds) Start Time Stamp (microseconds) Start Time Stamp (microseconds) Start Time Stamp (microseconds) Start Time Stamp (microseconds)
End Time Stamp (microseconds) End Time Stamp (microseconds) End Time Stamp (microseconds) End Time Stamp (microseconds)
0 0 0 0 16161616 31313131 Packet Type (0) Packet Type (0) Packet Type (0) Packet Type (0) Timestamp (seconds) Timestamp (seconds)Timestamp (seconds) Timestamp (seconds) Timestamp (microseconds) Timestamp (microseconds) Timestamp (microseconds) Timestamp (microseconds) Sequence Number Sequence Number Sequence Number Sequence Number 0 0 0 0 16161616 31313131
(a) AMT (b) Saturne
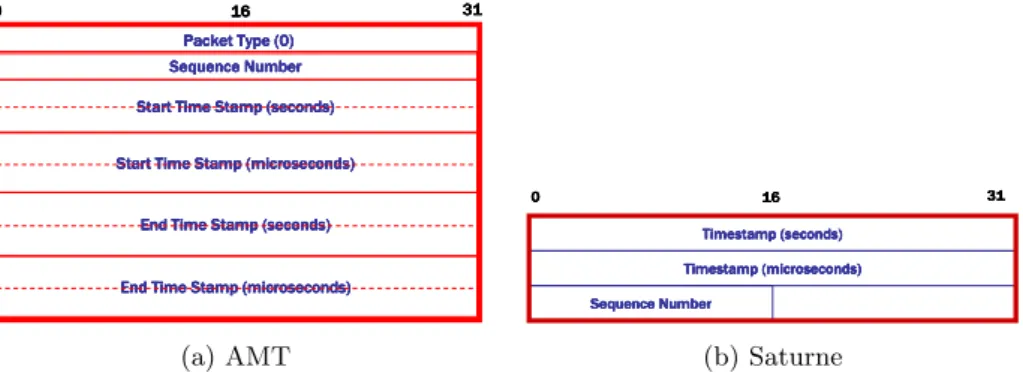
Fig. 1. Probe Packet Format
3.1 Active Measurement Tool (AMT)
Active Measurement Tool (AMT) is an active measurement infrastructure made by Seoul National University (SNU) in 2000. The AMT measurement architec-ture can measure one-way delay, one-way packet loss and one-way delay jitter. Measurement machines of AMT is synchronized by using “GPS Clock 200“ [11]. And time-stamping is performed at link layer by modified Free BSD kernel.
3.2 Saturne
Saturne is an active measurement infrastructure made by “Groupe des ecoles des telecommunications / Ecole Nationale Superieure des Telecommunications de Bretagne“ (GET/ENST) in 2003. The Saturne architecture performs end-to-end active measurements of one-way delay and packet loss rate. The Sat-urne architecture uses Trimble smart antenna [12] as a source of network time protocol (NTP) [16]. Trimble’s GPS system generates a pulse-per-second PPS synchronized to UTC within +/- 100 ns. Time-stamping is achieved by AD-Serv/ALTQ [13] [14] tools.
Interoperability between Different Active Measurement Systems 5 Receive r DB System France France France
France KoreaKoreaKoreaKorea
Send er DB System (2) send probe packets (3) insert result data to DB (using RPC) (3) insert result data to DB (using RPC)
(1) configure about measurement by editing local config file manually -- destination measurement system address
-- measurement time -- lambda value of poisson process
Web Server Web Server
http://saturne.ipv6.rennes.enst http://saturne.ipv6.rennes.enst http://saturne.ipv6.rennes.enst http://saturne.ipv6.rennes.enst----bretagne.fr/bretagne.fr/bretagne.fr/bretagne.fr/
http://147.46.114.117/ http://147.46.114.117/ http://147.46.114.117/ http://147.46.114.117/
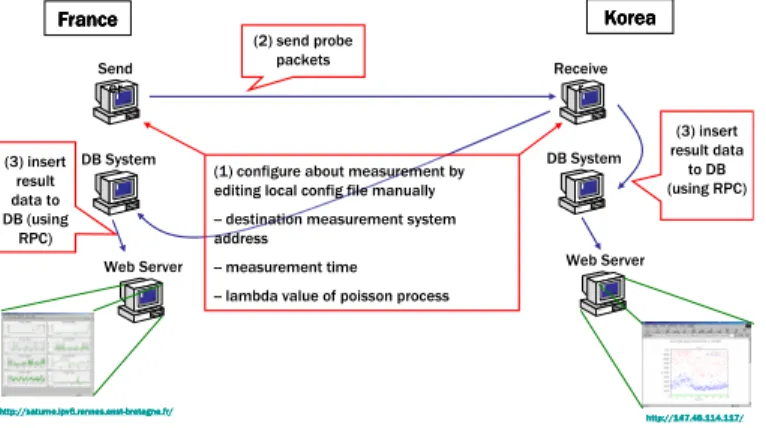
Fig. 2. Integrated Infrastructure
4
Interoperability between AMT and Saturne
As described in the previous section, we integrated with AMT and Saturne. Figure 2 shows the architecture of our integrated infrastructure, STAR, and message flow for traffic measurement. Each measurement machine located at Korea and France is configured with IP address of peer measurement machine, start time and duration of measurement and traffic generation parameters (total average arrival rate of poisson process) before measurement. When the mea-surement starts, meamea-surement machines periodically send probe packets. Once receiving a probe packet, STAR daemon calculates metrics and stores them to both database server maintained by Korea and France using Remote Procedure Call (RPC). The graph of the measured traffic is serviced by database server and can be displayed in real time (http://star.apan.snu.ac.kr). In this section, we will list some issues in interoperability and describe how to solve each issue.
4.1 Time Synchronization
Synchronization is one of the most important element in active measurement architecture in order to measure IP networks accourately. Both AMT and Sat-urne uses GPS as a source of NTP even though they use different GPS product. It can be possible to use CDMA technology as the GPS is so expensive and we have to maintain several measurement machines. The way to use CDMA is more cheap, but its accuracy about time resolution does not match with GPS.
4.2 Probe Packet Format
The most important fields in the probe packet format are timestamp and se-quence number fields. Both AMT and Saturne have these two fields though the sequence of these fields is different. But, the problem in designing new probe
Start Time Stamp (seconds) Start Time Stamp (seconds) Start Time Stamp (seconds) Start Time Stamp (seconds)
Sequence number Sequence number Sequence number Sequence number
End Time Stamp (seconds) End Time Stamp (seconds)End Time Stamp (seconds) End Time Stamp (seconds) Start Time Stamp (microseconds) Start Time Stamp (microseconds) Start Time Stamp (microseconds) Start Time Stamp (microseconds)
End Time Stamp (microseconds) End Time Stamp (microseconds) End Time Stamp (microseconds) End Time Stamp (microseconds)
TTL of IP header TTL of IP headerTTL of IP header TTL of IP header TOS of IP header TOS of IP header TOS of IP header TOS of IP header 0 0 0 0 16161616 31313131 dummy data dummy datadummy data dummy data dummy data cont dummy data cont dummy data cont
dummy data cont’’’’d (if needed)d (if needed)d (if needed)d (if needed)
Fig. 3. Probe Packet Format of STAR
packet format was a field for AMT’s control plane. We will provide a control plane in future work.
Figure 1 shows the probe packet format of AMT and Saturne before integra-tion. While AMT needs extra payload field to enable the application to access the receiving timestamp field, Saturne uses BSD Packet Filter (BPF) [15] and therefore Saturne doesn’t need extra receiving timestamp field. Besides AMT has a packet type field in order to distinguish a probe packet from control packets. Figure 3 shows the probe packet format of STAR. In order to integrate with-out much modification of each system, we decide to keep its own timestamping mechanism of AMT and Saturne. A receiving measurement machine of STAR in Korea reads a timestamp, TTL, and TOS field at application layer while a receiving machine in France does the same functions at link layer. There are two kinds of timestamp field, start and end. A start timestamp field is filled at the link layer of sending machine, and an end timestamp at the same layer of re-ceiving machine. In order to modify the value of a start timestamp at link layer, we disable a checksum function of UDP. The TTL and TOS fields in payload is equal to those of IP header. These fields are added because of the limitation about AMT’s implementation method. Lastly the dummy field ensures the probe packet to be of the same size even after inserting some extra fields later. It is important for the exact mathematical analysis to keep the size of probe packets same between several experiments.
4.3 Time-stamping Location
AMT uses the socket library to send and receive probe packets and there are no access mechanism to write/read timestamp fields in ethernet layer. In AMT, modified ethernet layer performs to fill the value of receive time the stamp field in application payload with system time synchronized by GPS. To do this, FreeBSD
Interoperability between Different Active Measurement Systems 7
kernel of AMT measurement machines have been modified. This is why the re-ceiving field is needed in AMT unlike Saturne. Unlike AMT, Saturne uses the ADServ/ALTQ mechanism for time-stamping. By using ADServ/ALTQ mech-anism, Saturne can read or write directly probe packet header in link layer. In integrating two different measurement tools, it is important to record the emission and reception timestamp at the same layer to remove layering delay. In order to approximate our result one-way delay value to its definition of IPPM (it is defined at RFC 2679 [17] ), we agreed to timestamp at link layer. And because we don’t want to modify too much parts of each system for interoperability, we decided to have time-stamp fields in probe packet format and AMT accesses them in application layer, while Saturne does the same functions in link layer.
4.4 Gathering Results
When the user gives a gathering command to the control server in AMT, the control server signals to specific measurement machines to inform data gathering. Right after receiving that signal, “gathering thread“ of each measurement ma-chine will send its measured data to “db daemon“ of the control server by means of TCP socket communications. In Saturne, data gathering process is invoked whenever a probe packet arrives. After receiving and calculating with arriving probe packets, the result is stored at the central database by using Remote Pro-cedure Call (RPC) communications. The central database server provides an RPC interface to store the result data to its database, and administers an RPC server daemon.
Regarding integrated infrastructure, it is simpler and easier to implement to use RPC for gathering results which is adopted in STAR.
5
Experimental Results
The STAR architecture has been operating between Korea and France through TEIN link. TEIN link connects KOrea REsearch Network (KOREN) in Korea and Renater in France together. We install two measurement machines at KO-REN and Renater, respectively. In order to validate the implementation of STAR architecture, we have performed several sets of experiments. In this section, we show the measurement results of an experiment that is carried out from January 1st 2005 to January 15th 2005. The graphs of measurement results are available at http://star.apan.snu.ac.kr.
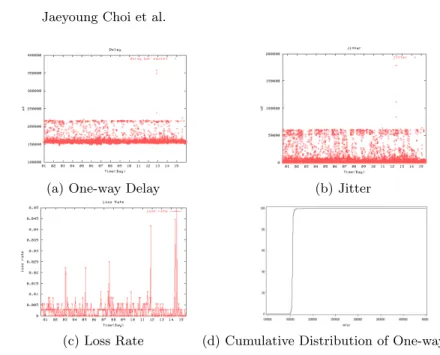
Figure 4 shows graphs of these three metrics. One-way delay is calculated from values of time-stamp field of received probe packets. As described before, there are two time-stamp fields such as sendtime and recvtime in the probe packet for-mat, and obviously one-way delay is recvtime minus sendtime. These values are calculated by a micro-second unit for a more accurate measurement. As showing at figure 4 (a), one-way delay values of this network look stable, and they mainly range from about 150 ms to about 220 ms. Therefore the jitter value of one-way delay is quite small as shown at figure 4 (b). Lastly, loss rate of this network is
(a) One-way Delay (b) Jitter
(c) Loss Rate (d) Cumulative Distribution of One-way Delay Fig. 4. Measurement results
low, too. At figure 4 (c), most of loss rate values are distributed below 0.5%. We hastily thought that this network path, that is KOREN-TEIN-Renater, has a stable characteristics than other path between Korea and France. In the follow-ing section, we are gofollow-ing to show some statistical data to confirm this judgment. Table 2 shows statistical data about figure 4 (a). Maximum one-way delay is
Table 2. Statistics of one-way delay value (unit µs) Total Number 129120 Maximum 408596 Minimum 147488 Average 155632.75 Median 155450 Lower Quartile 154743.0 Upper Quartile 156046.0 Standard Deviation 3657.80
about 400 ms and minimum is about 140 ms. Average value is about 155 ms and median is also about 155 ms. And from two quartile values and standard deviation of one-way delay values, we can conclude there is not much variation of one-way delay values in this network path because standard deviation is only 3 ms, and it is quite small value. Figure 4 (d) supports this conclusion, showing
Interoperability between Different Active Measurement Systems 9
us that most of one-way delay values are around 150 ms. But, we must not jump to the conclusion that this network path is better than others, since we don’t know whether the average value of one-way delay, 150 ms, is smaller than others or not. The comparison with other network paths will be depicted in the analysis paper. From table 2, we suggest that this network path is partially qualified to serve a multimedia application since variation of one-way delay is small and loss rate of this path is quite low.
6
Conclusion
In order to measure the network, there has been implemented several measure-ment tools. By making different active measuremeasure-ment infrastructures interopera-ble, we can get significant benefits. To illustrate the feasibility, SNU in Korea and GET/ENST in France integrate their own active measurement tools, AMT and Saturne. In integrating different measurement systems, there are many design issues such as how to synchronize measurement machines, how to time-stamp a probe packet, how to gather results, what to measure. We have integrated the format of probe packet, time-stamping location, result metrics, database schema, and how to gather results. We successfully implement the integrated active measurement infrastructure, STAR. To validate this system and to ana-lyze the characteristics of network path, KOREN-TEIN-Renater, we performed a measurement for about two weeks and found that a variation of one-way delay in this network path is small and loss rate is low too.
References
1. G. Almes et al, “A One-way Delay Metric for IPPM,“ RFC 2679, September. 1999.
2. G. Almes et al, “A One-way Packet Loss Metric for IPPM,“ RFC 2680, Septem-ber. 1999.
3. C. Demichelis and P. Chimento, “IP Packet Delay Variation Metric for IPPM,“ draft-ietf-ippm-ipdv-08.txt, November 2001.
4. F. Georgatos, F. Gruber, D. Karrenberg, M. Santcroos, A. Susanj, H. Uijter-waal, and R. Wilhelm. “Providing Active Measurements as a Regular Service for ISP’s,“ In Passive and Active Measurements Workshop, April. 2001. 5. http://www.advanced.org/surveyor.
6. Jaehoon Jeong, Seungyun Lee, Yongjin Kim, and Yanghee Choi. “Design and Implementation of One-way IP Performance Measurement Tool,“ ICOIN, 2002. 7. J. Corral, G. Texier, and L. Toutain, “End-to-End Active Measurement Ar-chitecture in IP Networks (SATURNE),“ Proceedings of Passive and Active Measurement Workshop PAM’03, La Jolla, CA, 2003.
8. W. Matthews and L. Cottrel, “The PingER project: Active Internet perfor-mance monitoring for the HENP community,“ IEEE Communications, vol. 38, no. 5, pp. 130–136, May 2000.
10. Maheen Hasib and John A. Schormans, “Limitations of Passive & Active Mea-surement Methods In Packet Networks,“ London Communications Symposium 2004, September. 2004.
11. http://www.gpsclock.com. 12. http://www.trimble.com.
13. http://www.rennes.enst-bretagne.fr/˜medina/ds-imp/.
14. K. Cho, “The design and implementation of the altq traffic management sys-tem,“ Ph.D. dissertation, Keio University, 2001.
15. S. McCane and V. Jacobson, “The bsd packet filter: A new architecture for user-level packet capture,“ 1993.
16. http://www.eecis.udel.edu/˜ntp. 17. http://www.faqs.org/rfcs/rfc2679.html.